


Single-Cell Immune Microenvironment Atlas of Human Myocardial Infarction Focusing on Myeloid Cells and Functional Differentiation of Macrophage Subtypes
Zhenzhen Zhao1,a,b , Xuheng Dou2,a,b, Fu Zhao3,a,b, Hongling Jia4, Wenyang Nie5, Yumeng Li6, Wenguang Hou1, Yuchao Hou1 and Jing Li1,*
1Yueyang Hospital of Integrated Chinese and Western Medicine, Shanghai University of Traditional Chinese Medicine, Shanghai 200437, China
2Henan Medical University, Henan 453000, China
3School of Traditional Chinese Medicine, Jinan University, Guangzhou 510632, China
4The First Clinical Medical College of Shandong University of Traditional Chinese Medicine, Jinan 250014, China
5Shuguang Hospital Affiliated to Shanghai University of Traditional Chinese Medicine, Shanghai 201203, China
6Xiyuan Hospital, China Academy of Chinese Medical Sciences, Beijing 100091 China
aContributed equally.
bCo-First Author.
*Correspondence to: Jing Li, Yueyang Hospital of Integrated Chinese and Western Medicine, Shanghai University of Traditional Chinese Medicine, Shanghai, 200437, China. E-mail: LIJINGacu@126.com
Received: February 1 2026; Revised: May 30 2026; Accepted: August 5 2026; Published Online: September 7 2026
Cite this paper:
Zhao Z, Dou X, Zhao F et al. Single-Cell Immune Microenvironment Atlas of Human Myocardial Infarction Focusing on Myeloid Cells and Functional Differentiation of Macrophage Subtypes. BIO Integration 2026; 7: 1–17.
DOI: 10.15212/bioi-2026-0022. Available at: https://bio-integration.org/
Download citation
© 2026 The Authors. This is an open access article distributed under the terms of the Creative Commons Attribution License (https://creativecommons.org/licenses/by/4.0/). See https://bio-integration.org/copyright-and-permissions/
Abstract
Background: Myocardial infarction (MI) is characterized by extensive immune activation and dynamic remodeling of the cardiac microenvironment, in which myeloid cells play critical roles in regulating inflammation and tissue repair. However, the cellular heterogeneity, developmental trajectories, and intercellular communication networks of myeloid cell subtypes during MI remain incompletely understood.
Methods: Single-cell RNA sequencing (scRNA-seq) data from MI tissues were integrated to construct a comprehensive immune atlas. Cell clustering, differential expression, cell cycle, and functional enrichment analyses were performed to characterize cellular composition and biological functions. CytoTRACE, Monocle2, and Slingshot were applied to investigate macrophage differentiation trajectories, whereas transcriptional regulatory network analysis and CellChat were used to identify regulatory modules and intercellular communication pathways.
Results: A total of 44,574 high-quality cells comprising 24 cell types were identified, which revealed prominent myeloid cell accumulation and enhanced immune activation in infarcted tissues. Macrophages were enriched in infarcted regions and exhibited increased proliferative activity and immune-related pathway activation. Four transcriptionally distinct macrophage subtypes were identified (C0 GPNMB+, C1 S100A4+, C2 IL1B+, and C3 EGR1+), among which C1 S100A4+ macrophages predominated, displayed the strongest proliferative ability, and expressed high levels of inflammatory mediators, including IL1B, CCL3, and CXCL8. Trajectory and regulatory analyses revealed dynamic macrophage differentiation and subtype-specific transcriptional programs. Cell-cell communication analysis identified C1 S100A4+ macrophages as a central signaling hub interacting with endothelial cells, fibroblasts, and immune cells through CXCL, MHC-II, and TNF pathways, thereby suggesting their critical role in post-MI inflammatory remodeling.
Conclusion: This study provided a comprehensive single-cell immune atlas of MI and systematically elucidated the heterogeneity, developmental dynamics, transcriptional regulation, metabolic reprogramming, and intercellular communication of macrophage subtypes. C1 S100A4+ macrophages were identified as a key inflammatory population orchestrating immune remodeling after MI. Our findings provide insights into the cellular mechanisms underlying cardiac injury that may offer potential therapeutic targets for precision immunomodulation in MI.
Keywords
Cell communication; cellular heterogeneity; immune microenvironment; macrophages; myocardial infarction; single-cell RNA sequencing.
Introduction
Cardiovascular disease (CVD) is the leading cause of morbidity and mortality globally. According to data from the World Health Organization, CVD accounts for approximately 17.8 million deaths annually, representing approximately 30% of total global mortality [1]. Myocardial infarction (MI), frequently referred to as heart attack, is among the most severe forms of CVD, given its high incidence, mortality, and morbidity. The pathological basis of MI involves acute occlusion of the coronary arteries resulting in persistent myocardial ischemia and hypoxia, which subsequently trigger a series of complex pathophysiological processes including myocardial cell necrosis, activation of inflammatory responses, and ventricular remodeling [2–4]. Although reperfusion therapy and pharmacological treatments [5] have substantially improved patient outcomes, complications such as microvascular dysfunction [6] and hemorrhage remain major contributors to mortality and disability. Because immunological heterogeneity plays a critical role in CVD [7], the underlying pathological mechanisms and the complex immune microenvironment [8] between infarcted regions and surrounding viable myocardium require further exploration.
Given the extensive heterogeneity of cardiac tissue after MI [9], a systematic single-cell resolution comparison of cellular composition, enriched pathways, molecular expression, and intercellular interaction networks between MI and non-myocardial infarction (NMI) contexts is crucial. Such a comparison would provide substantial scientific and clinical value by elucidating the underlying pathological mechanisms of MI, identifying key cell subtypes and signaling pathways that drive disease progression, and uncovering potential therapeutic intervention targets.
In recent years, the rapid development of single-cell RNA sequencing (scRNA-seq) technology has provided a powerful tool for systematic analysis of tissue microenvironment heterogeneity and mapping cellular landscapes at the single-cell level [10]. This technology surpasses traditional methods [11] by increasing the resolution of biological research data from the tissue level to the single-cell level. This method has markedly enhanced understanding of complex biological systems and offered unprecedented tools for studying disease mechanisms, discovering biomarkers, and developing innovative therapies [12].
Herein, using scRNA-seq technology, we performed a systematic analysis of paired clinical samples collected from infarcted vs. non-infarcted regions in patients with MI, to clarify the differences in spatial distribution, cell cycle, and transcriptional characteristics of key cell types (including cardiomyocytes, fibroblasts, endothelial cells, and immune cells). Spatial heterogeneity of immune cells after MI had been addressed in previous publications [13], but paired comparisons in the same patients were limited. We specifically focused on myeloid cells, which play a dual role after MI by both promoting cardiac repair and exacerbating cardiac injury, including macrophages, monocytes, and dendritic cells [14, 15]. We analyzed the heterogeneity of their subtypes, metabolic state reprogramming features, and other characteristics in both MI and NMI. Prior studies have demonstrated that myeloid cells play complex and crucial roles in various processes after myocardial injury, such as initiating inflammation, clearing necrotic tissue, transmitting pro-repair signals, and regulating fibrosis [16]. However, the heterogeneity of myeloid cells in various regions of human MI, their state transition patterns, and their specific responses to the microenvironment remained unclear [17]. Previous studies have demonstrated the critical roles of macrophages in the MI process, such as initiating inflammation and promoting fibrosis [18], and have provided evidence of their heterogeneity within the infarcted tissue [19]. However, an integrated analysis linking macrophage subtype-specific transcriptional regulation, metabolic reprogramming, and intercellular communication in the human infarcted heart remained lacking. We therefore further investigated functionally distinct macrophage subtypes by exploring their developmental trajectories; transcriptional regulatory networks; and complex ligand-receptor-mediated cell communication with other cell types, such as fibroblasts, endothelial cells, and T cells. Finally, by integrating multi-omics analysis, we sought to identify key cell subtypes and molecular nodes that might drive pathological inflammation or promote the repair process.
This study was aimed at providing a high-resolution immune microenvironment atlas of MI through comprehensive single-cell analysis, thereby addressing the aforementioned knowledge gaps by systematically dissecting region-specific myeloid cell heterogeneity and intercellular networks in human MI tissues. Beyond mapping cellular heterogeneity, metabolic adaptation, cellular interactions, and developmental evolution, this study provided deeper insights into the pathological mechanisms underlying MI. The identification of key cell subtypes, characteristic molecular markers, and active signaling pathways might offer new insights into the mechanisms of ventricular remodeling after MI. Furthermore, these findings offer a solid molecular and cellular foundation for the future development of precision immunotherapeutic strategies targeting specific immune cell subtypes or modulating critical inflammatory and repair signaling pathways.
Materials and methods
Data acquisition and selection
ScRNA-seq data for MI were obtained from the Gene Expression Omnibus (GEO) database (GSE145154) [17]. After rigorous quality control, low-quality cells were excluded, thus resulting in a final dataset comprising 44,574 cells [20]. Strict quality control was performed in Seurat [21] to exclude low-quality cells, including doublets and cells with low expression of mitochondrial and erythrocyte genes. Cells were filtered according to the following criteria: feature count (nFeature) between 300 and 5000, and gene count (nCount) between 500 and 50,000.
ScRNA-seq data processing
We normalized the expression matrix with the NormalizedData function in Seurat and selected 2,000 highly variable genes by using the FindVariableFeatures function. Subsequently, the data were standardized with the ScaleData function [22]. PCA [23] was performed on these highly variable genes with the RunPCA function, and batch effect correction with the Harmony algorithm was subsequently conducted.
For clustering the dimensionality-reduced data, the FindNeighbors and FindClusters functions were applied. Dimensionality reduction and clustering analysis were then performed with Uniform Manifold Approximation and Projection (UMAP), and the results were visualized in two-dimensional space [24].
Cell type identification
Differentially expressed gene (DEG) analysis was performed with the FindAllMarkers function in Seurat with the Wilcoxon rank-sum test, according to thresholds of logfc.threshold 0.25 and min.pct=0.25 to identify robust marker genes. Major cell types were annotated according to the expression patterns of known marker genes [25]. To increase annotation accuracy, we incorporated reference datasets from the CellMarker database and published literature [26].
Gene enrichment analysis
Gene Ontology (GO) enrichment analysis is a widely used bioinformatics method for gene function annotation [27]. To systematically elucidate functional characteristics, this approach maps a target gene set to three categories: biological process (BP), molecular function, or cellular component. We conducted GO functional enrichment analysis of the identified DEGs using clusterProfiler software, and GO terms with an adjusted P-value [28].
Additionally, we conducted gene set enrichment analysis (GSEA) with clusterProfiler [29], with all genes pre-ranked by log₂ fold change, 1,000 gene-set permutations, and an adjusted P-value threshold of 0.05, to identify significantly enriched biological pathways within each cell cluster [30].
Metabolic pathway activity analysis
Dynamic functional states of metabolic networks were inferred through integration of multi-omics data with kinetic modeling. Metabolite concentration changes were directly measured with metabolomics, and pathway flux was inferred from substrate consumption and product accumulation patterns [31]. The expression levels of metabolism-related enzymes and transport proteins were assessed through transcriptomics or proteomics to evaluate pathway activation potential at the molecular regulatory level. In parallel, stable isotope tracing was used to quantitatively track the flow and rate of labeled precursors within the metabolic network, and computational models were used to directly quantify metabolic flux. This integrative approach can systematically uncover the complete functional linkage from gene expression regulation to actual metabolite transformation [32].
Key transcription factor analysis
We used pySCENIC to identify key transcription factors (TFs) active in each cell subtype. Regulon activity per cell was scored using the AUCell algorithm. The regulon activity matrix was binarized, and a UMAP embedding of cells was generated based on regulon activity to visualize regulatory patterns across cell subtypes [33].
Cell developmental trajectory inference
We first used CytoTRACE to estimate the differentiation potential of individual cells. We then reconstructed pseudotime trajectories with Monocle2 to order cells along differentiation trajectories and characterize transcriptional changes associated with cellular progression [34]. Finally, given that cell fate transitions often involve branching processes rather than a single linear path, we applied Slingshot to infer lineage trajectories according to cluster relationships and low-dimensional representations. This analysis generated branching lineage trajectories that captured major differentiation paths and potential branch points [35]. Together, these three approaches provided complementary perspectives on developmental dynamics, ranging from highly plastic states to more differentiated cellular fates.
Cell communication analysis
Single-cell communication analysis leverages single-cell transcriptomic data and integrates known ligand-receptor interaction databases to systematically infer intercellular signaling events. This approach first calculates the probability of ligand-receptor interactions according to cell type-specific gene expression profiles, thereby constructing intercellular signaling networks [36]. By comparing communication differences under various biological conditions, key signaling pathways and their involved cell types can be identified. Coupled with downstream functional enrichment analysis, this method aids in elucidating the mechanisms of cell microenvironment interactions and their roles in physiological and pathological processes. This analysis provides a crucial computational framework for enhanced understanding of intercellular regulatory networks [37].
Results
Single-cell transcriptomic atlas of MI
To investigate the tissue microenvironment in MI, we performed scRNA-seq on tissue samples from six patients with MI (Graphical Abstract), which revealed a distinct enrichment in myeloid cells in the infarct region and unique proliferative and metabolic features. After rigorous quality control, filtering, and dimensionality reduction clustering with UMAP, a total of 44,574 high-quality cells representing 24 distinct cell types. On the basis of established DEGs, cell clusters were annotated as T/NK cells, pericytes, myeloid cells, smooth muscle cells, fibroblasts, cardiomyocytes, B cells, endothelial cells, or mast cells. Key cell populations of interest, including myeloid cells, fibroblasts, and T/NK cells, were distinctly clustered and annotated with color-coded labels for clear identification (Figure 1A).
Figure 1 Ecosystem characterization of MI based on single-cell transcriptomic sequencing. (A) UMAP plot displaying the major cell types identified after single-cell sequencing analysis of the MI tissue microenvironment. (B,C) UMAP plots showing the distribution of cell cycle phases (G1, G2M, and S) and tissue types (MI and NMI) across cell types. (D) UMAP plot illustrating the stemness feature scores across cell types. (E) Bubble plot depicting the top five DEGs. (F,G) UMAP plots for G2M.Score, S.Score, nFeature RNA, and nCount RNA across cell types. (H) Box plots comparing the differences in G2M.Score, S.Score, nFeature RNA, and nCount RNA across cell types. (I) Stacked bar plot showing the proportion of each cell type by cell cycle phase. (J) Stacked bar plot displaying the distribution of cell types across cell sample types. (K) Enrichment analysis depicting the expression levels of biological pathways by cell type. (L) Volcano plots presenting the top five upregulated and downregulated DEGs across cell types. (M) GSEA plots.
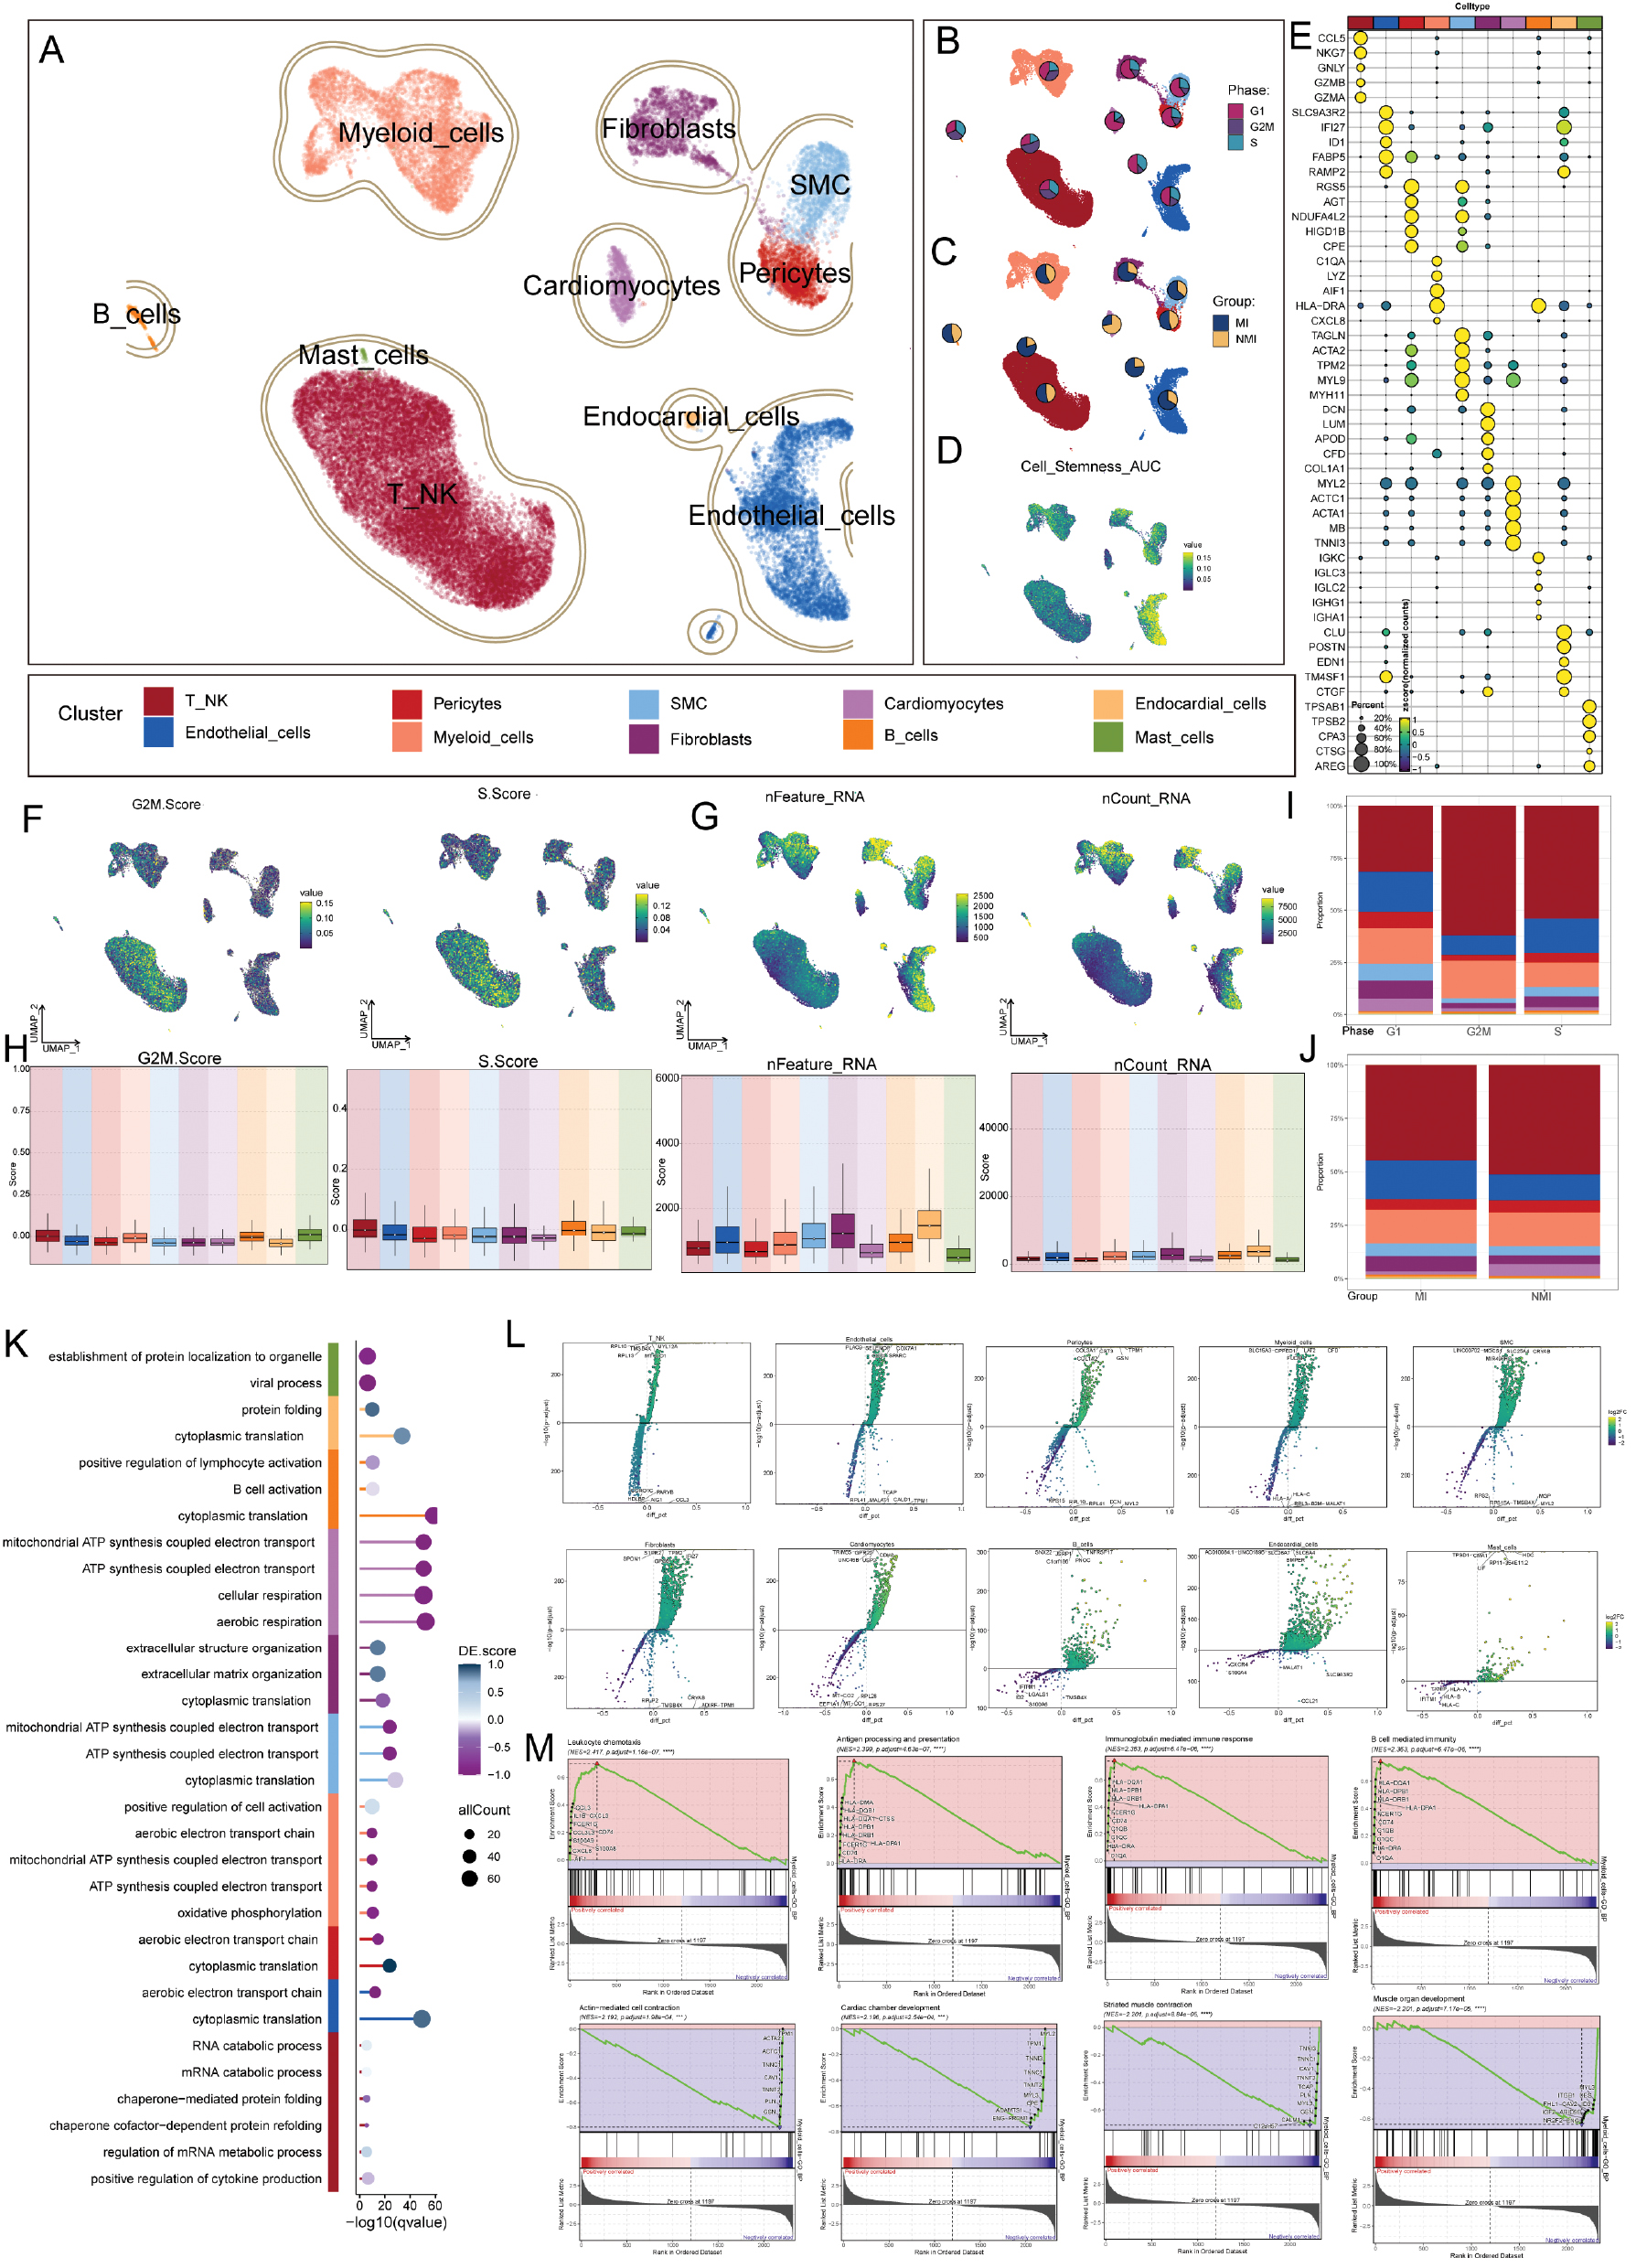
Further cell cycle analysis revealed the proliferative status of each cell population. Notably, myeloid cells exhibited a higher proportion of cells in the S and G2/M phases than in the G1 phase, thereby indicating robust proliferative activation within the MI microenvironment, which might contribute to sustained inflammation (Figure 1B,I). A comparison of cell type distributions between infarcted and non-infarcted regions indicated that myeloid cells localized predominantly to infarcted areas (Figure 1C,J). In parallel, we assessed the stemness characteristics of these cell populations (Figure 1D). The top five DEGs for each cell type are shown in Figure 1E. The UMAP plots and box plots present the cell cycle scores (G2M.Score and S.Score) and transcriptomic features (nFeature RNA and nCount RNA) of various cell types (Figure 1F–H).
To elucidate the roles of different cell types in the MI process at the functional pathway level, we conducted GO-BP [38] enrichment analysis of cell types. Myeloid cells were substantially enriched in pathways associated with glycolysis, the aerobic electron transport chain, and mitochondrial ATP synthesis coupled electron transport (Figure 1K). Consequently, myeloid cells might enhance energy metabolism to adapt to the high-energy demands of the inflammatory environment, thus closely associating with inflammatory stress responses and aligning with the pathological processes of MI. A volcano plot indicated the top five upregulated and downregulated DEGs in various cell types (Figure 1L). The results of GSEA are shown in Figure 1M.
Our single-cell transcriptomic profiling of MI tissue revealed myeloid cells as a key population potentially contributing to disease progression through metabolic reprogramming and inflammatory responses. Despite being limited by sample size and observational constraints, these findings provided potential therapeutic targets for modulating post-MI immune responses.
Heterogeneity of myeloid cells in MI and their role in inflammation and metabolism
Given that myeloid cells have critical roles as central participants in the cardiac immune response after MI, we further explored their cellular heterogeneity. Through dimensionality reduction and clustering analysis, we identified three functional subtypes within the myeloid cell compartment: macrophages, dendritic cells, and monocytes (Figure 2A,B). The distribution of these subtypes in MI and NMI tissues is shown in Figure 2C,J. Macrophages were substantially enriched in the MI region, given their central roles in the inflammatory response [39] and tissue repair after myocardial necrosis.
Figure 2 Analysis of myeloid cell characteristics in the MI tissue microenvironment based on single-cell transcriptomic sequencing. (A,B) UMAP plots showing the distribution of macrophages, monocytes, and DCs. (C) UMAP plot illustrating the tissue distribution of these three cell types in MI and NMI regions. (D) UMAP plot showing the proportion of cell cycle phases for each cell type. (E) Bubble plot displaying gene expression levels across cell types and tissue types. (F) Box plots comparing the proportional differences in macrophages, monocytes, and DCs between MI and NMI regions. (G,H) UMAP plots revealing differential expression of G2M.Score, S.Score, nFeature RNA, and nCount RNA in myeloid cells. (I) Box plots displaying the differences in G2M.Score, S.Score, nFeature RNA, and nCount RNA among cell types. (J,K) Heatmaps illustrating the distribution patterns of the three cell types across tissues and cell cycle phases. (L) Volcano plots depicting differential gene expression across the five cell subtypes. (M) Word cloud plots showing the enrichment in gene pathways across the five cell subtypes. Letter size represents the number of enriched pathways, and color reflects the high or low scores of the enriched pathways in the respective cell subtypes. (N) GO-BP enrichment analysis revealing the biological processes associated with the three cell types. (O) Bubble plots presenting the metabolic analysis results by cell type and tissue. (P) Box plots presenting the differential expression of corresponding metabolic pathways across cell types.
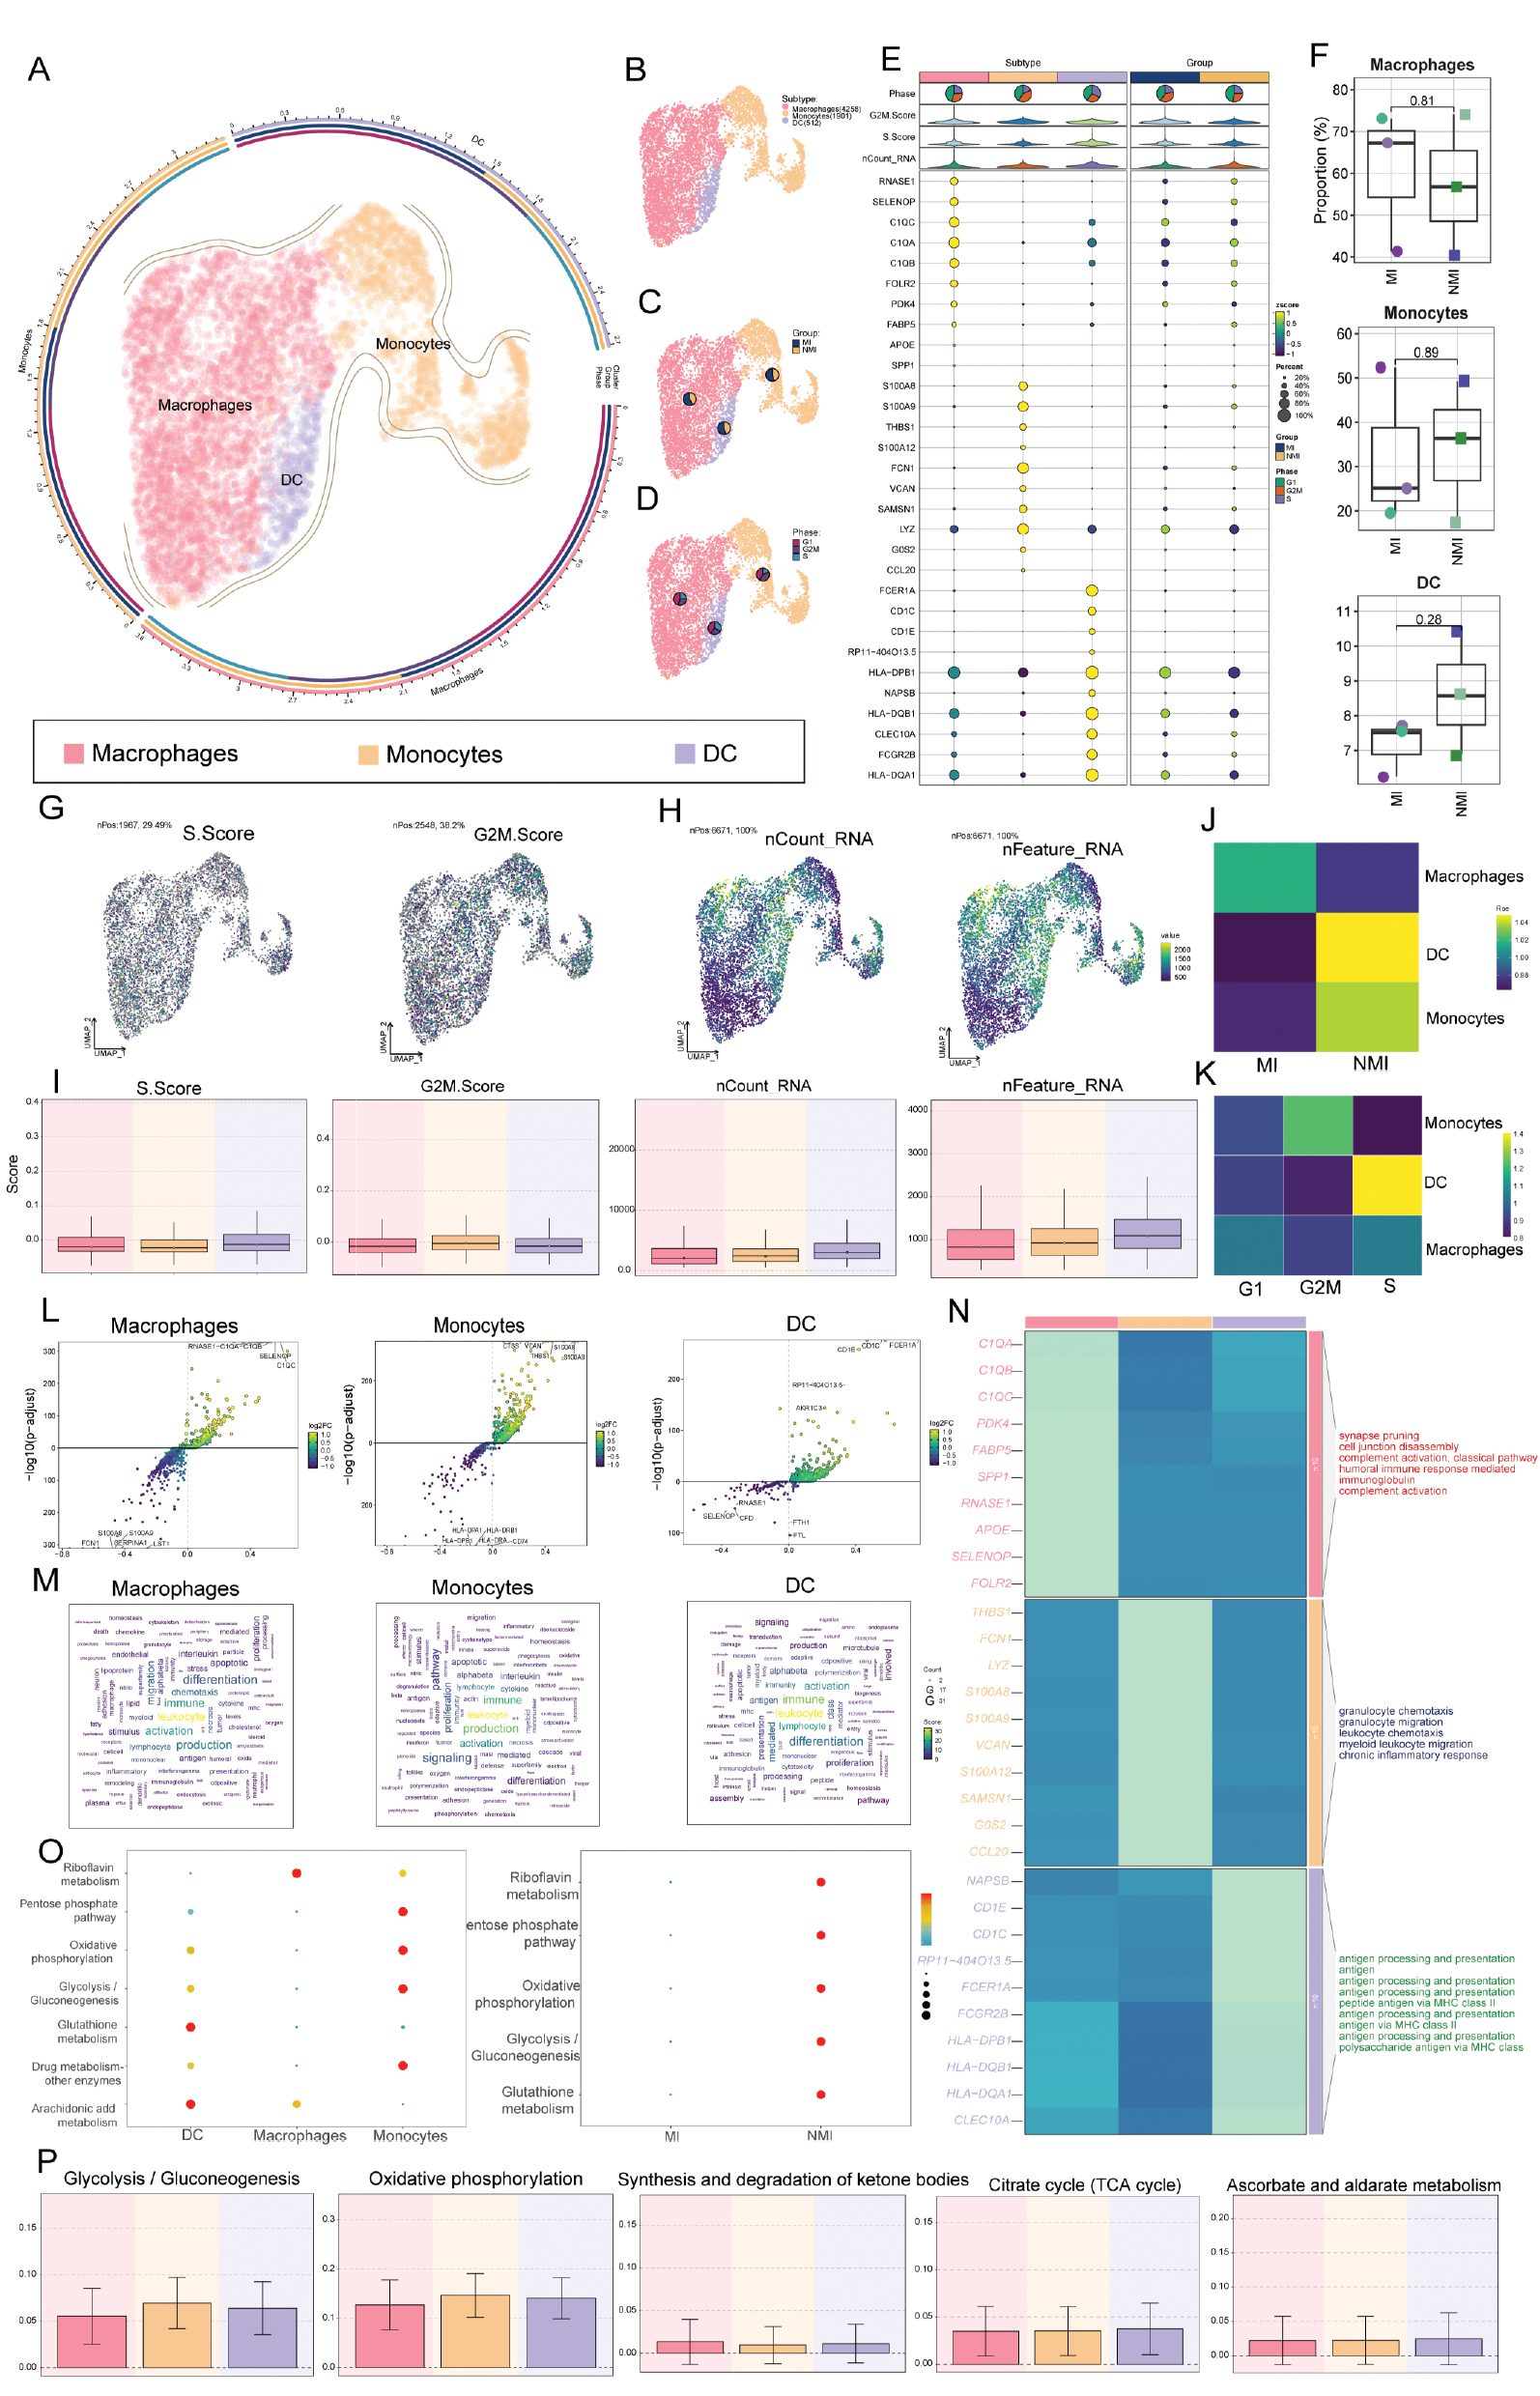
To further investigate the dynamic features of these subtypes, we performed a detailed analysis of their cell cycle distribution (Figure 2D,K). The differential gene expression profiles of the three myeloid cell subtypes are shown in Figure 2E. Boxplots visualizing the proportional differences between MI and NMI tissues revealed that macrophages were more abundant in MI tissue than NMI tissue (Figure 2F). We displayed the G2M.Score, S.Score, nFeature RNA, and nCount RNA of the three myeloid cell subtypes in UMAP plots and box plots (Figure 2G–I).
A volcano plot visualized the top five upregulated and downregulated DEGs for each myeloid cell subtype (Figure 2L). Word cloud plots and heatmaps presented the enrichment analysis results of these cell types. GO-BP enrichment analysis [40] indicated that macrophages were involved primarily in immunoglobulin-mediated humoral immunity and complement activation; monocytes were associated with the dynamic regulation of immune cells and chronic inflammation; and dendritic cells (DCs) were involved primarily in antigen processing and presentation (Figure 2M,N). The metabolic pathway activity of various myeloid cell types and tissues indicated that glutathione metabolism and arachidonic acid metabolism have enhanced activity in DCs; macrophages were enriched in riboflavin metabolism; and monocytes exhibited notable activity in the pentose phosphate pathway and oxidative phosphorylation (Figure 2O,P). At single-cell resolution, our findings highlighted the critical roles of macrophages in MI, revealed substantial metabolic and immunological heterogeneity among myeloid subpopulations, and provided a framework for the development of targeted precision immunotherapy strategies.
Heterogeneity, functional differentiation, and transcriptional regulatory mechanisms of macrophage subtypes in MI
Our previous analysis identified critical roles of macrophages in MI progression. To further investigate their heterogeneity, we performed a detailed analysis of macrophages and classified them into four subtypes according to their transcriptomic characteristics: C0 GPNMB+ macrophages, C1 S100A4+ macrophages, C2 IL1B+ macrophages, and C3 EGR1+ macrophages (Figure 3A, top). Further comparison of the distribution of these subtypes between MI and NMI, as well as across cell cycle phases, revealed that most macrophage subtypes were enriched in infarcted areas. C1 S100A4+ macrophages had the most notable proportion in the infarct tissue, thus suggesting their potential involvement in key pathological processes after MI. Cell cycle analysis indicated that the proportion of cells in G2/M phase was substantially higher in the C1 subtype than other subtypes (Figure 3A, bottom). Heatmaps further illustrated the aforementioned results. (Figure 3B). To elucidate the molecular characteristics of each subtype, we presented the top five highly DEGs specific to each subtype in a bubble plot, alongside their expression patterns in MI and NMI (Figure 3C). Notably, genes with higher expression in the C1 subtype, such as IL1B, CCL3, and CXCL8, were substantially upregulated in the infarcted tissue, thereby suggesting their prominent inflammatory features [36]. Analysis of the expression of subtype-specific signature genes for the four macrophage subtypes in UMAP plots and bar plots (Figure 3D,E) confirmed their expression specificity. We additionally used bar plots and UMAP plots to present the Count_RNA and nFeature RNA levels of the macrophage subtypes (Figure 3F,G). Additionally, bar plots depicting the cell cycle distribution and regional proportions of each subtype in various tissue types reaffirmed the notable dominance of the C1 subtype in the G2/M phase and infarcted regions (Figure 3H).
Figure 3 Macrophage characterization based on single-cell transcriptomic sequencing. (A) UMAP plots displaying the macrophage subtypes (top) and differential proportions of cell types across tissue types and cell cycle phases (bottom). (B) Heatmaps illustrating the distribution patterns of macrophage subtypes across tissues and cell cycle phases. (C) Bubble plot showing the top five highly expressed genes across macrophage subtypes. (D) UMAP plots presenting the expression of subtype-specific signature genes across macrophage subtypes. (E) Bar plots comparing proportion differences in subtype-specific signature genes across macrophage subtypes. (F,G) Bar plots and UMAP plots displaying the expression of Feature RNA and nCount RNA in macrophages. (H) Stacked bar plots displaying the proportions of four cell types across cell cycle phases and tissues, and faceted bar plots presenting the proportions of various cell cycle phases and tissue types within each cell type. (I) Word cloud plots depicting the enrichment pathways across the four macrophage subtypes. (J) Volcano plots showing differential gene expression across the four macrophage subtypes. (K) Heatmaps illustrating the regulatory activity levels of the top 20 metabolic pathways by macrophage subtype and tissue type. (L) Heatmap representing macrophage-related gene co-expression modules based on the connectivity-specific index, including six regulatory modules of macrophages (M1, M2, M3, M4, M5, and M6). (M) Expression levels of the top five TFs across the four macrophage subtypes and various tissues. (N) Bar plots comparing expression differences in M1–M6 regulatory modules across the four macrophage subtypes.
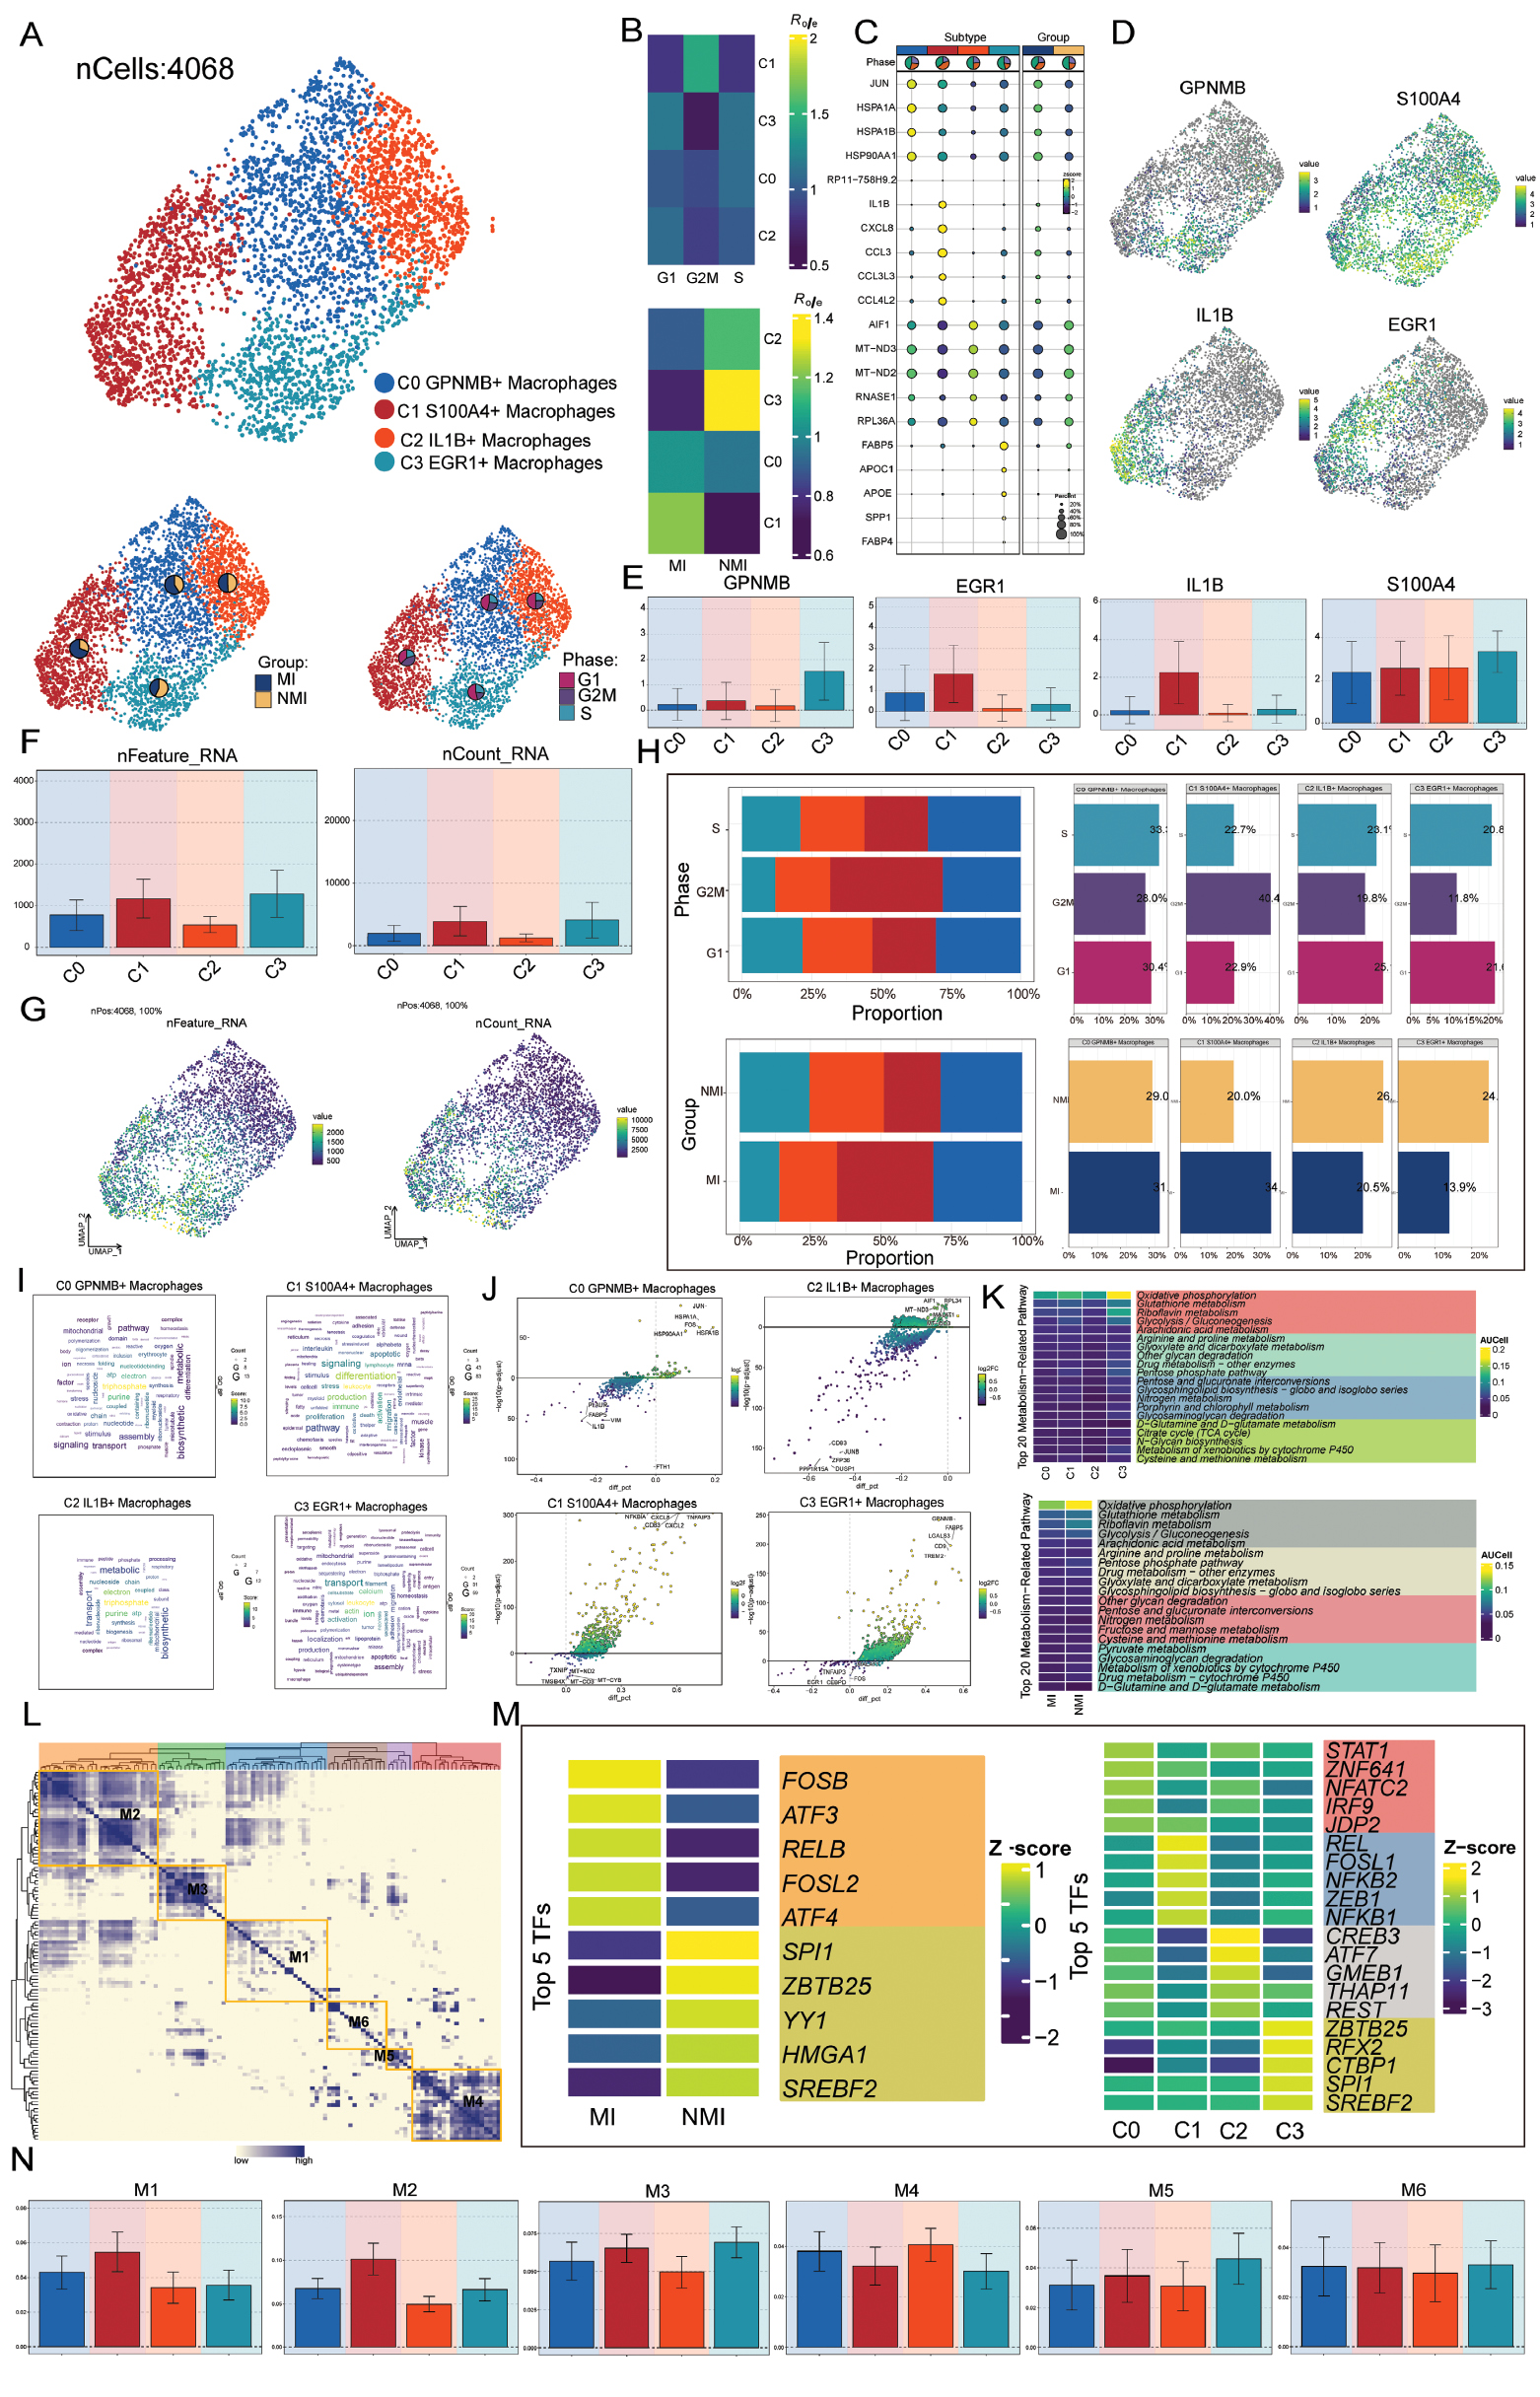
To investigate the biological functions and DEGs of each subtype, we performed functional enrichment analysis and differential gene visualization with word cloud plots and volcano plots (Figure 3I,J). Metabolic analysis revealed differences in the activity of metabolic pathways between the various macrophage subtypes and the MI and NMI groups (Figure 3K).
Additionally, we used a connectivity-specific index matrix to identify six regulatory modules within the macrophage subtypes. These modules were labeled as M1, M2, M3, M4, M5, and M6 (Figure 3L). A heatmap illustrating the macrophage subtypes and the high expression of TFs in MI and NMI provided new insights into the regulatory mechanisms of macrophages in MI (Figure 3M). Additionally, we used bar plots to visualize the regulatory activities of macrophage subtypes in the six modules. C1 S100A4+ macrophages exhibited the highest regulatory activity in both M1 and M2, whereas C3 EGR1+ macrophages showed the highest regulatory activity in M3 and M5; therefore, each subtype had a unique transcriptional regulatory network (Figure 3N).
Developmental trajectory and functional transformation mechanisms of macrophages in MI
To elucidate the differentiation and developmental relationships of the four macrophage subtypes, we used CytoTRACE technology to analyze the cellular differentiation process. The CytoTRACE [41] scores indicated that the C1 and C3 subtypes exhibited high stemness and low differentiation; therefore, these populations possess primitive characteristics and strong proliferative ability. In contrast, the C0 and C2 subtypes showed relatively weaker stemness. The CytoTRACE scores across tissue types and cell cycle stages were also determined (Figure 4A). To further investigate the genes associated with high or low differentiation, we visualized the correlation between these genes and CytoTRACE scores through bar plots and identified key genes associated with the differentiation process. Genes showing strong correlations included RPL10 and RPS2 (Figure 4B).
Figure 4 Visualization results of pseudotime analysis for macrophages. (A) Violin plots displaying the CytoTRACE score across cell subtypes, tissue types, and cell cycle phases. (B) Bar plot illustrating genes associated with CytoTRACE. (C,D) Two-dimensional trajectory plots visualizing the five differentiation stages, pseudotime scores, and the distribution of MI and NMI along the pseudotime axis. (E) Left: UMAP plot visualizing the distribution of four macrophage subtypes along the pseudotime axis. Right: facet plots showing the distribution of each subtype along the pseudotime axis. (F) Ridge plots depicting the pseudotime distribution of macrophage subtypes. (G) Scatter plots showing the expression changes in key genes in four macrophage subtypes along the pseudotime axis. (H) Left: Violin plot showing the distribution of four macrophage subtypes (C0–C3) along the pseudotime axis. Right: Stacked bar chart presenting the proportional composition of macrophage subtypes (C0–C3) across five cell states (state 1–5). (I) Violin plot comparing the distribution of pseudotime values across cells in cell cycle stages and between cells from MI and NMI tissues. (J) Slingshot simulation depicting two macrophage differentiation trajectories. (K) GO-BP enrichment analysis revealing the biological processes associated with the two differentiation paths in various macrophage subtypes. (L) Scatter plots illustrating the distribution paths of the key genes in the four macrophage subtypes along the two trajectories, visualized by Slingshot analysis.
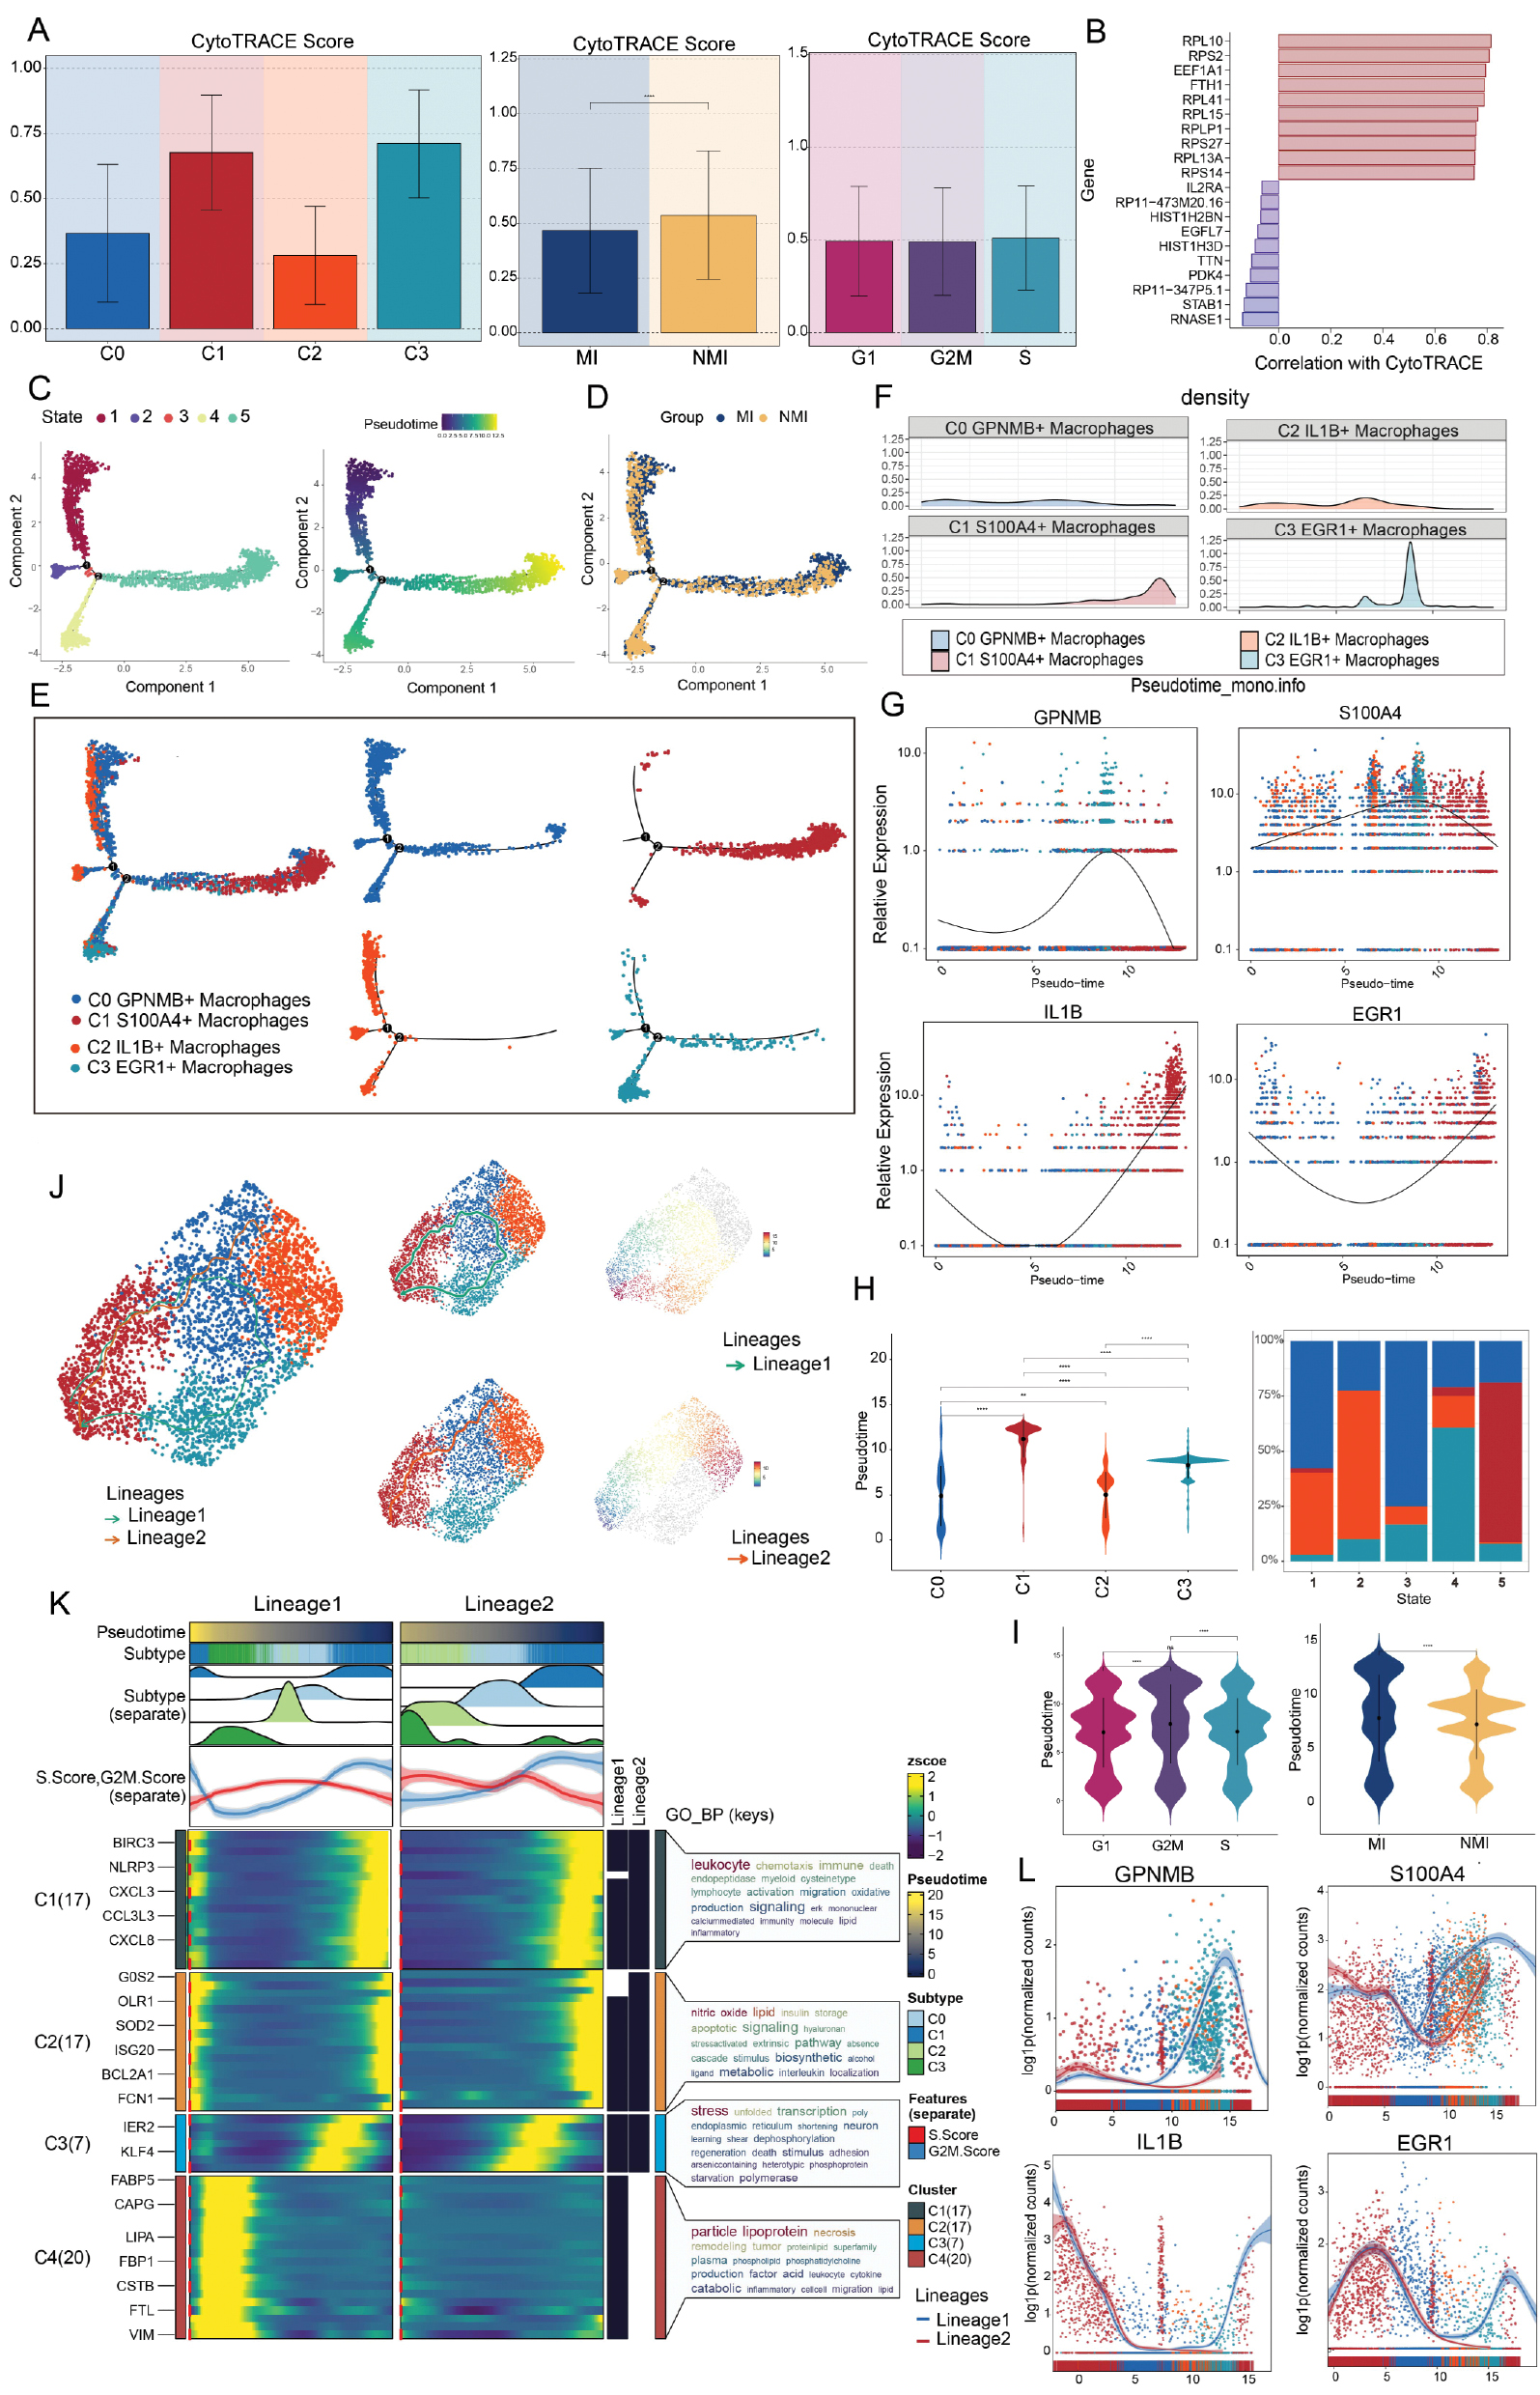
We next performed pseudotime analysis of the MI macrophage subtypes with Monocle2 [21], categorizing the cells into five distinct stages according to pseudotime scores (Figure 4C). Starting from the top left, differentiation proceeded downward and to the right. The distribution of MI and NMI samples along the pseudotime axis is shown in Figure 4D. Trajectory plots further revealed the distribution patterns of the four subtypes along the pseudotime axis: C2 cells localized predominantly to the early stages of pseudotime, whereas C1 cells were distributed primarily toward the late stages. C0 and C3 cells were more dispersed along the pseudotime trajectory (Figure 4E). To visually represent the distribution of the four subtypes in pseudotime, we used ridge plots, in which the C1 subtype was concentrated at the end of the pseudotime sequence, whereas C3 cells were distributed primarily in the mid-to-late stages (Figure 4F). To illustrate the expression patterns of key genes in each subtype during pseudotime progression, we used pseudotime scatter plots to depict the dynamic changes in subtype-specific signature genes (Figure 4G). Notably, S100A expression increased progressively during pseudotime and peaked in the mid-to-late stages, whereas IL1B and EGR1 initially decreased and subsequently increased.
We used violin plots to quantify the distribution of cell subtypes along the pseudotime trajectory. The C0 and C2 macrophage subtypes were located at the earlier point, whereas C1 and C2 were located at the later point (Figure 4H, left). To comprehensively depict the dynamic changes in cell subtypes in pseudotime, we performed a stacked bar chart visualization analysis. From the chart, we identified that stage 1 was composed predominantly of C0 and C2 subtypes; stage 2 was composed mainly of C2 subtypes; stage 3 was composed primarily of C0 subtypes; stage 4 largely comprised C3 subtypes; and stage 5 was composed predominantly of C1 subtypes (Figure 4H, right). We used violin plots to illustrate the differences in pseudotime scores between cells in different cell cycle stages and between MI and NMI (Figure 4I).
To investigate whether macrophages in MI might exhibit continuous branching lineage structures, we used Slingshot software to analyze the pseudotime trajectories of four cell subtypes. The results revealed two distinct lineages: lineage 1 and lineage 2. Lineage 1 began with the C1 subtype, transitioned through the C0, C2, and C3 subtypes, and returned to C1. Lineage 2 started with the C1 subtype, passed through the C0 subtype, and terminated with the C2 subtype (Figure 4J). Furthermore, GO-BP enrichment analysis revealed the biological functions associated with each lineage: In lineage 1, lipid metabolism, inflammatory response, and cell-related processes were notably enriched, whereas these biological pathways were expressed at relatively lower levels in lineage 2, corresponding primarily to the enrichment in the C3 cell cluster in lineage 1 (Figure 4K). To further explore the expression of subtype-specific signature genes along the pseudotime axis, we performed a scatter plot analysis. S100A4 exhibited higher expression at the terminal stage of lineage 1. These visualizations provided critical insights into the regulatory mechanisms of lineage-specific gene expression in MI for both lineage 1 and lineage 2 (Figure 4L).
Analysis of macrophage subtype-mediated intercellular communication networks and key signaling pathways in MI
To comprehensively investigate the complex cellular response mechanisms and analyze intercellular interactions, we performed a systematic analysis of intercellular relationships and ligand-receptor communication networks. First, we constructed an intercellular communication network encompassing various cell types [42], quantifying both the number (Figure 5A, left) and intensity (Figure 5B, left) of interactions among macrophage subtypes, fibroblasts, B cells, and other cell types. Furthermore, we used circular plots to display the number (Figure 5A, right) and intensity (Figure 5B, right) of receptor-ligand interactions among the four macrophage subtypes and other cell types. This analysis provided deeper insights into the extensive connections and communication pathways among cell types and systematically elucidated the mechanisms of cellular interactions in MI.
Figure 5 Cell-cell interaction analysis and analysis of interactions in the CXCL, MHC-II, and TNF signaling pathways. (A) Left: Circular plot displaying the number of receptor-ligand interactions. Right: Circular plots illustrating the numbers of interactions between the four macrophage subtypes and other cell types. Thicker lines indicate more interaction pathways. (B) Left: Circular diagram showing the strength of connections between cells. Right: Interaction intensity between the four macrophage subtypes and other cell types. Thicker lines represent stronger interactions. (C,D) Distribution patterns of cell entry and cell exit in all cell types. (E) Heatmaps providing a visual representation of the incoming and outgoing signal intensity of cell interactions across all cell types. (F) Heatmap clearly displaying the centrality scores of the CXCL signaling pathway network, showing notable differences among module groups. (G) Hierarchical chart clearly illustrating the interactions between macrophages and other cells in the CXCL signaling pathway. (H) Heatmap visually presenting the intercellular interaction network within the CXCL signaling pathway. (I) Violin plots showing the expression of related receptors and ligands in various cell types within the CXCL signaling pathway. (J) Heatmap displaying the centrality scores of the MHC-II signaling pathway network, clearly demonstrating substantial features across module groups. (K) Hierarchical plot illustrating the interaction between macrophages and other cells in the MHC-II signaling pathway. (L) Heatmap visually presenting the intercellular interaction network within the MHC-II signaling pathway. (M) Violin plots showing the expression of MHC-II-related receptors and ligands across cell types. (N) Heatmap displaying the centrality scores of the TNF signaling pathway network, clearly illustrating the substantial features of the module groups. (O) Hierarchical plot illustrating the interaction between macrophages and other cells in the TNF signaling pathway. (P) Heatmap visually presenting the intercellular interaction network within the TNF signaling pathway. (Q) Violin plots showing the expression levels of TNF-related receptors and ligands across cell types.
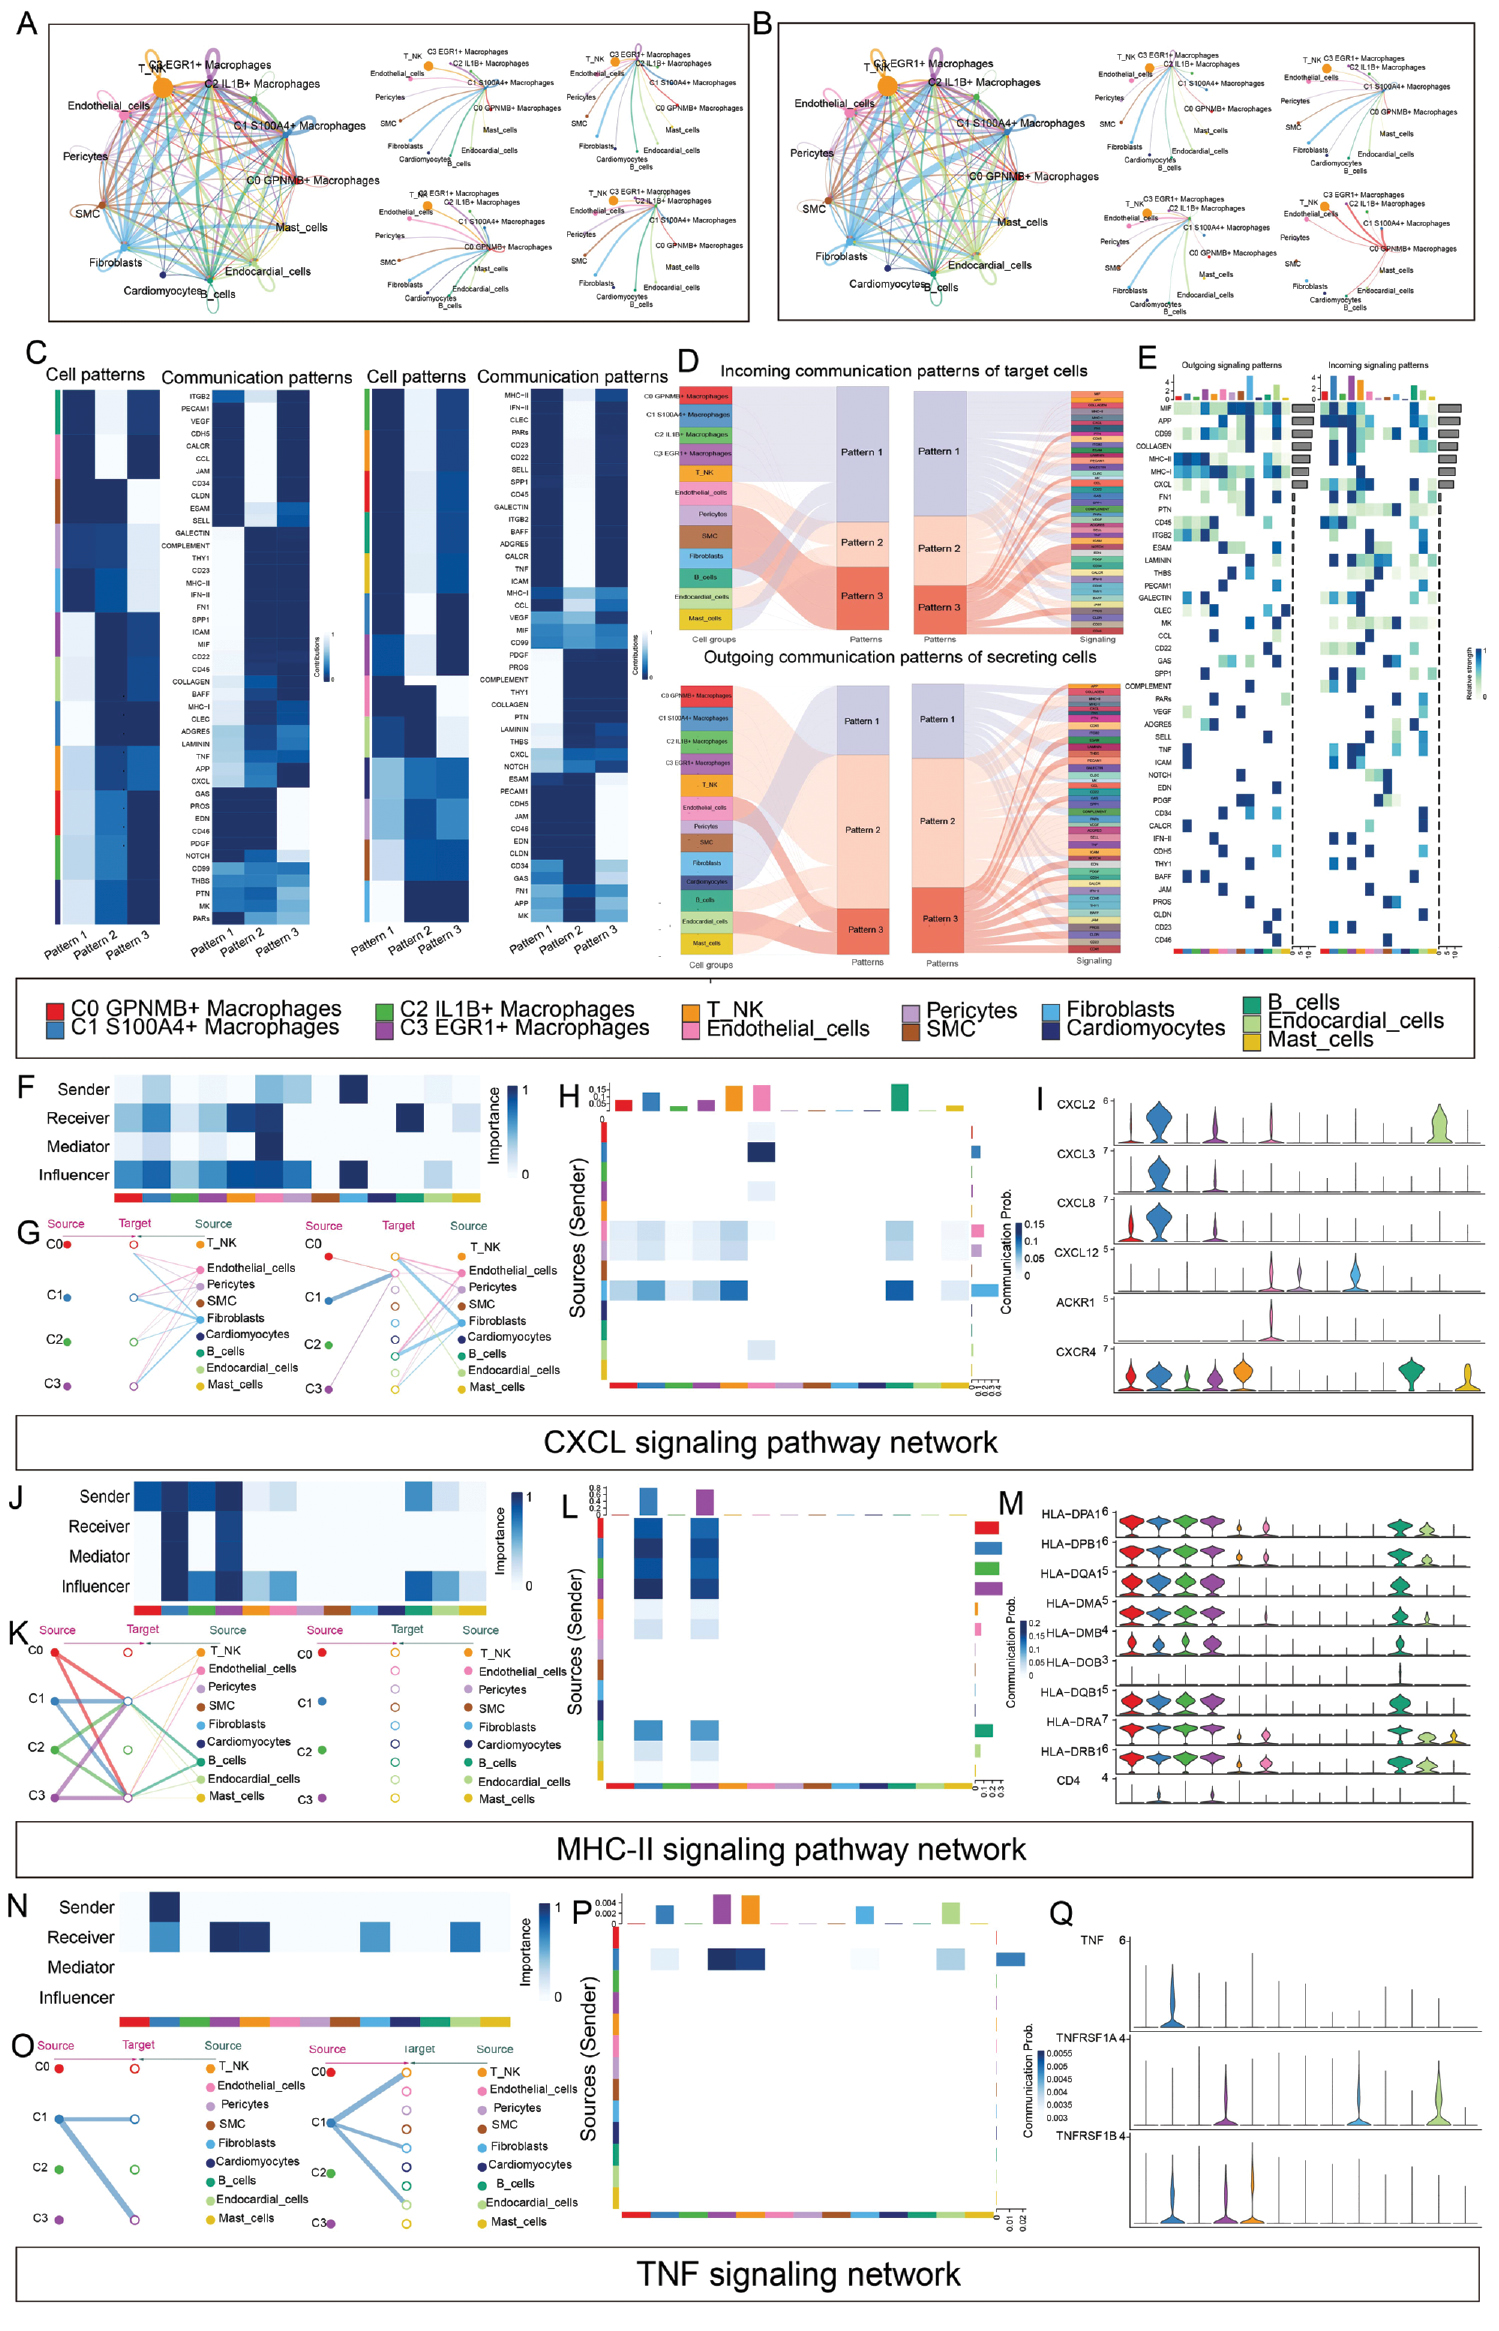
We identified three distinct input signaling patterns: pattern 1 (involving four macrophage subtypes, B cells, mast cells, and T/NK cells), associated with signaling pathways such as APP, MIF, CXCL, MHC-II, and TNF; pattern 2 (involving endothelial cells and endocardial cells) associated with CD34, ITGB2, and SELL signaling pathways; and pattern 3 (involving pericytes, fibroblasts, and smooth muscle cells) associated with EDN, PDGF, CD46, and others. Additionally, we identified three distinct output signaling pathways: pattern 1 (including pericytes, SMCs, fibroblasts, and cardiomyocytes) associated with CXCL, PTN, FN1, and others; pattern 2 (including macrophage subtypes, mast cells, B cells, and T/NK cells) associated with CCL, CD45, and TNF; and pattern 3 (including endocardial cells and endothelial cells) associated with APP, GAS, and CLDN, and others. Each pattern was associated with specific input and output signals (Figure 5C,D). These findings provided valuable insights into the mechanisms involved in disease development and progression. Notably, through heatmap analysis, we identified that CXCL, MHC-II [43], and TNF play critical roles in both incoming and outgoing signal transduction in the C1 subtype (Figure 5E). To investigate the functional mechanisms of the CLEC, MHC-II, and TNF [44] signaling pathways, we performed a visual analysis. Using a centrality measurement approach, we identified key participants in the CXCL signaling pathway: compared with the other macrophage subtypes, C1 exhibited the highest receiver and influencer scores in the CXCL signaling network. Endothelial cells were also notably involved in the receiver, mediator, and influencer roles (Figure 5F). In the CXCL pathway, the specific interactions among cell types are shown in Figure 5G,H. When the C1 subtype was the target cell, the interaction between C1 and fibroblasts was particularly substantial, whereas when C1 was the secreting cell, its communication with endothelial cells was more apparent. Finally, the expression levels of key receptor-ligand pairs involved in the CXCL signaling pathway were analyzed. Compared with the other macrophage subtypes, CXCL2, CXCL3, CXCL8, and CXCR4 had higher expression levels in the C1 subtype (Figure 5I).
To explore the role of MHC-II in cellular communication, we conducted a visual analysis of the pathway. Both C1 and C3 subtypes were found to play major roles across various scenarios within the MHC-II signaling pathway (Figure 5J). When C1 and C3 served as target cells, they were found to receive signaling molecules from various cell types, thus resulting in robust intercellular communication (Figure 5K). The heat map analysis shows that, compared to other cells, the communication probability of the C1 and C3 subtypes in the MHC-II pathway is the highest (Figure 5L). A violin plot visualizing the expression of ligand-receptor pairs associated with the MHC-II signaling pathway indicated that HLA-DPA1, HLA-DPB1, HLA-DQA1, HLA-DMA, and others were highly expressed across all macrophage subtypes and B cells (Figure 5M). We subsequently performed a similar analysis of the TNF signaling pathway [45]. Centrality measurement results indicated that the C1 cell subtype plays a major role as a sender within the TNF signaling pathway, whereas the C3 subtype and T/NK cells function primarily as receivers (Figure 5N). The TNF-associated secretory cells were mainly of the C1 subtype, thus underscoring the critical role of the C1 subtype in the TNF signaling pathway (Figure 5O–P), whereas the ligand-receptor pairs in the MHC-II signaling pathway also exhibited elevated expression in the C1 and C3 subtypes.
The elucidation of the functions of the CXCL, MHC-II, and TNF signaling pathways and their associations with various cell populations enhanced understanding of the molecular mechanisms underlying MI. Our findings provide crucial evidence for the development of specific therapeutic strategies targeting these signaling pathways. Nevertheless, these ligand-receptor interaction inferences are computational predictions that will require further experimental validation, such as through spatial transcriptomics or in situ hybridization, to confirm actual physical interactions in tissue.
Discussion
This study systematically mapped the cellular microenvironment of human MI tissue with scRNA-seq technology [46] and provided an in-depth analysis of myeloid cells, particularly the heterogeneity, metabolic characteristics, developmental trajectories, and intercellular communication networks of macrophage subtypes. Our findings not only confirmed the central role of the immune microenvironment in the pathological progression of MI but also revealed the diversity of cellular functions and their potential regulatory mechanisms, thus offering new insights into the molecular pathology of MI.
First, our study validated the critical roles of myeloid cells in MI [47]. Myeloid cells were enriched in the infarcted area and exhibited high proliferative activity. More importantly, enrichment analyses [48] indicated that myeloid cells in the infarct zone underwent notable metabolic reprogramming, particularly with the activation of pathways associated with oxidative phosphorylation and mitochondrial energy metabolism [49]. These findings are characteristic of macrophages undergoing extensive metabolic reprogramming during the proliferative phase post-infarction [50]. Therefore, in response to the high energy demands of the inflammatory environment, myeloid cells undergo fundamental metabolic alterations. This metabolic reprogramming might directly drive their potent inflammatory effector functions and potentially exacerbate tissue damage or influence the repair process. Compared with previous bulk RNA-seq studies reporting global metabolic changes in infarct tissue, our single-cell resolution data further revealed that this metabolic shift was not uniform across all myeloid cells but was particularly pronounced in specific subtypes localized to the infarct region, thereby advancing the field by linking metabolic reprogramming to discrete myeloid subtypes [51–53].
We conducted a detailed examination of myeloid cell heterogeneity. Macrophages, dendritic cells, and monocytes exhibit clear functional specialization and differential distribution across tissues (MI vs. NMI). We particularly focused on the critical role of macrophage heterogeneity in MI and identified four distinct subtypes (C0–C3) with functional diversity. These findings closely align with those from previous studies highlighting the high heterogeneity in cardiac macrophages, in which the traditional M1/M2 classification is overly simplistic and does not capture the complexity of their roles in injury repair [54]. However, our study offers advances beyond prior classifications by not only identifying four distinct subtypes but also mapping their unique metabolic profiles, transcriptional regulatory networks, and intercellular communication patterns—features that cannot be captured by the binary M1/M2 paradigm and that collectively enable a nuanced understanding of macrophage behavior in MI. Our scRNA-seq data indicated that C1 S100A4+ macrophages dominated the infarct zone and had high expression of genes such as IL1B and CCL3. IL1B, which is enriched in immune and inflammatory pathways and associated with immune cell infiltration, is likely to play a critical role in the pathogenesis of acute MI, particularly by mediating necroptosis and immune-inflammatory responses that exacerbate myocardial damage [55]. CCL3, an important chemokine, is responsible for recruiting additional immune cells to the site of inflammation. In the early stages of MI, this recruitment is essential for clearing necrotic debris; however, sustained excessive inflammation is detrimental [56]. Our findings suggest that CCL3 might play a role similar to that described in classic studies as an early pro-inflammatory mediator. The marker gene S100A4+ has been reported to activate cardiac fibroblasts through paracrine signaling, thus amplifying TGF-β-driven pro-fibrotic signaling in experimental models. In our study, ligand-receptor interaction analysis predicted that C1 macrophages might communicate with fibroblasts via S100A4-associated signaling pathways, and consequently suggested a potential role in driving pathological cardiac remodeling. However, this inference was based on computational prediction and requires further experimental validation (e.g., in co-culture systems or conditional knockout models) to confirm causality [57]. The C3 subtype also exhibited elevated nFeature and nCount scores, and the named gene EGR1 was among the critical molecules driving harmful excessive inflammation after MI. Inhibiting EGR1 activity is considered a promising therapeutic strategy [58]. In C0 GPNMB+ macrophages, GPNMB activates protective signaling pathways in cardiomyocytes and fibroblasts, thereby exerting beneficial anti-cell death and anti-fibrosis effects, and improving cardiac function [59]. Notably, some studies have emphasized that macrophages of different origins (e.g., embryonic vs. monocyte derived) exhibit distinct functions in cardiac fibrosis [60]. Future studies incorporating lineage tracing markers (such as Timd4 and CCR2) could precisely define the developmental origins of the C0–C3 subtypes, thereby providing a more accurate understanding of their functions [61].
Given that metabolic reprogramming is fundamental to macrophage functional differentiation, we subsequently conducted a metabolic analysis, which revealed that myeloid cells in the infarcted area exhibited notable activation of energy metabolism pathways such as oxidative phosphorylation. This finding aligned with the immune metabolism concept proposed by Zuo et al. [61], in which macrophages tend to rely on glycolysis during early stages of inflammation and transition to oxidative phosphorylation during the repair phase. The high metabolic activity observed in the C1 subtype might provide the energy necessary for its potent pro-inflammatory effector functions. Additionally, Zhou et al. [62] have proposed that myocardial syncytium calcium signaling might regulate macrophage gene expression. Our findings suggested that this regulation might be mediated by the effects of cellular metabolic states. The TF analysis identified high expression of FOSB, ATF3, RELB, FOSL2, and ATF4 in infarct regions. Notably, ATF3 promotes autophagy, which in turn stimulates the proliferation of cardiac fibroblasts and collagen production, and ultimately influences myocardial fibrosis and remodeling after MI [63]. ATF4, a key signaling node and TF linking receptor activation to excessive autophagy in cardiomyocytes, ultimately mediates the transcriptional program that promotes autophagy, a crucial step in myocardial injury [64]. Both ATF3 and ATF4 are important molecules in the immune-inflammatory process [65]. RELB is a critical signaling node linking macrophage depletion to adverse cardiac remodeling, and driving macrophages toward the pro-inflammatory M1 phenotype, thereby exacerbating the inflammatory response and contributing to adverse ventricular remodeling and heart dysfunction after MI [66].
In the analysis of different macrophage subtypes, the C0 subtype exhibited high levels of STAT1 [67], a key factor promoting harmful inflammatory responses after MI. In contrast, REL was relatively abundant in the C1 subtype, in which it is recognized as a key pro-inflammatory TF after MI [68]. The most highly expressed TF in the C2 subtype was CREB3, whereas ZBTB25 was notably elevated in the C3 subtype. A more detailed analysis of the macrophage subtypes will be an important future direction for uncovering functional regulatory mechanisms.
To provide new insights into the dynamic changes in macrophage subtypes, we performed pseudotime analysis. A Monocle2 simulation of the potential differentiation trajectory of macrophage subtypes (C2 → C0 → C3 → C1) positioned C1 at the terminal differentiation end. C1 might therefore be a terminally differentiated subtype with specific effector functions in response to infarct microenvironmental stimuli [45]. Slingshot analysis [69] further further demonstrates that C1 was at the terminal stage of the differentiation process. However, macrophages are known for their high plasticity [70], and previous studies have highlighted their notable heterogeneity [54] and plasticity in development, phenotype, and function [61]. Moreover, their fate is not unidirectional. Zhang et al. [71] have demonstrated that external signals, such as myocardial exosomes, can alter macrophage polarization states. Therefore, our pseudotime analysis suggested a differentiation trajectory (C2 → C0 → C3 → C1) with C1 at the terminal end; however, we interpret the observed trajectory as a dynamic equilibrium state rather than a fixed unidirectional differentiation program, consistent with the view that cell fate is highly plastic and can be dynamically reshaped by microenvironmental signals [72].
Furthermore, cell-cell communication analysis revealed that macrophage subtypes act as key information hubs within the MI microenvironment [73]. We identified C1 S100A4+ macrophages as central nodes in several critical signaling pathways, including CXCL, MHC-II, and TNF. Notably, the C1 subtype might form autocrine/paracrine feedback loops. For example, activation of the TNF pathway can initiate and amplify inflammatory responses, recruit and activate immune cells, sustain the recruitment of inflammatory effector cells, and promote inflammatory cell death, particularly necrosis, which further releases additional inflammatory signals [74]. This feedback mechanism is likely to substantially amplify the local inflammatory response. Our cell communication network provided a more complex cellular subtype context for these interactions, thus suggesting that C1 macrophages might act as crucial amplifiers, by receiving myocardial cell damage signals and further amplifying the inflammatory response. Yang et al. [75] have also detailed the intricate interaction networks between macrophages and fibroblasts through factors such as CSF1, TGF-β, and IL-10, which together drive the fibrotic process.
Finally, our findings suggest potential targets for therapeutic strategies aimed at modulating the immune microenvironment. The key macrophage subtypes identified herein, such as C1, and their active signaling pathways, including CXCL and TNF, offer candidate targets for the development of precision immunotherapies. Targeting specific surface markers on the C1 subtype or the key inflammatory mediators that they produce might help control excessive inflammatory responses after MI without affecting other macrophage subtypes involved in tissue repair.
However, this study has several limitations. First, the samples were obtained from a single time point after MI, thereby limiting our ability to dynamically capture the evolution of the microenvironment across stages of repair (inflammatory, proliferative, and maturation phases) [76]. Second, because the study was based primarily on transcriptomic data, functional conclusions must be further validated through subsequent in vivo and in vitro experiments, such as gene knockout [77] and cell-specific ablation [78]. Additionally, the relatively small sample size necessitates future studies with larger cohorts to identify rarer cell subtypes or states.
In conclusion, this study comprehensively elucidated the complexity and dynamics of the immune microenvironment in MI from multiple perspectives, including ecosystem interactions, cell subtypes, developmental trajectories, and signaling networks. The key macrophage subtypes and their core signaling pathways identified herein offer a critical theoretical foundation for the future development of precision therapies aimed at modulating the cardiac immune microenvironment, suppressing excessive inflammation, and promoting reparative remodeling. Future research should integrate spatial-temporal transcriptomics, proteomics, and metabolomics, and additionally validate these findings in more clinically relevant models, such as immune cell-containing cardiac organoids, with the ultimate goal of translating molecular insights into clinical therapies.
Conclusion
This study revealed the core characteristics of the immune microenvironment in MI through single-cell sequencing and identified C1 S100A4+ macrophages as a key disease-associated inflammatory subtype. This subtype was notably enriched in infarcted areas, and it exhibited an active proliferative state; distinct metabolic reprogramming characterized by enhanced oxidative phosphorylation; and pronounced pro-inflammatory features with high expression of IL1B and CCL3. Moreover, C1 S100A4+ macrophages were found to serve as a central hub in CXCL, MHC-II, and TNF signaling pathways. These findings provide new insights into the pathological mechanisms of MI, particularly by advancing understanding of the inflammatory processes involved in ventricular remodeling after MI.
Data availability statement
The single-cell and bulk sequencing datasets created and/or examined during the current investigation are accessible to the general public in the GEO database (GSE145154). The article contains original contributions made during the investigation. The respective authors may be contacted with any questions regarding the original contributions included in the study.
Author contributions
The research was conceptualized and designed by Zhenzhen Zhao, Xuheng Dou, Hongling Jia, and Fu Zhao. Zhenzhen Zhao, Xuheng Dou, WenYang Nie, and Fu Zhao downloaded and gathered the data. The article was written by Zhenzhen Zhao, Yumeng Li, and Xuheng Dou after examination of the data. The article underwent quality control by Jing Li, Yuchao Hou, and Wenguang Hou. The submission was guided by Jing Li. The final manuscript was read and approved by all authors. Zhenzhen Zhao, Xuheng Dou, and Fu Zhao are co-first authors. Jing Li is the corresponding author.
Ethics statement
Ethical approval was not required, because the data used in this investigation are publicly available. After reading the work, each author has consented to publication.
Funding
This work was supported by the Shanghai Municipal Science and Technology Commission (Grant No. 23Y11922000), which funded the clinical evaluation of electroacupuncture for the prevention and treatment of perioperative neurocognitive disorders and the investigation of inflammatory factor biomarkers. Additional support was provided by the Three-Year Action Plan (2025–2027) of Shanghai Municipality for Further Accelerating the Inheritance, Innovation, and Development of Traditional Chinese Medicine (Project No. 1-1-2) and by the Special Project for the Inheritance and Construction of Acupuncture Schools (Grant No. HKGYQYXM-2026-54).
Acknowledgements
The graphical abstract was created with Figdraw (Image ID: OATIO42e07). We express special gratitude to Professor Zhijie Zhao of the Department of Plastic and Reconstructive Surgery, Shanghai Ninth People’s Hospital, Shanghai Jiao Tong University School of Medicine, Shanghai, China, for his valuable and constructive guidance on the omics analysis.
Conflict of interest
This study was performed without any financial or commercial ties that might be interpreted as a conflict of interest, according to the authors.
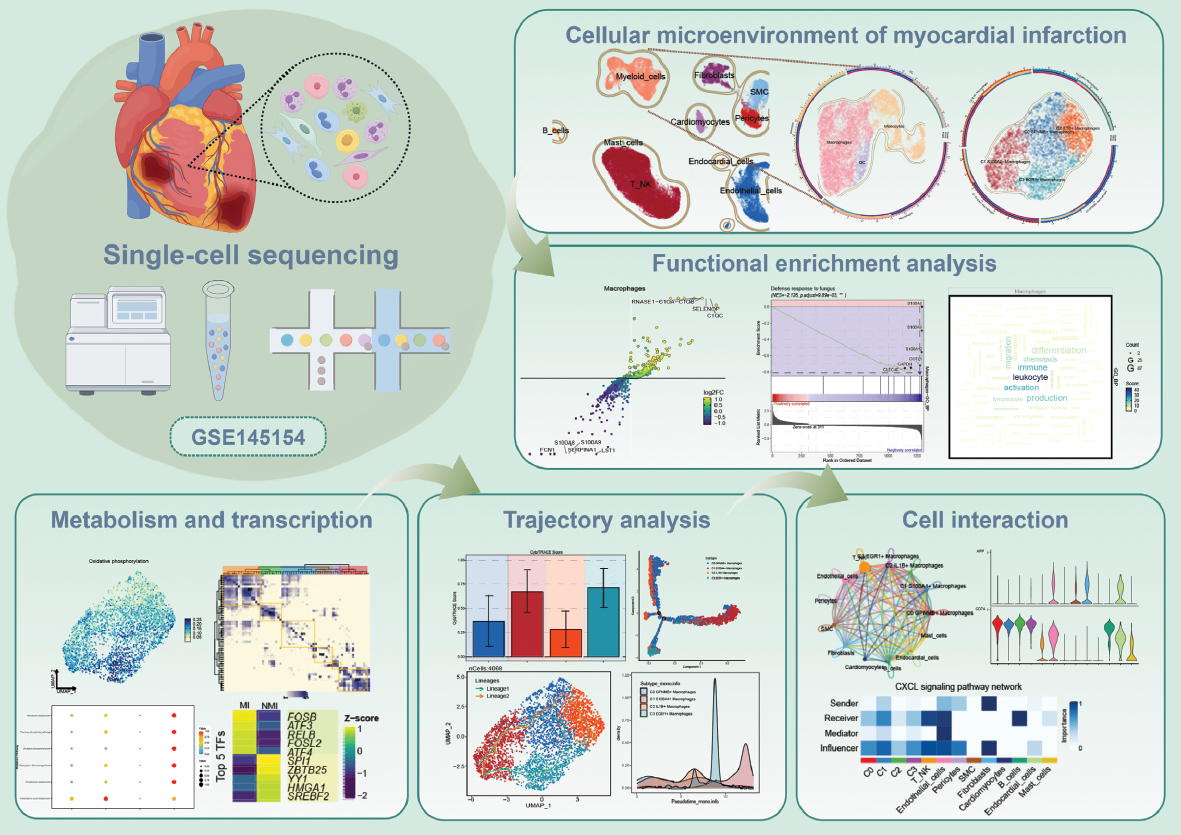
Graphical abstract
Highlights
- A 44,574-cell MI atlas revealed myeloid cell enrichment with enhanced proliferation and metabolic reprogramming.
- Myeloid cells activate glycolysis, oxidative phosphorylation, mitochondrial ATP synthesis, and inflammatory pathways in infarcted tissue.
- Four macrophage subtypes were identified: C0 GPNMB+, C1 S100A4+, C2 IL1B+, and C3 EGR1+.
- C1 macrophages form a central hub communicating with endothelial, fibroblast, and immune cells via CXCL, MHC-II, and TNF pathways.
In brief
A comprehensive single-cell immune atlas of MI systematically dissected macrophage heterogeneity, developmental trajectories, and intercellular crosstalk. Four macrophage subtypes were delineated, among which C1 S100A4+ macrophages emerged as a dominant, highly proliferative inflammatory population and a central signaling hub. Trajectory mapping revealed their terminal differentiation position, and identified C1 S100A4+ macrophages as key orchestrators of post-MI immune remodeling and promising targets for precision immunomodulation.
References
- Poller WC, Nahrendorf M, Swirski FK. Hematopoiesis and cardiovascular disease. Circ Res 2020;126(8):1061-85. [PMID: 32271679 DOI: 10.1161/CIRCRESAHA.120.315895]
- Reed GW, Rossi JE, Cannon CP. Acute myocardial infarction. Lancet 2017;389(10065):197-210. [PMID: 27502078 DOI: 10.1016/S0140-6736(16)30677-8]
- Chen W, Zhang Y, Dai Y, Kong S, Liu H, et al. Serum extracellular vesicle-derived microRNA profiles in patients with ST-segment elevation myocardial infarction undergoing percutaneous coronary intervention. Cardiovas Innov Appl 2025;10(1). [DOI: 10.15212/CVIA.2024.0059]
- Zhang X, Yao Y, Ding Y, Yan W, Gu Y, et al. Comprehensive bioinformatics method to explore immune-related genes in the pathogenesis of myocardial infarction. Cardiovas Innov Appl 2025;10(1). [DOI: 10.15212/CVIA.2024.0067]
- Gong W, Yan Y, Wang X, Zheng W, Smith SC Jr, et al. Risk factors for in-hospital cardiac arrest in patients with ST-segment elevation myocardial infarction. J Am Coll Cardiol 2022;80(19):1788-98. [PMID: 36328690 DOI: 10.1016/j.jacc.2022.08.797]
- Heusch G, Gersh BJ. The pathophysiology of acute myocardial infarction and strategies of protection beyond reperfusion: a continual challenge. Eur Heart J 2017;38(11):774-84. [PMID: 27354052 DOI: 10.1093/eurheartj/ehw224]
- Cao W, Wang K, Wang J, Chen Y, Gong H, et al. Causal relationship between immune cells and risk of myocardial infarction: evidence from a Mendelian randomization study. Front Cardiovasc Med 2024;11:1416112. [PMID: 39257847 DOI: 10.3389/fcvm.2024.1416112]
- Li M, Sun X, Zeng L, Sun A, Ge J. Metabolic homeostasis of immune cells modulates cardiovascular diseases. Research (Wash D C) 2025;8:0679. [PMID: 40270694 DOI: 10.34133/research.0679]
- Li Z, Solomonidis EG, Meloni M, Taylor RS, Duffin R, et al. Single-cell transcriptome analyses reveal novel targets modulating cardiac neovascularization by resident endothelial cells following myocardial infarction. Eur Heart J 2019;40(30):2507-20. [PMID: 31162546 DOI: 10.1093/eurheartj/ehz305]
- Davies P, Jones M, Liu J, Hebenstreit D. Anti-bias training for (sc)RNA-seq: experimental and computational approaches to improve precision. Brief Bioinform 2021;22(6):bbab148. [PMID: 33959753 DOI: 10.1093/bib/bbab148]
- Fu M, Hua X, Shu S, Xu X, Zhang H, et al. Single-cell RNA sequencing in donor and end-stage heart failure patients identifies NLRP3 as a therapeutic target for arrhythmogenic right ventricular cardiomyopathy. BMC Med 2024;22(1):11. [PMID: 38185631 DOI: 10.1186/s12916-023-03232-8]
- Jin K, Gao S, Yang P, Guo R, Li D, et al. Single-cell RNA sequencing reveals the temporal diversity and dynamics of cardiac immunity after myocardial infarction. Small Methods 2022;6(3):e2100752. [PMID: 35023642 DOI: 10.1002/smtd.202100752]
- Wei Z, Cui C, Li Z, Li J, Shao Y, et al. Major cell types in the coronary thrombosis of acute myocardial infarction patients revealed by scRNA-seq. Clin Transl Med 2025;15(1):e70181. [PMID: 39804415 DOI: 10.1002/ctm2.70181]
- Hoyer FF, Nahrendorf M. Interferon-γ regulates cardiac myeloid cells in myocardial infarction. Cardiovasc Res 2019;115(13):1815-6. [PMID: 31161218 DOI: 10.1093/cvr/cvz143]
- Schloss MJ, Horckmans M, Guillamat-Prats R, Hering D, Lauer E, et al. 2-Arachidonoylglycerol mobilizes myeloid cells and worsens heart function after acute myocardial infarction. Cardiovasc Res 2019;115(3):602-13. [PMID: 30295758 DOI: 10.1093/cvr/cvy242]
- Moggio A, Schunkert H, Kessler T, Sager HB. Quo Vadis? Immunodynamics of myeloid cells after myocardial infarction. Int J Mol Sci 2022;23(24):15814. [PMID: 36555456 DOI: 10.3390/ijms232415814]
- Zhang T, Hao R, Li C, Yang K, Zhou L. Itaconate modulates myeloid inflammation in myocardial infarction via metabolic and structural reprogramming. Genes Genomics 2026;48(1):83-105. [PMID: 41166022 DOI: 10.1007/s13258-025-01698-9]
- Kubota A, Frangogiannis NG. Macrophages in myocardial infarction. Am J Physiol Cell Physiol 2022;323(4):C1304-C1324. [PMID: 36094436 DOI: 10.1152/ajpcell.00230.2022]
- Kanuri B, Sreejit G, Biswas P, Murphy AJ, Nagareddy PR. Macrophage heterogeneity in myocardial infarction: evolution and implications for diverse therapeutic approaches. iScience 2024;27(7):110274. [PMID: 39040061 DOI: 10.1016/j.isci.2024.110274]
- Li H, Long C, Hong Y, Luo L, Zuo Y. Characterizing cellular differentiation potency and waddington landscape via energy indicator. Research (Wash D C) 2023;6:0118. [PMID: 37223479 DOI: 10.34133/research.0118]
- Zhao Z, Ding Y, Tran LJ, Chai G, Lin L. Innovative breakthroughs facilitated by single-cell multi-omics: manipulating natural killer cell functionality correlates with a novel subcategory of melanoma cells. Front Immunol 2023;14:1196892. [PMID: 37435067 DOI: 10.3389/fimmu.2023.1196892]
- Zhao H, Yu L, Wang L, Yin X, Liu K, et al. Integrated analysis of single-cell and bulk RNA sequencing data reveals immune-related lncRNA-mRNA prognostic signature in triple-negative breast cancer. Genes Dis 2023;11(2):571-4. [PMID: 37692501 DOI: 10.1016/j.gendis.2023.04.006]
- Huang W, Kim BS, Zhang Y, Lin L, Chai G, et al. Regulatory T cells subtypes in the tumor microenvironment cannot be overlooked: their involvement in prognosis and treatment strategy in melanoma. Environ Toxicol 2024;39(10):4512-30. [PMID: 38530049 DOI: 10.1002/tox.24247]
- Du H, Li S, Lu J, Tang L, Jiang X, et al. Single-cell RNA-seq and bulk-seq identify RAB17 as a potential regulator of angiogenesis by human dermal microvascular endothelial cells in diabetic foot ulcers. Burns Trauma 2023;11:tkad020. [PMID: 37605780 DOI: 10.1093/burnst/tkad020]
- Liu Y, Niu H, Ren J, Wang Z, Yan L, et al. Single-cell RNA sequencing reveals abnormal transcriptome signature of erythroid progenitors in pure red cell aplasia. Genes Dis 2023;11(1):49-52. [PMID: 37588205 DOI: 10.1016/j.gendis.2023.03.002]
- Wang J, Xu J, Zang G, Zhang T, Wu Q, et al. trans-2-Enoyl-CoA reductase Tecr-driven lipid metabolism in endothelial cells protects against transcytosis to maintain blood-brain barrier homeostasis. Research (Wash D C) 2022;2022:9839368. [PMID: 35465346 DOI: 10.34133/2022/9839368]
- Jin X, Jian Z, Ma Y, Wen J, Chao N, et al. Single-cell RNA sequencing analysis reveals the role of macrophage-mediated CD44–AKT–CCL2 pathways in renal tubule injury during calcium oxalate crystal formation. Research (Wash D C) 2025;8:0690. [PMID: 40330661 DOI: 10.34133/research.0690]
- Xie Z, Zheng G, Niu L, Du K, Li R, et al. SPP1+ macrophages in colorectal cancer: markers of malignancy and promising therapeutic targets. Genes Dis 2024;12(3):101340. [PMID: 40092488 DOI: 10.1016/j.gendis.2024.101340]
- Hu D, Wang Y, Shen X, Mao T, Liang X, et al. Genetic landscape and clinical significance of cuproptosis-related genes in liver hepatocellular carcinoma. Genes Dis 2023;11(2):516-9. [PMID: 37692498 DOI: 10.1016/j.gendis.2023.03.010]
- Lv J, Wang L, Jia W, Xu H, Weng S, et al. Resident to exhausted CD4+ T cell ratio is associated with the prognosis of gastric cancer. Genes Dis 2023;11(4):101076. [PMID: 38515936 DOI: 10.1016/j.gendis.2023.101076]
- Li X, Wang H, Wu Y, Zou L, Deng S, et al. A novel mouse model of PEDF-associated serious liver inflammation, hepatic tumorigenesis and cardiovascular injury mimics human nonalcoholic steatohepatitis. Genes Dis 2023;11(1):11-4. [PMID: 37588234 DOI: 10.1016/j.gendis.2023.01.011]
- Fei Y, Zhang S, Han S, Qiu B, Lu Y, et al. The role of dihydroresveratrol in enhancing the synergistic effect of Ligilactobacillus salivarius Li01 and resveratrol in ameliorating colitis in mice. Research (Wash D C) 2022;2022:9863845. [PMID: 35935130 DOI: 10.34133/2022/9863845]
- Zhang B, Zeng K, Guan RC, Jiang HQ, Qiang YJ, et al. Single-cell RNA-seq analysis reveals macrophages are involved in the pathogenesis of human sporadic acute type A aortic dissection. Biomolecules 2023;13(2):399. [PMID: 36830768 DOI: 10.3390/biom13020399]
- Xie R, Li T, Gao H, Xie C, Yuan H, et al. Single-cell transcriptional profiling reveals cellular senescence and inflammatory persistence as key features of type 1 diabetes partial remission. Diabetes Obes Metab 2025;27(7):3653-75. [PMID: 40183401 DOI: 10.1111/dom.16384]
- Wu D, Chen S, Liu Y, Yang B, Li R, et al. Single-cell analyses revealed key tumor-infiltrating myeloid cell subsets associated with clinical outcomes in different subtypes of breast cancer. Genes Dis 2023;11(6):101185. [PMID: 39104420 DOI: 10.1016/j.gendis.2023.101185]
- Zhang P, Zhang P, Gao J, Li X, Wei C, et al. Integrated bulk and single-cell transcriptome data identify clinically relevant cell populations in clear cell renal cell carcinoma. Genes Dis 2024;11(1):42-5. [DOI: 10.1016/j.gendis.2023.03.007]
- Wu J, Hu N, Guo B, Ma H, Xie L, et al. Single-cell transcriptomics systematically discloses the immune-inflammatory responses of peripheral blood mononuclear cells for diabetic nephropathy. Genes Dis 2023;11(4):101033. [PMID: 38510479 DOI: 10.1016/j.gendis.2023.06.007]
- Zhao Z, Li T, Dong X, Wang X, Zhang Z, et al. Untargeted metabolomic profiling of cuprizone-induced demyelination in mouse corpus callosum by UPLC-orbitrap/MS reveals potential metabolic biomarkers of CNS demyelination disorders. Oxid Med Cell Longev 2021;2021:7093844. [PMID: 34567412 DOI: 10.1155/2021/7093844]
- Li X, Li X, Yang J, Du Y, Chen L, et al. In situ sustained macrophage-targeted nanomicelle-hydrogel microspheres for inhibiting osteoarthritis. Research (Wash D C) 2023;6:0131. [PMID: 37223475 DOI: 10.34133/research.0131]
- Zhao ZJ, Zheng RZ, Wang XJ, Li TQ, Dong XH, et al. Integrating lipidomics and transcriptomics reveals the crosstalk between oxidative stress and neuroinflammation in central nervous system demyelination. Front Aging Neurosci 2022;14:870957. [PMID: 35547618 DOI: 10.3389/fnagi.2022.870957]
- Zhao F, Jiang X, Li Y, Huang T, Xiahou Z, et al. Characterizing tumor biology and immune microenvironment in high-grade serous ovarian cancer via single-cell RNA sequencing: insights for targeted and personalized immunotherapy strategies. Front Immunol 2025;15:1500153. [PMID: 39896800 DOI: 10.3389/fimmu.2024.1500153]
- Lin Z, Zhou Y, Liu Z, Nie W, Cao H, et al. Deciphering the tumor immune microenvironment: single-cell and spatial transcriptomic insights into cervical cancer fibroblasts. J Exp Clin Cancer Res 2025;44(1):194. [PMID: 40616092 DOI: 10.1186/s13046-025-03432-5]
- Zhao Z, Jia H, Sun Z, Li Y, Liu L. A new perspective on macrophage-targeted drug research: the potential of KDELR2 in bladder cancer immunotherapy. Front Immunol 2024;15:1485109. [PMID: 39691708 DOI: 10.3389/fimmu.2024.1485109]
- Zhao Z, Cai H, Nie W, Wang X, Zhao Z, et al. Ectopic expression of GDF15 in cancer-associated fibroblasts enhances melanoma immunosuppression via the GFRAL/RET cascade. J Immunother Cancer 2025;13(6):e011036. [PMID: 40555562 DOI: 10.1136/jitc-2024-011036]
- Zhao Z, Cai H, Zhao Z, Wang X, Nie W, et al. Cancer-associated fibroblast-derived GDF15 induces oxidative stress and neutrophil infiltration in head and neck squamous cell carcinoma through the PI3K/AKT/STAT3 axis cascade. Research (Wash D C) 2025;8:0901. [PMID: 41035818 DOI: 10.34133/research.0901]
- Nie W, Zhao Z, Liu Y, Wang Y, Zhang J, et al. Integrative single-cell analysis of cardiomyopathy identifies differences in cell stemness and transcriptional regulatory networks among fibroblast subpopulations. Cardiol Res Pract 2024;2024:3131633. [PMID: 38799173 DOI: 10.1155/2024/3131633]
- Wang H, Rouhi N, Slotabec LA, Seale BC, Wen C, et al. Myeloid cells in myocardial ischemic injury: the role of the macrophage migration inhibitory factor. Life (Basel) 2024;14(8):981. [PMID: 39202723 DOI: 10.3390/life14080981]
- Li H, Bian Y, Xiahou Z, Zhao Z, Zhao F, et al. The cellular signaling crosstalk between memory B cells and tumor cells in nasopharyngeal carcinoma cannot be overlooked: their involvement in tumor progression and treatment strategy is significant. J Cancer 2025;16(1):288-314. [PMID: 39744570 DOI: 10.7150/jca.101420]
- Chen L, Yang J, Cai Z, Huang Y, Xiao P, et al. Mitochondrial-oriented injectable hydrogel microspheres maintain homeostasis of chondrocyte metabolism to promote subcellular therapy in osteoarthritis. Research (Wash D C) 2024;7:0306. [PMID: 38274127 DOI: 10.34133/research.0306]
- Mouton AJ, DeLeon-Pennell KY, Rivera Gonzalez OJ, Flynn ER, Freeman TC, et al. Mapping macrophage polarization over the myocardial infarction time continuum. Basic Res Cardiol 2018;113(4):26. [PMID: 29868933 DOI: 10.1007/s00395-018-0686-x]
- Seropian IM, Toldo S, Van Tassell BW, Abbate A. Anti-inflammatory strategies for ventricular remodeling following ST-segment elevation acute myocardial infarction. J Am Coll Cardiol 2014;63(16):1593-603. [PMID: 24530674 DOI: 10.1016/j.jacc.2014.01.014]
- Zhang G, Wang Z, Tong Z, Qin Z, Su C, et al. AI hybrid survival assessment for advanced heart failure patients with renal dysfunction. Nat Commun 2024;15(1):6756. [PMID: 39117613 DOI: 10.1038/s41467-024-50415-9]
- Zhang G, Cui X, Qin Z, Wang Z, Lu Y, et al. Atherosclerotic plaque vulnerability quantification system for clinical and biological interpretability. iScience 2023;26(9):107587. [PMID: 37664595 DOI: 10.1016/j.isci.2023.107587]
- Peet C, Ivetic A, Bromage DI, Shah AM. Cardiac monocytes and macrophages after myocardial infarction. Cardiovasc Res 2020;116(6):1101-12. [PMID: 31841135 DOI: 10.1093/cvr/cvz336]
- Zha Y, Zhu T, Li T. Identification and characterization of necroptosis-related differentially expressed genes in acute myocardial infarction: insights into immune-related pathways and protein-protein interactions. Cell Mol Biol (Noisy-le-grand) 2023;69(5):192-6. [PMID: 37571880 DOI: 10.14715/cmb/2023.69.5.30]
- Li T, Yan Z, Fan Y, Fan X, Li A, et al. Cardiac repair after myocardial infarction: a two-sided role of inflammation-mediated. Front Cardiovasc Med 2023;9:1077290. [PMID: 36698953 DOI: 10.3389/fcvm.2022.1077290]
- Tomcik M, Palumbo-Zerr K, Zerr P, Avouac J, Dees C, et al. S100A4 amplifies TGF-β-induced fibroblast activation in systemic sclerosis. Ann Rheum Dis 2015;74(9):1748-55. [PMID: 24709861 DOI: 10.1136/annrheumdis-2013-204516]
- Williamson MR, Deneen B. Astrocytes remember inflammation. Immunity 2024;57(5):938-40. [PMID: 38749396 DOI: 10.1016/j.immuni.2024.04.005]
- Hill JJ. Macrophage GPNMB-mediated cardiac repair. Nat Cardiovasc Res 2024;3(11):1270-1. [PMID: 39455835 DOI: 10.1038/s44161-024-00559-0]
- Wang M, Pan W, Xu Y, Zhang J, Wan J, et al. Microglia-mediated neuroinflammation: a potential target for the treatment of cardiovascular diseases. J Inflamm Res 2022;15:3083-94. [PMID: 35642214 DOI: 10.2147/JIR.S350109]
- Zuo W, Sun R, Ji Z, Ma G. Macrophage-driven cardiac inflammation and healing: insights from homeostasis and myocardial infarction. Cell Mol Biol Lett 2023;28(1):81. [PMID: 37858035 DOI: 10.1186/s11658-023-00491-4]
- Zhou X, Li Z, Wang Z, Chen E, Wang J, et al. Syncytium calcium signaling and macrophage function in the heart. Cell Biosci 2018;8:24. [PMID: 29599964 DOI: 10.1186/s13578-018-0222-6]
- Huang Y, Dai H. ATF3 affects myocardial fibrosis remodeling after myocardial infarction by regulating autophagy and its mechanism of action. Gene 2023;885:147705. [PMID: 37572799 DOI: 10.1016/j.gene.2023.147705]
- Zhang S, Bi Y, Xiang K, Tang Y. P2X7 receptor facilitates cardiomyocyte autophagy after myocardial infarction via Nox4/PERK/ATF4 signaling pathway. Cell Biochem Funct 2025;43(5):e70078. [PMID: 40289672 DOI: 10.1002/cbf.70078]
- Zhang T, Zhao LL, Cao X, Qi LC, Wei GQ, et al. Bioinformatics analysis of time series gene expression in left ventricle (LV) with acute myocardial infarction (AMI). Gene 2014;543(2):259-67. [PMID: 24704022 DOI: 10.1016/j.gene.2014.04.002]
- Cao Y, He S, Tao Z, Chen W, Xu Y, et al. Macrophage-specific IκB kinase α contributes to ventricular remodelling and dysfunction after myocardial infarction. Can J Cardiol 2019;35(4):490-500. [PMID: 30935640 DOI: 10.1016/j.cjca.2019.01.002]
- Ma Z, Li M, Guo R, Tian Y, Zheng Y, et al. Treating myocardial infarction via a nano-ultrasonic contrast agent-mediated high-efficiency drug delivery system targeting macrophages. Sci Adv 2025;11(1):eadp7126. [PMID: 39752485 DOI: 10.1126/sciadv.adp7126]
- de Winter N, Ji J, Sintou A, Forte E, Lee M, et al. Persistent transcriptional changes in cardiac adaptive immune cells following MI: new evidence from the re-analysis of publicly available single cell and nuclei RNA-sequencing data sets. J Mol Cell Cardiol 2024;192:48-64. [PMID: 38734060 DOI: 10.1016/j.yjmcc.2024.04.016]
- Jin W, Zhang Y, Zhao Z, Gao M. Developing targeted therapies for neuroblastoma by dissecting the effects of metabolic reprogramming on tumor microenvironments and progression. Theranostics 2024;14(9):3439-69. [PMID: 38948053 DOI: 10.7150/thno.93962]
- Locati M, Curtale G, Mantovani A. Diversity, mechanisms, and significance of macrophage plasticity. Annu Rev Pathol 2020;15:123-47. [PMID: 31530089 DOI: 10.1146/annurev-pathmechdis-012418-012718]
- Zhang Z, Xu Y, Cao C, Wang B, Guo J, et al. Exosomes as a messager to regulate the crosstalk between macrophages and cardiomyocytes under hypoxia conditions. J Cell Mol Med 2022;26(5):1486-500. [PMID: 35088943 DOI: 10.1111/jcmm.17162]
- Gong R, Jiang Z, Zagidullin N, Liu T, Cai B. Regulation of cardiomyocyte fate plasticity: a key strategy for cardiac regeneration. Signal Transduct Target Ther 2021;6(1):31. [PMID: 33500391 DOI: 10.1038/s41392-020-00413-2]
- Xiong T, Chen Y, Liu C, Li Y, Zhang Y, et al. Integrative single-cell and spatial transcriptome analysis reveals the functions of TREM2high macrophages and infarct border dynamics post-myocardial infarction. Mol Cell Biochem 2025;480(12):6077-109. [PMID: 40750734 DOI: 10.1007/s11010-025-05317-9]
- Hori M, Nishida K. Oxidative stress and left ventricular remodelling after myocardial infarction. Cardiovasc Res 2009;81(3):457-64. [PMID: 19047340 DOI: 10.1093/cvr/cvn335]
- Yang B, Qiao Y, Yan D, Meng Q. Targeting interactions between fibroblasts and macrophages to treat cardiac fibrosis. Cells 2024;13(9):764. [PMID: 38727300 DOI: 10.3390/cells13090764]
- Francis Stuart SD, De Jesus NM, Lindsey ML, Ripplinger CM. The crossroads of inflammation, fibrosis, and arrhythmia following myocardial infarction. J Mol Cell Cardiol 2016;91:114-22. [PMID: 26739214 DOI: 10.1016/j.yjmcc.2015.12.024]
- Tombor LS, Lautenschläger T, Glaser SF, Fischer A, Merten M, et al. Immunoregulatory endothelial cells interact with T cells after myocardial infarction. Circ Res 2025;137(6):866-79. [PMID: 40735785 DOI: 10.1161/CIRCRESAHA.125.326145]
- Xiao Z, Wei X, Li M, Yang K, Chen R, et al. Myeloid-specific deletion of Capns1 attenuates myocardial infarction injury via restoring mitochondrial function and inhibiting inflammasome activation. J Mol Cell Cardiol 2023;183:54-66. [PMID: 37689005 DOI: 10.1016/j.yjmcc.2023.08.006]