


Metabolic Profiles and Candidate Metabolic Features in Sanda Athletes: An Exploratory Pilot Study Comparing a Single Elite Athlete with a Non-elite Cohort
1Shanghai University of Sport, Changhai Road 399, Shanghai 200438, China
2College of Physical Education, South China Agricultural University Zhujiang College, Guangzhou 510900, China
aThese authors contributed equally to this work.
*Correspondence to: Bing Liu, School of Exercise and Health, Shanghai University of Sport, Changhai Road 399, Shanghai 200438, China. E-mail: liubing2019@sus.edu.cn
Received: March 23 2026; Revised: May 25 2026; Accepted: August 8 2026; Published Online: August 31 2026
Cite this paper:
Xu S, Cheng J, Chen Z et al. Metabolic Profiles and Candidate Metabolic Features in Sanda Athletes: An Exploratory Pilot Study Comparing a Single Elite Athlete with a Non-elite Cohort. BIO Integration 2026; 7: 1–13.
DOI: 10.15212/bioi-2026-0047. Available at: https://bio-integration.org/
Download citation
© 2026 The Authors. This is an open access article distributed under the terms of the Creative Commons Attribution License (https://creativecommons.org/licenses/by/4.0/). See https://bio-integration.org/copyright-and-permissions/
Abstract
Objective: This study was aimed at evaluating the feasibility of using non-invasive urinary metabolomics to track individual training responses in Sanda athletes, as well as exploring characteristic metabolic signatures in a top-tier performer.
Methods: Ten longitudinal biological urine samples collected across separate training days from a single international champion (n = 1) were compared against an 11-participant collegiate cohort (n = 11) as a benchmark reference. Pre- and post-exercise urine samples were collected after a standardized high-intensity sparring session and analyzed with UPLC-Q Exactive Plus LC-MS/MS.
Results: Post-exercise metabolic variations in the non-elite cohort clustered primarily within core energy pathways, including the tricarboxylic acid cycle and arginine/proline turnover. In contrast, the longitudinal profiles of the elite champion revealed a distinct, signal-dominant phenotype, with nominal enrichment (p <0.05) in retrograde endocannabinoid signaling and GABAergic synapse pathways. Supervised multivariate filtering identified specific structural phospholipids, such as phosphatidylcholine (PC) (16:0/18:2), phosphatidylethanolamine (PE) (18:0/22:6), and PC (15:0/P-18:1), as key candidate features demonstrating clear mathematical separation within this dataset.
Conclusion: Given the single-case experimental design and inherent training age imbalances, the identified nominal variations offer hypothesis-generating clues potentially associated with chronic physiological adaptation, rather than providing validated selection criteria. This study therefore reframes individual metabolomics as a discovery tool to capture individual homeostatic states and identified peripheral lipid regulation networks warranting future validation in larger independent cohorts.
Keywords
Athletic performance, elite athletes, exercise, metabonomics, pathway enrichment analysis, urine.
Introduction
In the past decade, the multi-systemic beneficial effects of acute and chronic exercise on cardiovascular, immune, and psychological health have been extensively demonstrated [1]. Sanda, also known as free fighting or Chinese boxing, is a comprehensive combat sport integrating diverse technical elements including kicking, punching, wrestling, and holding. Rather than being a purely aerobic sport, Sanda requires rigorous cardiorespiratory endurance punctuated by intermittent, high-intensity explosive efforts, thereby imposing substantial concurrent loads on both aerobic and anaerobic metabolic pathways [2]. Consequently, elucidating the post-exercise dynamic variations in professional athletes’ metabolic profiles is a topic of increasing interest to facilitate more scientific, individualized, and evidence-based coaching regimens. Metabolomics, because of its ability to provide comprehensive, high-resolution snapshots of low-molecular-weight biochemicals, has emerged as a cornerstone of sports science, particularly for evaluating systemic substrate utilization, mitochondrial adaptation, and distinct athletic metabolic phenotypes [3, 4].
Previous investigations across diverse biofluids, including plasma or urine, have successfully characterized exercise-induced shifts, specifically focusing on energy turnover, oxidative stress kinetics, steroid hormone fluxes, and fatty acid oxidation [5, 6]. Intriguingly, some studies have identified the post-exercise upregulation of circulating signaling molecules or lipid-derived neurotransmitter messengers, including endocannabinoids. For example, Mourtakos et al. have identified a significant elevation in anandamide (AEA) but not 2-arachidonoylglycerol (2-AG) in the hair profiles of Navy SEALs after 30 days of sustained, high-intensity physical conditioning [7]. The endocannabinoid system modulates diverse organ functions and homeostatic balance via complex intercellular signaling cascades. This system consists primarily of endogenous lipid ligands (AEA and 2-AG), two classical G-protein-coupled cannabinoid receptors (CB1R and CB2R), and their respective hydrolytic enzymes (fatty acid amide hydrolase [FAAH] and monoacylglycerol lipase [MAGL]). Structurally, CB1R is densely localized within the central nervous system but has lower expression in peripheral tissues; in contrast, CB2R is enriched peripherally, notably across immune cells and metabolic organs [8]. Functionally, the endocannabinoid system links peripheral metabolic status to neurobiological responses, via pathways associated with pain modulation, energy balance, exercise motivation, stress resilience, and emotional affect [9, 10]. Although the extensive neurobiological rewards induced by intense physical training, including analgesia, anxiolysis, and post-exercise euphoria, also known as runner’s high, were historically ascribed to endogenous endorphins, this opioid-centric hypothesis is increasingly scrutinized. Accumulating evidence indicates that hydrophilic endorphin molecules are structurally restricted from freely crossing the blood-brain barrier [11, 12], and the clinical administration of opioid receptor antagonists does not abolish post-exercise analgesia or psychological rewards [13, 14]. In contrast, lipophilic endocannabinoids freely cross cellular barriers and act as retrograde synaptic messengers [15]. Under activity-dependent post-synaptic synthesis, they engage presynaptic cannabinoid receptors in a retrograde manner and transiently suppress the release of neurotransmitters such as γ-aminobutyric acid (GABA) [16], thereby modulating neuro-excitatory thresholds and systematically dampening pain or anxiety perception during severe physiological stress [17].
By combining untargeted metabolomic screening with supervised pattern recognition algorithms, numerous sports-science studies have sought to identify distinct metabolic signatures correlated with athletic performance or physiological fatigue. For example, Cai et al. have used plasma metabolomics to differentiate elite and sub-elite swimmers, and used a four-metabolite panel to construct a predictive framework of training competitive status, which yielded an area under the receiver operating characteristic curve (AUC) of 0.904 [18]. Parallel discovery-driven workflows have integrated genomics and proteomics to pinpoint individual phenotypic markers across distinct physiological cohorts [19–21]. However, non-invasive metabolomic investigations evaluating top-tier, world-championship combat athletes, particularly under longitudinal observation, are notably lacking in the current literature. Compared with blood collection, urine sampling offers critical pragmatic benefits in elite athletic settings, including non-invasiveness, negligible bio-sampling stress, lower operational costs, and the ability to capture time-integrated systemic metabolic outputs. Importantly, obtaining large cohort sizes of world-class, elite combat champions is hindered by the extreme scarcity of this unique population and the logistical barriers of field-based sports testing.
Therefore, this exploratory pilot study used non-invasive urinary metabolomics to compare a single elite, international-championship Sanda athlete, examined over multiple repeated longitudinal training days, against a benchmark comprising a standardized non-elite collegiate Sanda cohort. The primary objective was not to establish a generalized, group-level diagnostic standard for athlete selection but to obtain detailed, case-specific descriptive insights into individual high-performance metabolic adaptation, and to generate preliminary hypothesis-generating clues regarding lipid signaling and substrate utilization under acute exercise stress.
Methods
Experimental approach
Liquid chromatography-mass spectrometry (LC-MS) analysis was performed with an ultra-high-performance liquid chromatography (UPLC) system coupled with a Q Exactive Plus Hybrid Quadrupole-Orbitrap Mass Spectrometer (Thermo Fisher Scientific). The system was operated in data-dependent acquisition mode to obtain primary and secondary mass spectrometry data for a full-spectrum metabolomic analysis of urine samples collected from non-elite and a single elite Sanda athlete before and after training.
Participants
Twelve participants were enrolled in this exploratory pilot study. The benchmarking cohort comprised 11 non-elite collegiate athletes majoring in Sanda, each with <10 years of formal training and no prior record of podium placements in international competitions. In contrast, the high-performance tier was represented by a single elite athlete with 17 years of rigorous professional training and a distinguished competitive history, including multiple championship titles in prestigious international events.
From the single elite athlete, ten urine samples were systematically collected to monitor the longitudinal profile and stability of his acute metabolic responses. Crucially, these samples were collected from the same participant on different training days and were recorded as longitudinal repeated biological collections instead of technical mass-spectrometry replicates. Five pre-exercise specimens and five post-exercise specimens were obtained under identical training conditions. In total, 32 biological urine samples were successfully processed for downstream analysis. To protect participant confidentiality, all identifying personal metadata were strictly omitted. The detailed anthropometric profiles of the participants are documented in Table S1 of the Supplementary Information.
In preparation for testing, all athletes reported to the laboratory and abstained from alcohol and caffeine for at least 8 h before testing. Additionally, they consumed their normal diet. Notably, minor variations in daily routines and dietary intake cannot be completely standardized in a field study setting, thus representing an inherent limitation of this non-clinical pilot design.
Procedures
Urine sample preparation
Urine samples were collected before training on the first morning (denoted pre) and immediately after exercise (denoted post). Both the non-elite group and the single elite athlete completed an identical standardized exercise regimen comprising 20 minutes of warm-up, 30 minutes of technical drills, 30 minutes of tactical training, and 40 minutes of combat (details in SI data). Although this design ensured that the absolute physical workload was standardized across all participants, we acknowledge that the relative acute physiological load might have varied between the elite athlete and the non-elite athletes, because of differences in baseline fitness and technical efficiency.
To establish a reliable longitudinal profile for the elite athlete, we collected five repeated biological urine samples before and after exercise on different days. Ultimately, 32 urine samples were collected and stored at −80°C until analysis.
Before analysis, the samples were thawed at 4°C. A 100 μL aliquot of each urine sample was mixed with 400 μL pre-cooled pure methanol, vortex mixed, and sonicated in an ice bath for 20 minutes. The mixture was then incubated at −20°C for 1 hour, then centrifuged at 16,000 × g at 4°C for 20 minutes. The supernatant was collected and evaporated to dryness with a high-speed vacuum concentrator. Before LC-MS analysis, the dried extracts were reconstituted in 100 μL methanol-water solution (1:1, v/v) and centrifuged at 20,000 × g at 4°C for 5 minutes. A blank sample was prepared with a 50% methanol-water solution. To ensure the stability and repeatability of the analytical conditions, equal volumes from all samples were pooled to create a quality control (QC) sample, which was processed in parallel with the identical extraction method.
LC-MS/MS analysis
Chromatographic separation was achieved with an Acquity UPLC® HSS T3 column (2.1 × 100 mm, 1.8 μm; Waters, Milford, MA, USA) with a binary mobile phase gradient system delivered by an LC-30AD ultra-high-performance liquid chromatography system (Shimadzu, Kyoto, Japan). The mobile phase comprised phase A (0.1% formic acid in ultra-pure water, v/v) and phase B (100% HPLC-grade acetonitrile). The autosampler and column oven temperatures were strictly maintained at 4°C and 40°C, respectively, and an optimized injection volume of 4 μL per sample was used. Elution was performed at a constant flow rate of 0.3 mL/min with the following optimized multi-step linear gradient program: 0–2.0 min, held at 0% B; 2.0–6.0 min, linearly ramped to 48% B; 6.0–10.0 min, increased to 100% B; 10.0–12.0 min, sustained at 100% B; 12.0–12.1 min, rapidly decreased back to 0% B; and 12.1–15.1 min, maintained at 0% B for thorough column re-equilibration. To comprehensively eliminate any systematic analytical bias and potential signal drift, we fully randomized the entire sample running sequence before sequence execution. Furthermore, to closely track analytical stability and ensure cross-batch data reproducibility, we systematically interleaved and injected a pooled QC sample and a procedural solvent blank vial after every 10 to 12 consecutive experimental biological injections.
For mass spectrometric detection, the UPLC effluent was directly input into a Q Exactive Plus Hybrid Quadrupole-Orbitrap Mass Spectrometer (Thermo Fisher Scientific, Waltham, MA, USA) equipped with a heated electrospray ionization (HESI) source. The mass spectrometer was operated in data-dependent acquisition mode, alternating between full-scan (MS1) and tandem mass spectrometry (MS2) acquisition. HESI ion source parameter configurations for separate positive and negative polarity acquisition runs were systematically optimized as follows: spray voltage, 3.8 kV (positive ion mode) and 3.2 kV (negative ion mode); capillary temperature, 320°C; sheath gas (N2) flow rate, 30 arbitrary units; auxiliary gas flow rate, 5 arbitrary units; probe heater temperature, 350°C; and S-lens RF level, 50. Full MS1 scan profiles were acquired across a mass-to-charge ratio range of m/z 70–1,050 at a mass resolution of 70,000 (at m/z 200). High-energy MS2 fragmentation scans were concurrently collected at a resolution of 17,500 (at m/z 200). The maximum automated gain control target injection times were strictly restricted to 100 ms for MS1 full scans and 50 ms for MS2 fragmentations. Precursor ion isolation windows were configured at an isolation width of 2 m/z. High-energy collision-induced dissociation fragmentation was carefully triggered with stepped normalized collision energies at precisely 20 eV, 30 eV, and 40 eV.
Statistical analysis
All raw LC-MS/MS data files were systematically processed in MS-DIAL software (version 4.90; RIKEN Center for Sustainable Resource Science, Yokohama, Japan). Preprocessing workflows encompassed peak extraction, retention time correction, and peak alignment. The primary parameters were configured with a retention time range of 1 to 15 min; a retention time tolerance for alignment of 0.1 min; and a mass tolerance of 10 ppm. Isotopic peaks were excluded during feature detection. Metabolite structural annotation achieved Metabolomics Standards Initiative Level 2 identification via accurate mass matching with a mass tolerance <10 ppm and MS2 spectrum matching with a mass tolerance <0.01 Da against public repositories, including the Human Metabolome Database, MassBank, and Global Natural Products Social Molecular Networking. Ion features with missing values >50% within either group were systematically filtered out. To rigorously control for variations in urine volume and individual hydration status, we separately applied total peak area normalization to the positive and negative ion datasets. Reconstituted feature matrices were subsequently merged and subjected to unit variance scaling before multivariate pattern recognition.
Multidimensional statistical workflows were executed with Python (version 3.8.10). To characterize exercise-induced metabolic shifts, we selected differential features between pre- and post-exercise states through a dual-criterion strategy based on a variable importance in the projection (VIP) value >1.0 derived from orthogonal partial least squares discriminant analysis (OPLS-DA), together with a nominal p-value <0.05 from Student’s t-tests on normalized peak intensities. Fold change was computed as the post-to-pre intensity ratio. Crucially, false discovery rate correction was not strictly applied, because of the exploratory, hypothesis-generating aim of this pilot study; hence, these uncorrected p-values were interpreted as nominal signs bearing a potential risk of false positives [22, 23]. The structural stability of the OPLS-DA models was cross-validated with a 200-fold permutation test. Importantly, because the elite architecture relied on non-independent longitudinal collections from a single individual, the associated OPLS-DA model mapped the case-specific idiosyncratic variance of this top-tier athlete rather than generalizable population-level differences. With this workflow, 147 and 26 nominally differential metabolites were successfully filtered for the non-elite cohort and the single elite athlete, respectively. Downstream pathway enrichment analysis was conducted via the Kyoto Encyclopedia of Genes and Genomes (KEGG) database (https://www.kegg.jp/), with a hypergeometric test for over-representation analysis. The resulting pathways were treated cautiously as single-case exploratory observations.
To identify highly distinct candidate metabolites driving the metabolic divergence between the elite athlete and non-elite cohort, we computed a difference ratio to mitigate baseline environmental and dietary confounding forces. For each metabolite, the post-exercise intensity was subtracted from its pre-exercise baseline and normalized by the pre-exercise value. The resulting difference ratio matrix was unit variance scaled and subjected to a comparative OPLS-DA model (validated via a 200-fold permutation test). Metabolites with VIP >1.0 were further explored via receiver operating characteristic (ROC) and boxplot visualizations in MetaboAnalyst 6.0 (https://www.metaboanalyst.ca/). Crucially, because the elite sample was derived from repeated longitudinal observations of a single individual, formal group-level predictive assessment with ROC-based statistics, including AUC, sensitivity, and specificity, was statistically inappropriate and would have been highly susceptible to overfitting. OC curves and boxplots were used exclusively as descriptive visualization tools to quantify the mathematical separation between the single elite athlete and the non-elite cohort within the confines of this specific dataset, and do not constitute evidence of validated predictive ability for population-wide athlete selection.
Results
LC-MS/MS analysis for metabolic profiling
Untargeted metabolomic analysis was systematically performed on urine samples from the benchmarking non-elite cohort and the single elite athlete captured at both pre- and post-exercise time points. This analytical framework was used to preliminarily investigate the acute systemic effects of regimented combat training on the human urinary metabolome, while simultaneously exploring case-specific metabolic divergence between the non-elite baseline and the top-tier elite athlete. The high-resolution UPLC-QE Plus mass spectrometry platform successfully captured comprehensive metabolic profiles across separate positive and negative electrospray ionization modes. To rigorously validate the analytical reliability of the datasets, we conducted endogenous and system-wide QC evaluations. Creatine, serving as a reliable endogenous standard in urine QC matrices, exhibited excellent chromatographic alignment and signal reproducibility across both ionization polarities. Concurrently, the superimposed total ion chromatograms of the pooled QC samples demonstrated exceptional visual and mathematical overlap throughout the entire chromatographic sequence in both positive and negative ion modes. These tight alignments collectively demonstrated that the analytical instrumentation, running sequence, and extraction method had highly favorable stability, robustness, and technical repeatability. This high-quality metabolomic dataset was therefore deemed fully suitable for downstream exploratory multivariate pattern recognition and comparative feature extraction (Supplementary Information, Figure S1).
Metabolomic changes in non-elite athletes
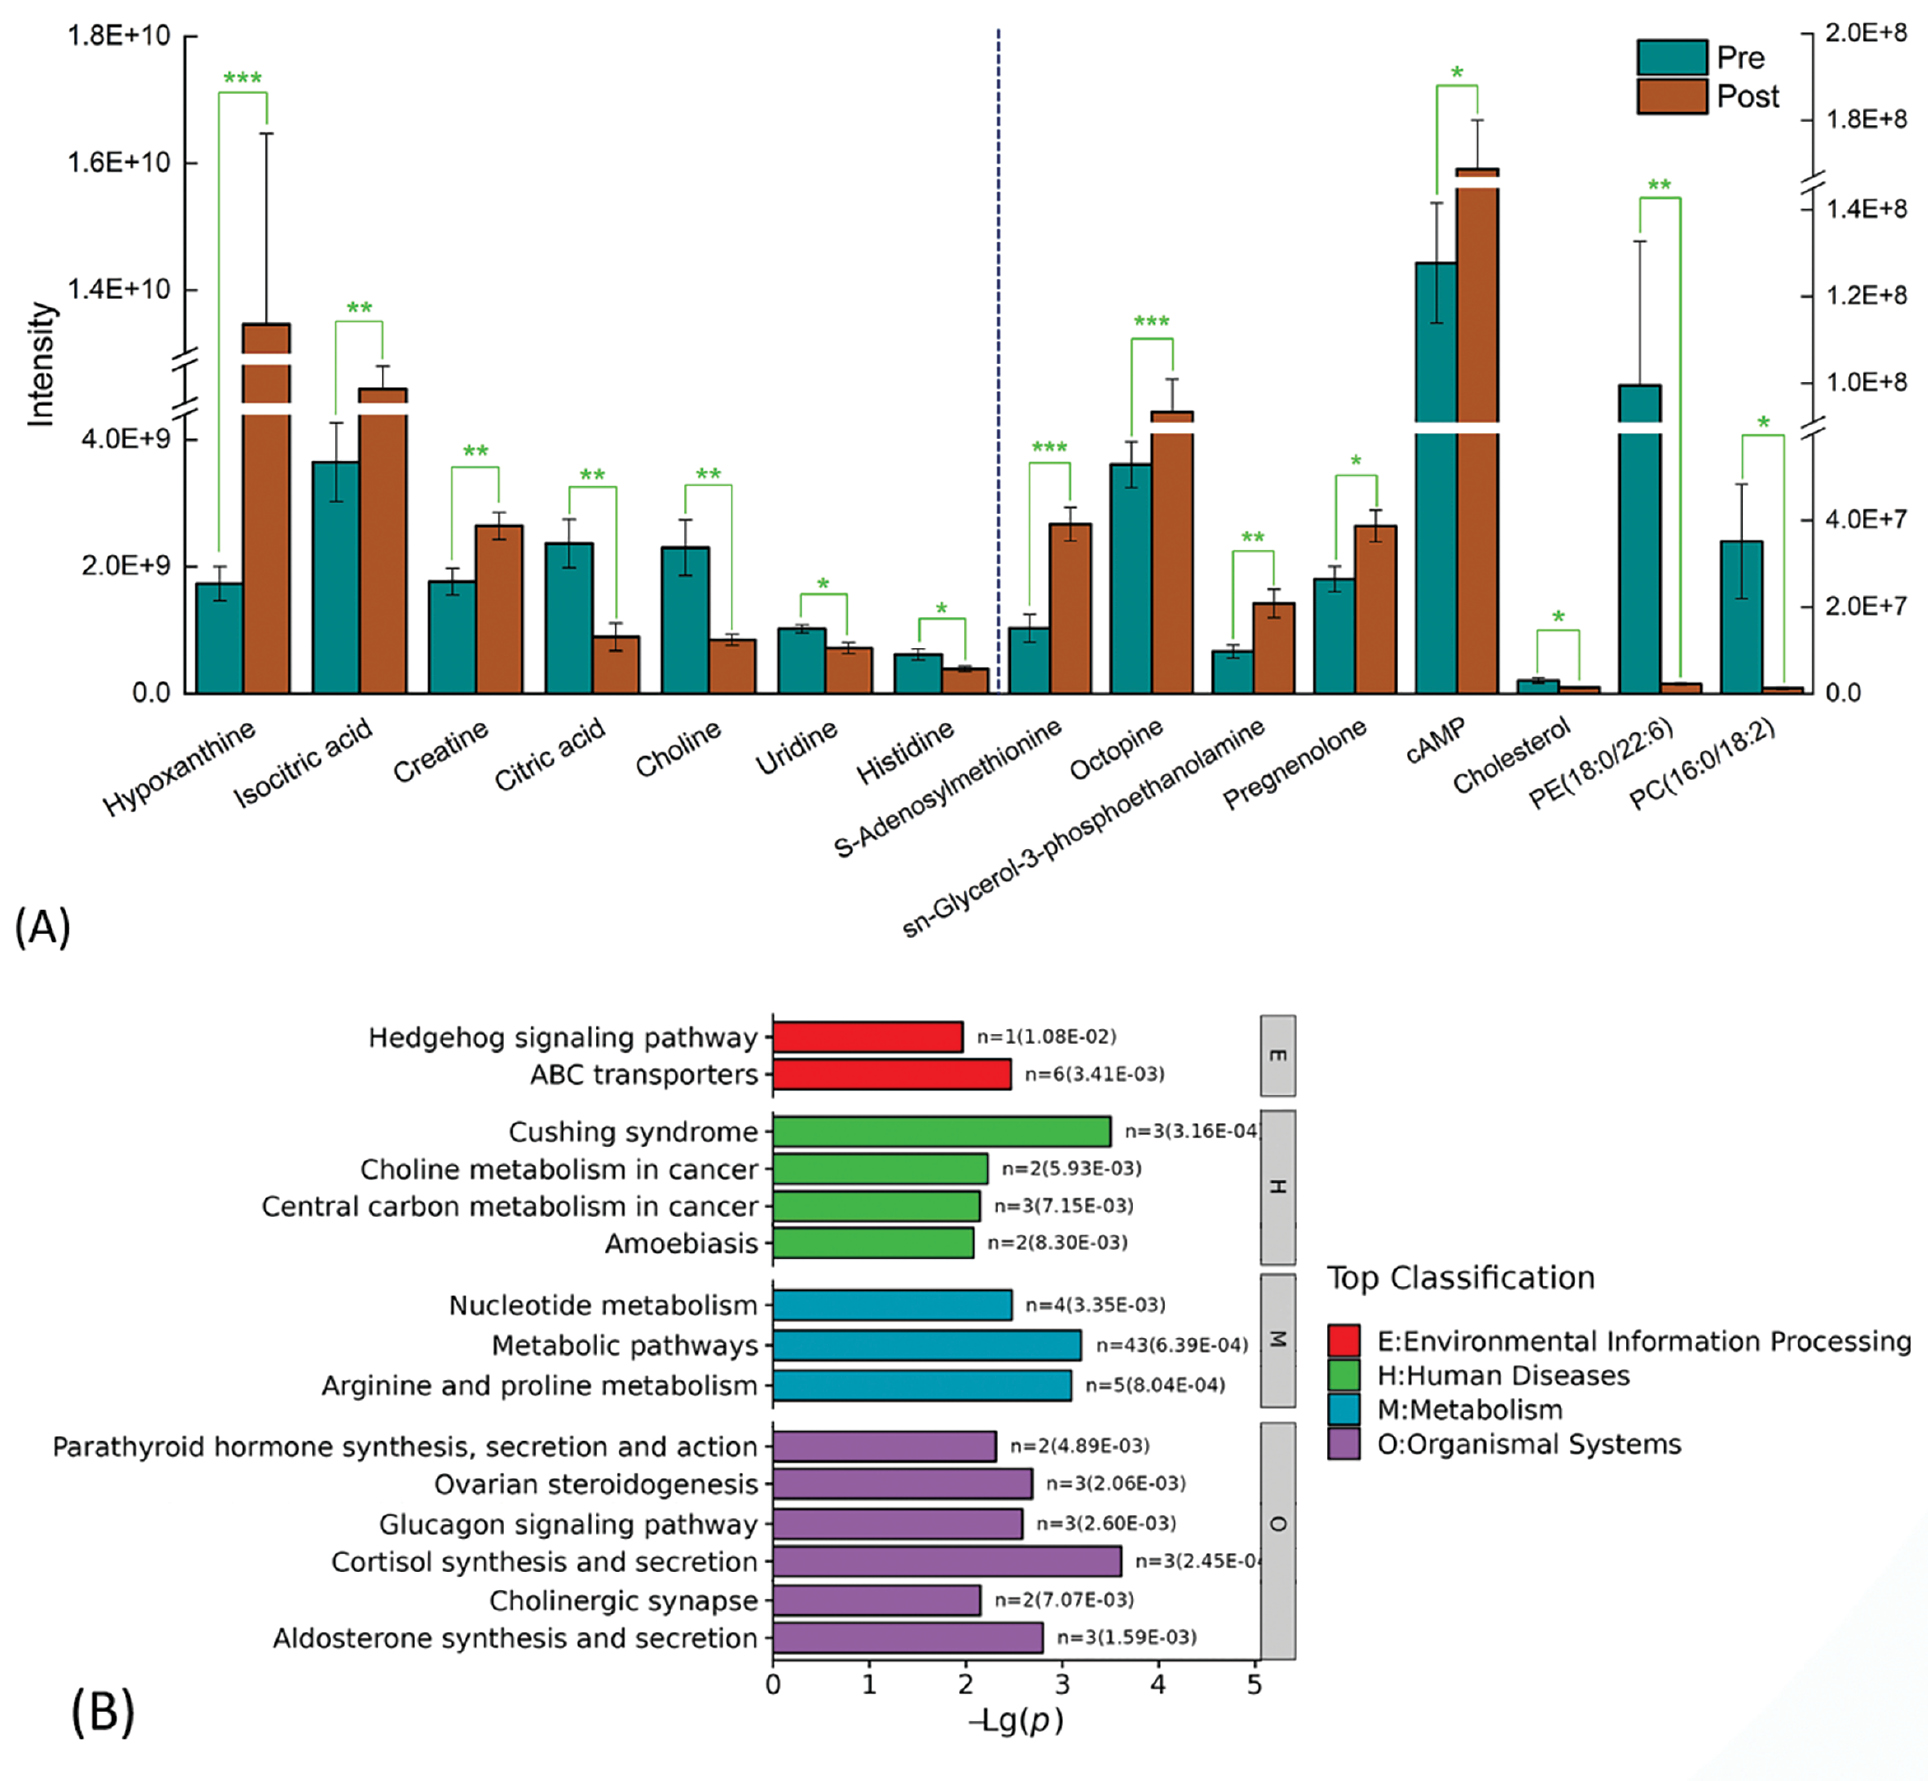
Post-exercise urine profiles from the non-elite cohort revealed 147 nominally differential metabolites (p <0.05) relative to the pre-exercise baselines. Key upregulated compounds included pregnenolone, cAMP, S-adenosylmethionine, octopine, hypoxanthine, sn-glycerol-3-phosphoethanolamine, isocitric acid, and creatine. In contrast, compounds such as histidine, citric acid, choline, cholesterol, and uridine were nominally downregulated after the training session. Pathway enrichment analysis mapped these differential metabolites to 37 nominally enriched pathways. The primary enriched cascades involved cortisol synthesis and secretion, arginine and proline metabolism, aldosterone synthesis and secretion, nucleotide metabolism, the insulin signaling pathway, histidine metabolism, and the citrate cycle (TCA cycle). Figure 1 presents selected differential metabolites (Figure 1A) and the top 15 enriched pathways (Figure 1B). The significance thresholds were * p <0.05, ** p <0.01, and *** p <0.001.
Figure 1 Exercise-induced urinary metabolic variations in the non-elite cohort. (A) Relative intensities of selected differential metabolites before (pre) and after (post) exercise (n = 11 independent participants). Error bars represent SD. Asterisks indicate uncorrected nominal thresholds from Student’s t-tests (*p <0.05, **p <0.01, ***p <0.001). The vertical dashed line separates metabolites plotted on the left vs. right axes. (B) Top 15 nominally enriched KEGG pathways, according to uncorrected metabolite lists.
Metabolomics changes in the single elite athlete
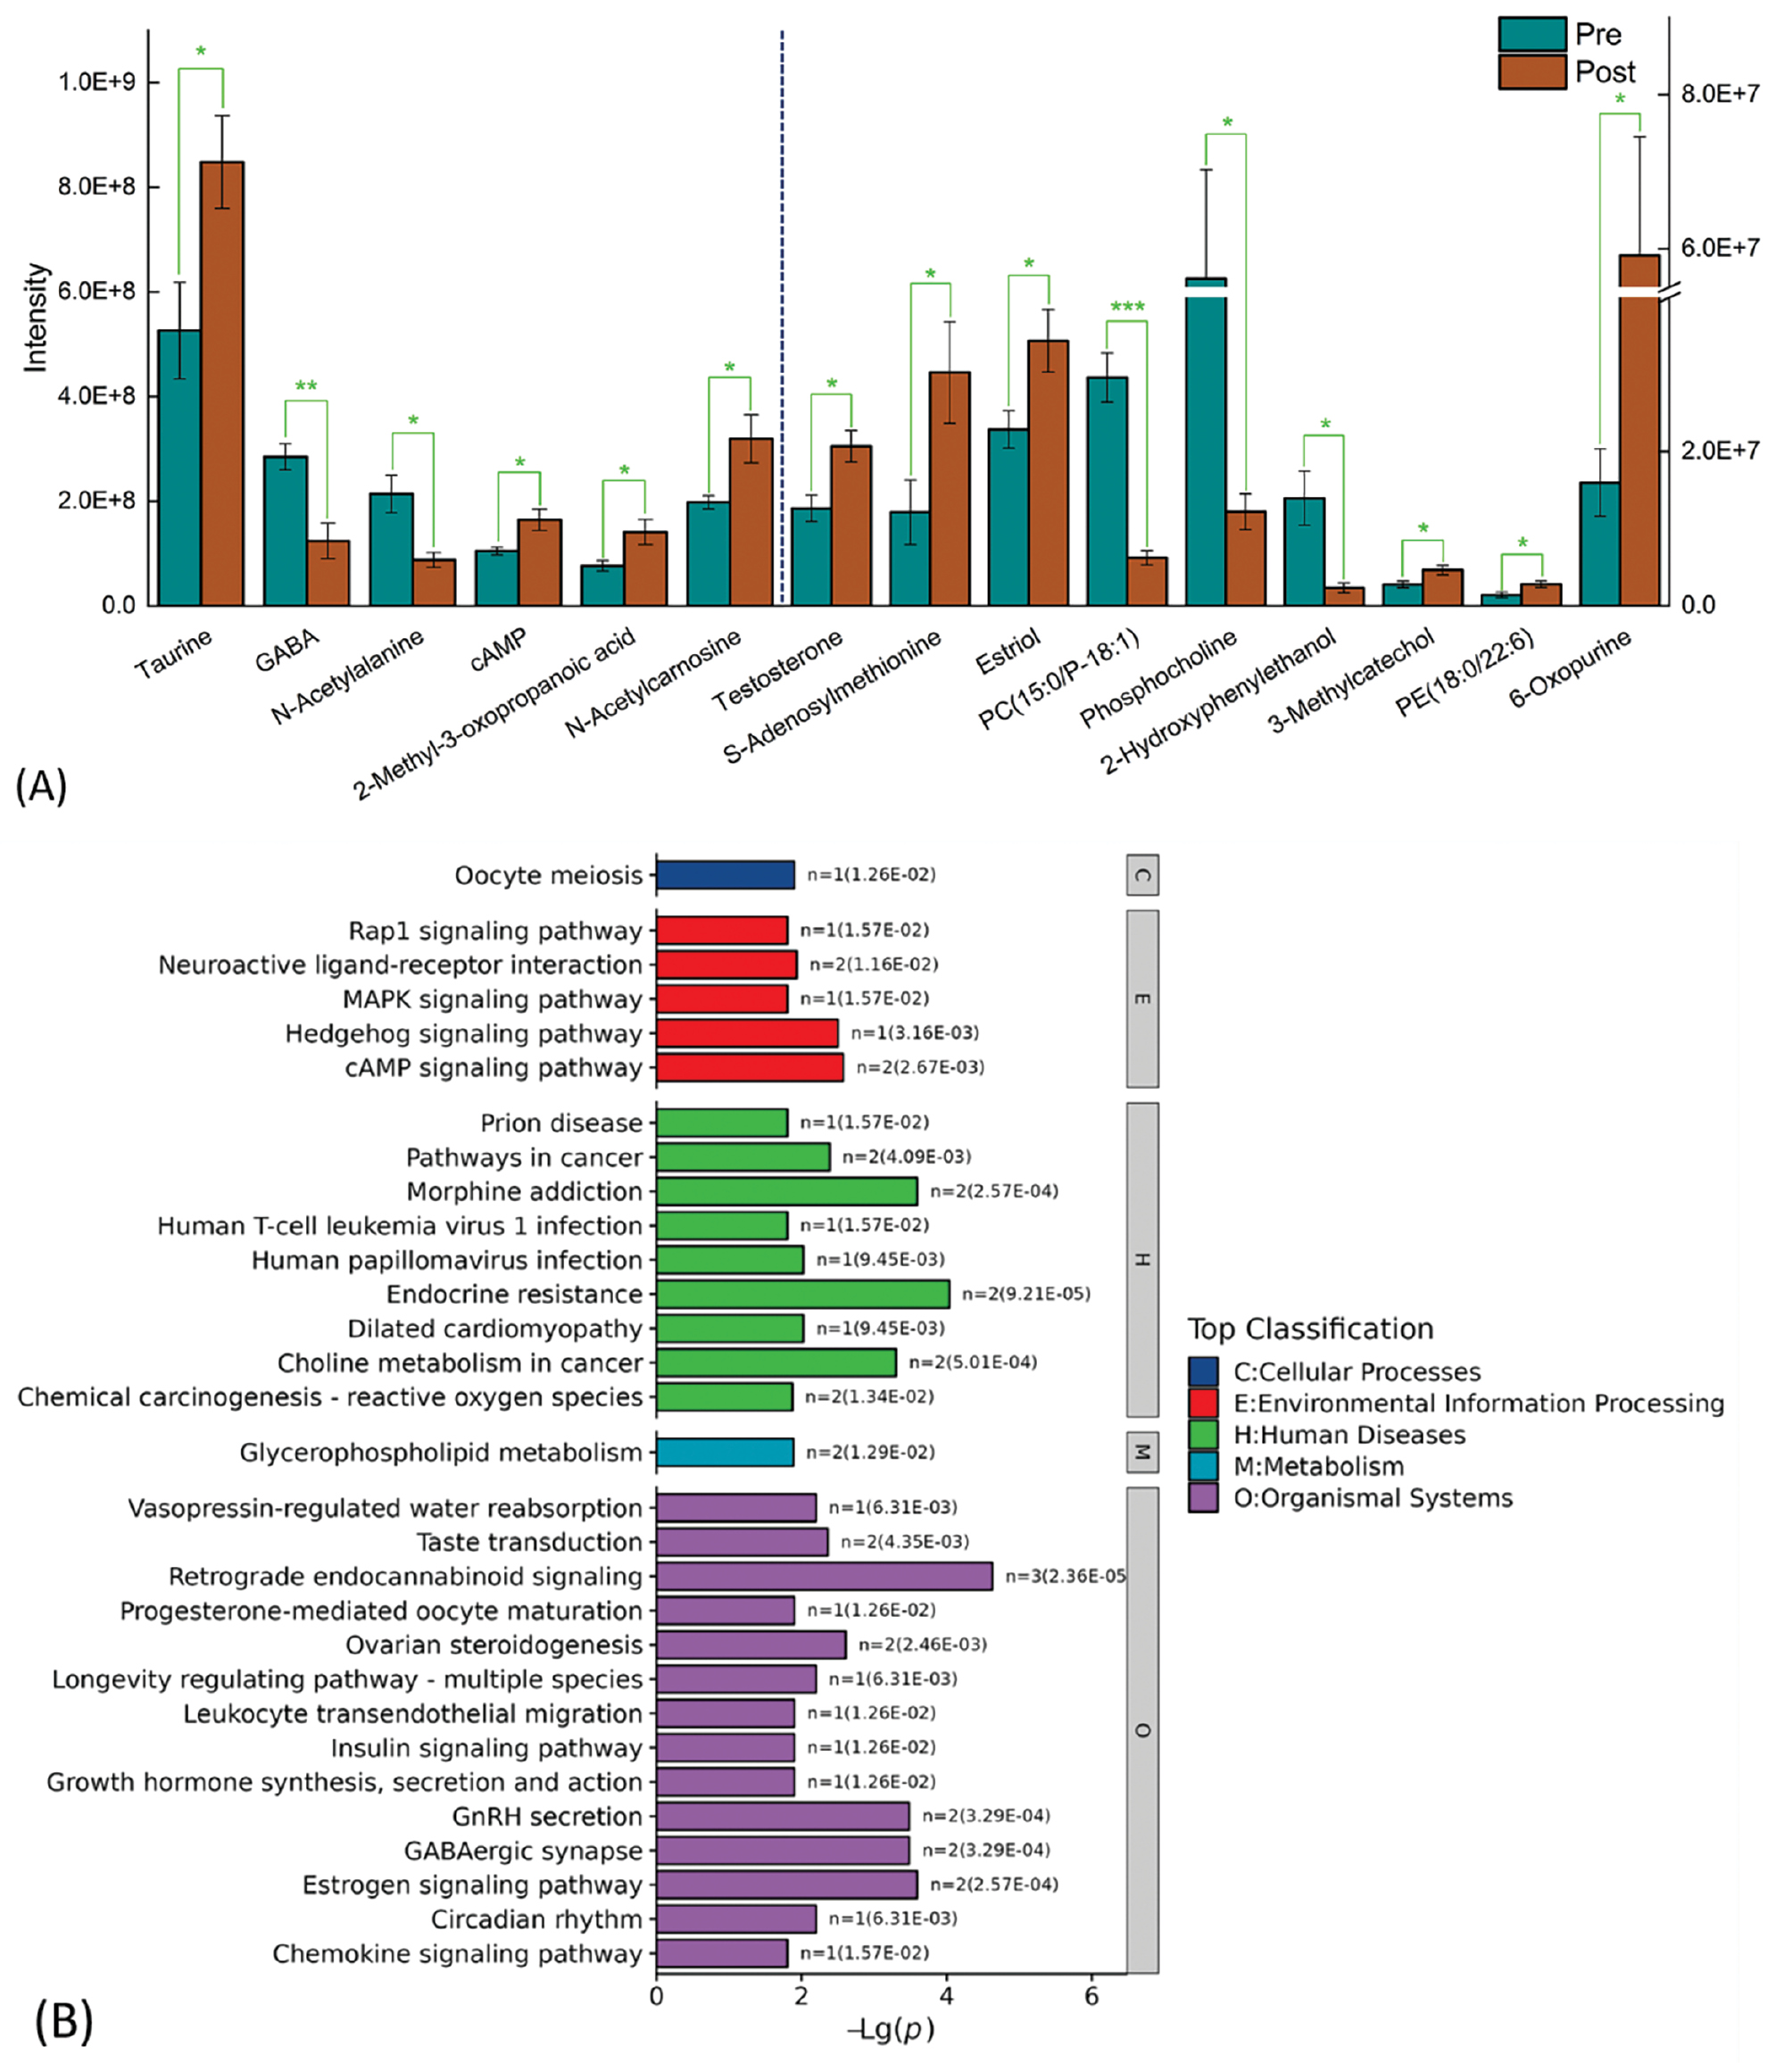
In the repeated longitudinal profiles of the single elite athlete, 26 metabolites were filtered as nominally differential (p <0.05) after exercise vs. the pre-exercise baseline. Specifically, testosterone, cAMP, taurine, estriol, S-adenosylmethionine, and 3-methylcatechol were nominally upregulated, whereas GABA, phosphatidylcholine (PC), and phosphocholine were nominally downregulated. Pathway enrichment analysis mapped these differential features to 74 nominally enriched cascades (Figure 2). The primary enriched pathways included retrograde endocannabinoid signaling, the GABAergic synapse, the estrogen signaling pathway, GnRH secretion, the cAMP signaling pathway, the Hedgehog signaling pathway, and glycerophospholipid metabolism.
Figure 2 Exercise-induced urinary metabolic variations in the single elite athlete. (A) Relative intensities of selected differential metabolites before (pre) and after (post) exercise, derived from repeated longitudinal biological collections (n = 1; 5 pre- vs. 5 post-exercise samples). Error bars represent SD. Asterisks indicate uncorrected nominal thresholds from Student’s t-tests (*p <0.05, **p <0.01, ***p <0.001). The vertical dashed line separates the axes. (B) Top 30 exploratory, nominally enriched KEGG pathways.
Descriptive mapping of nominal pathway characteristics between the non-elite cohort and the single elite athlete
Given that the elite tier was inherently restricted to a single individual, a formal group-level comparative evaluation of biological pathways was statistically unfeasible. Instead, preliminary KEGG pathway enrichment profiles are presented as a descriptive mapping to contrast the generalized metabolic signature of the non-elite cohort against the idiosyncratic phenotypic response of the highly trained elite athlete. In the non-elite cohort, the post-exercise nominal pathway enrichment converged on fundamental pathways of energy conversion and carbon substrate turnover, primarily the TCA cycle; ascorbate and aldarate metabolism; and glyoxylate and dicarboxylate metabolism. This centralized metabolic profile aligned with the expected collective bioenergetic demands required to sustain acute Sanda training within a collegiate cohort.
In contrast, the repeated longitudinal assessments of the single elite athlete revealed an exploratory metabolic signature characterized by a high density of cellular signaling and communication cascades. For example, the neuroactive ligand-receptor interaction pathway was nominally enriched exclusively within the single elite profile. For systemic signal transduction, nine separate pathways exhibited nominal enrichment in the elite athlete, including the cAMP, Hedgehog, MAPK, calcium, and phospholipase D pathways, whereas the non-elite cohort presented nominal enrichment solely in the Hedgehog signaling cascade.
The most pronounced phenotypic divergence appeared within pathways annotated to the nervous system. Although the non-elite cohort exhibited nominal enrichment only in the cholinergic synapse pathway, an exploratory analysis indicated that differential metabolites in the single elite athlete were nominally enriched across seven additional neural cascades, including retrograde endocannabinoid signaling, the GABAergic synapse, the glutamatergic synapse, and the synaptic vesicle cycle.
Crucially, these distinct functional categorizations must not be interpreted as validated, generalizable pathway alterations that differentiate elite from non-elite athletes. Instead, these descriptive variations suggest that, whereas the less trained cohort exhibits generalized bioenergetic turnover, the elite champion presented a highly individual, signal-dominant homeostatic response.
Descriptive profiling and extraction of highly differential candidate features
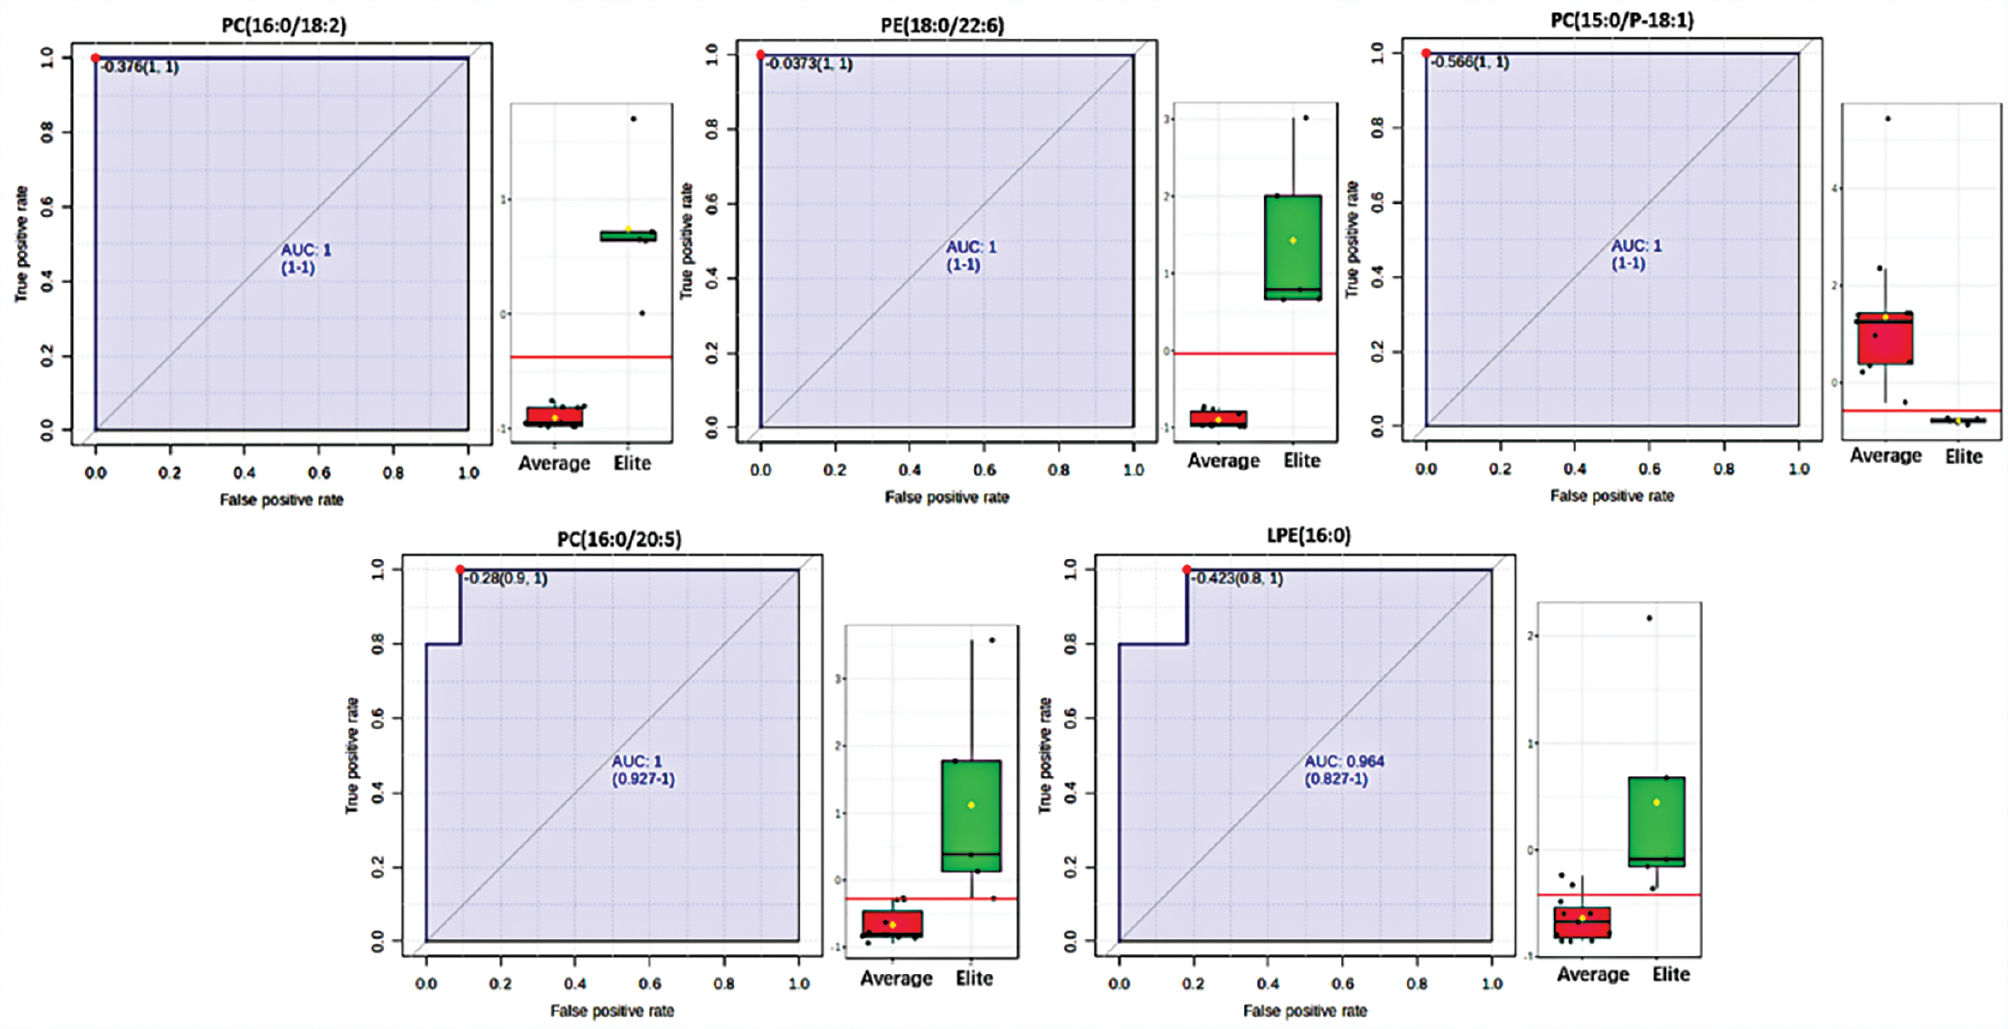
To isolate specific metabolites driving the biochemical divergence between the single elite athlete and the non-elite cohort, we constructed a supervised OPLS-DA model based on post-exercise metabolic difference ratios. This model served strictly as a dimensionality-reduction and feature-filtering tool to evaluate case-specific variance rather than to establish a generalized population-level classification boundary. The score plot illustrated a distinct mathematical separation between the non-elite cohort and the longitudinal tracking samples of the elite champion (Figure S2-A). A 200-fold permutation test was performed to evaluate whether this intra-dataset separation was driven by computational artifacts (Figure S2-B). Because all permuted Q2Y values remained below the original model value, and the regression intercept intersected below zero, the mathematical separation within this specific dataset was considered stable and not a result of random assignment. VIP values were used to rank the relative contribution of each feature to the observed separation. To simplify the multi-dimensional dataset and visualize the magnitude of divergence for individual key features, we generated ROC curves and boxplots for all metabolites with VIP >1.0. Table 1 summarizes the descriptive ROC results, restricted to the top-tier candidate features with an AUC >0.95. Because the elite data relied on longitudinal measurements from one participant, these parameters were treated strictly as descriptive mathematical measures of distance within this discovery cohort, with no validation or diagnostic utility for wide-scale athlete selection.
Table 1 ROC Performance of Nominally Differential Metabolites with VIP >1 and AUC >0.95
| Metabolite | AUC | Sensitivity | Specificity | Cutoff | T-test Significance |
|---|---|---|---|---|---|
| PC (16:0/18:2) | 1 | 1 | 1 | −0.376 | *** |
| PE (18:0/22:6) | 1 | 1 | 1 | −0.037 | *** |
| PC (15:0/P-18:1) | 1 | 1 | 1 | −0.566 | ** |
| PC (16:0/20:5) | 0.982 | 1 | 0.909 | −0.280 | ** |
| LPE (16:0) | 0.964 | 1 | 0.818 | −0.423 | ** |
Note: ** p <0.01, and *** p <0.001.
PC: phosphatidylcholine; PE: phosphatidylethanolamine; LPE: lysophosphatidylethanolamine.
PC species including PC (16:0/18:2) and PC (15:0/P-18:1), along with phosphatidylethanolamine PE (18:0/22:6), exhibited distinct differential patterns between the cohort baseline and the elite athlete. Within this dataset, their descriptive AUC, sensitivity, and specificity values reached 1.0, univariate t-test p-values were <0.05, and the significance thresholds for PC (16:0/18:2) and PE (18:0/22:6) were <0.001. Boxplot tracking reinforced these post-exercise variations (Figure 3). After the exercise protocol, PC (16:0/18:2) and PE (18:0/22:6) concentrations rose in the elite athlete but fell in the non-elite cohort. In contrast, PC (15:0/P-18:1) presented a pronounced post-exercise reduction in the elite athlete but increased in the non-elite cohort. On the basis of these mathematical distributions, the observed case-specific thresholds within this current dataset were defined by an exercise-induced change ratio greater than −0.376 for PC (16:0/18:2), greater than −0.037 for PE (18:0/22:6), and less than −0.566 for PC (15:0/P-18:1). Because these boundaries were derived from repeated measurements in a single participant, overfitting bias was mathematically inevitable. These values therefore should be considered purely descriptive metrics documenting the magnitude of divergence in this pilot cohort. These specific thresholds and lipid candidates represent preliminary hypothesis-generating observations that will require replication in larger, properly matched independent cohorts before any diagnostic or predictive utility is assigned to athlete evaluation.
Figure 3 Descriptive ROC curves and boxplots of candidate differential metabolites. These plots provide a strictly descriptive visualization of intra-dataset separation between the non-elite cohort (n = 11) and the single elite athlete (n = 1). Because of the single-case architecture and potential overfitting, these parameters (AUC and cutoff values) do not imply validated predictive or diagnostic abilities.
Discussion
After the acute exercise stimulus, the non-elite cohort exhibited primarily nominal metabolic fluctuations associated with systemic energy conversion and substrate turnover. The nominal post-exercise accumulation of urinary creatine and octopine, concurrently mirrored by the nominal depletion of citric acid within the TCA cycle, indicated high reliance on immediate phosphagen and carbohydrate turnover to sustain the physical demands of high-intensity Sanda sparring. This collective metabolic shift aligned with established sports-science literature findings indicating that less trained or collegiate-level athletes satisfy acute ATP deficits predominantly through conventional anaerobic glycolysis and immediate amino acid catabolism [24, 25]. The nominal elevation in metabolic degradation byproducts, such as xanthine and hypoxanthine, further corroborated a generalized acceleration of purine nucleotide turnover secondary to acute exercise stress. These collective biomolecular signatures characterized a standard, collective homeostatic disruption typically captured in conventional elite-athlete cohorts or sub-elite training models under strenuous external workloads, instead of reflecting high-performance physiological refinement.
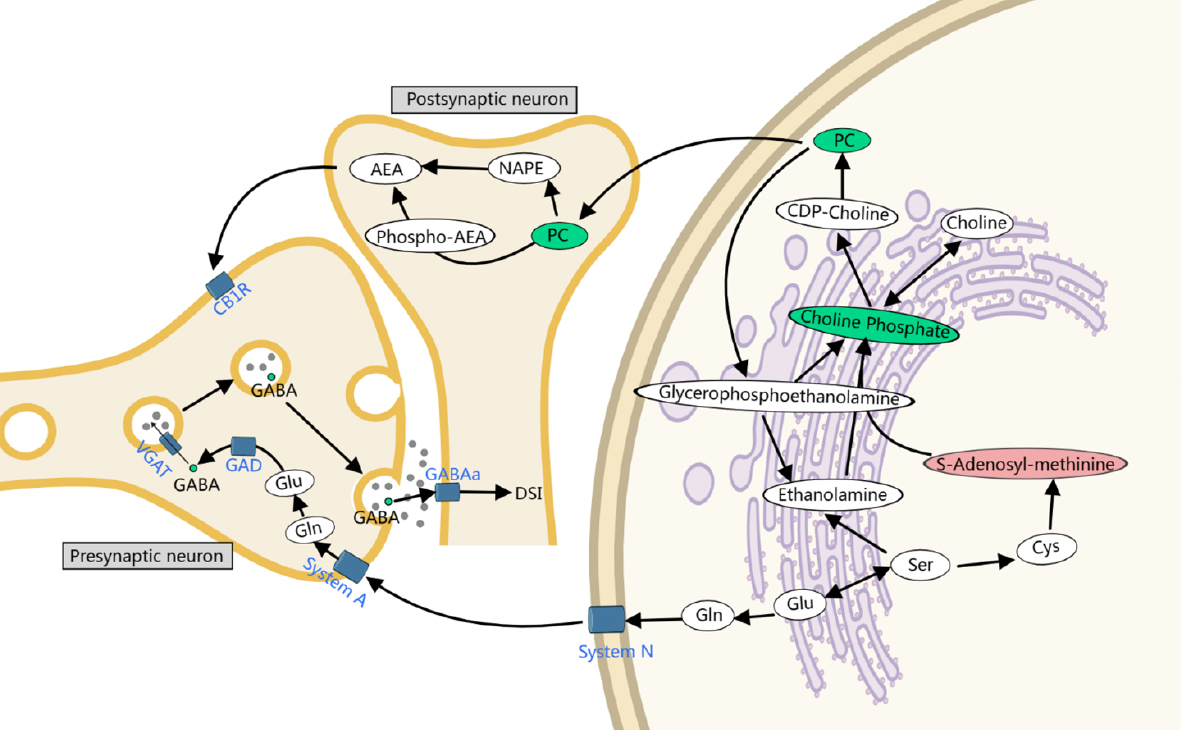
In stark contrast to the basic bioenergetic signature captured in the non-elite cohort, the repeated longitudinal assessments of the single elite athlete uncovered an exploratory metabolic phenotype characterized by a high density of cellular signaling and communication cascades. The retrograde endocannabinoid signaling pathway nominally emerged as the most prominent altered network, thus suggesting a potential high-performance metabolic feature unique to this top-tier athlete. Systemically, this shift was evidenced by the nominal post-exercise consumption of upstream lipid precursors, specifically PC species, alongside a concurrent nominal decrease in downstream GABA levels.
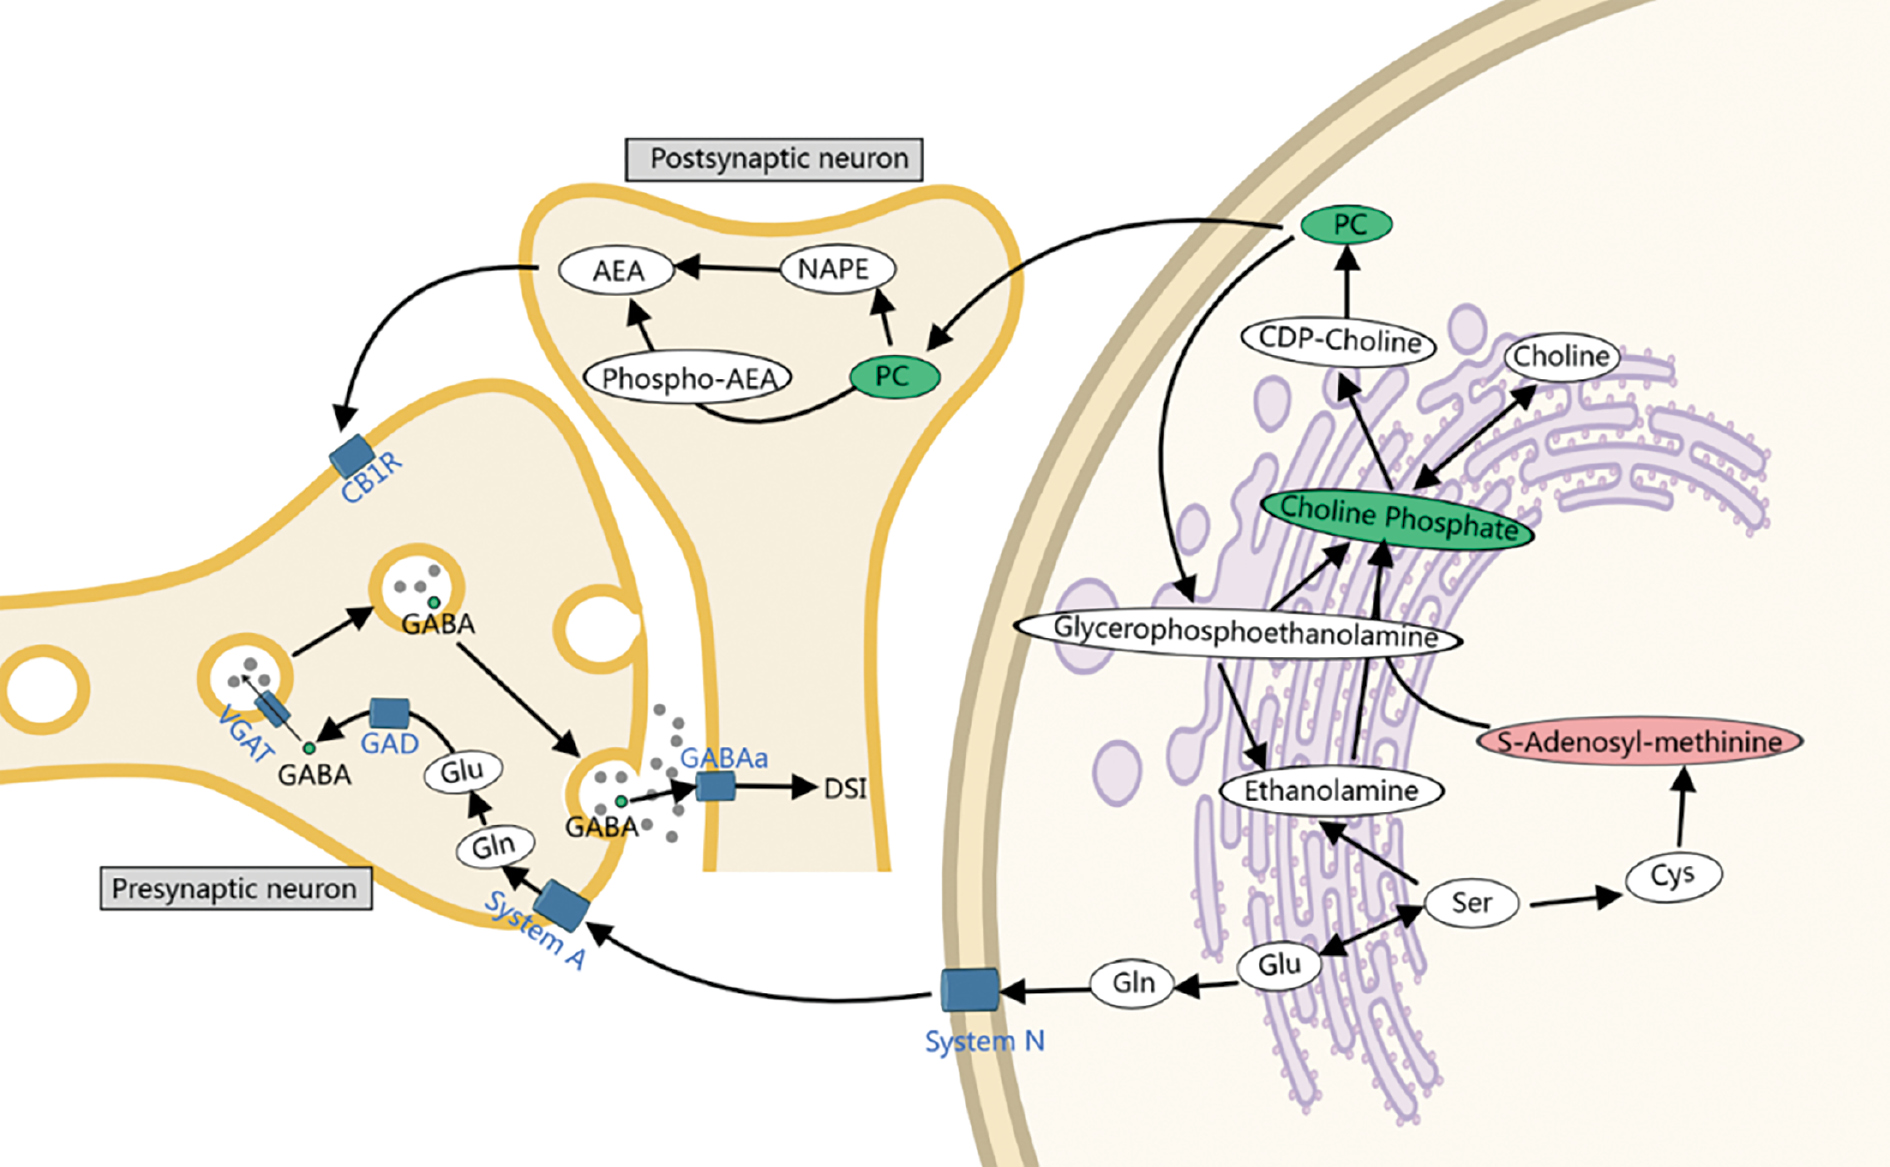
Crucially, because urine reflects integrated peripheral excretion rather than localized neurochemistry, these findings cannot directly confirm localized central nervous system modulation, neural excitation, or alterations in synaptic vesicle cycles. Instead, this systemic profile notably provides a literature-informed parallel to known endocannabinoid utilization models. In classical mammalian physiological models, activity-dependent endocannabinoid signaling temporarily suppresses inhibitory GABAergic neurotransmission, a mechanism theoretically associated with the preservation of locomotor motivation and the dampening of central fatigue during prolonged exertion [26, 27]. The concurrent nominal upregulation of systemic cAMP within this single case further suggested an individual homeostatic status geared toward enhanced lipid mobilization and fatty acid β-oxidation. Furthermore, whereas circulating lipid messengers such as AEA or 2-AG were not directly captured, because of their low urinary excretion and transient, on-demand enzymatic hydrolysis [28, 29], the exploratory post-exercise rise in systemic testosterone provided a plausible biological rationale, because androgens are documented upregulators of the enzymatic machinery driving endocannabinoid mobilization [30, 31]. The proposed mechanistic integration of these peripheral lipid signaling adaptations and neurotransmitter fluxes is schematically illustrated within our exploratory pathway framework [32, 33] (Figure 4).
Figure 4 Schematic of potential systemic lipid signaling and neurotransmitter fluxes. This literature-informed model represents an exploratory hypothesis based on urinary metabolic variations in the single elite athlete (n = 1). Green and red ovals denote features with uncorrected nominal down- and upregulation, respectively (p <0.05).
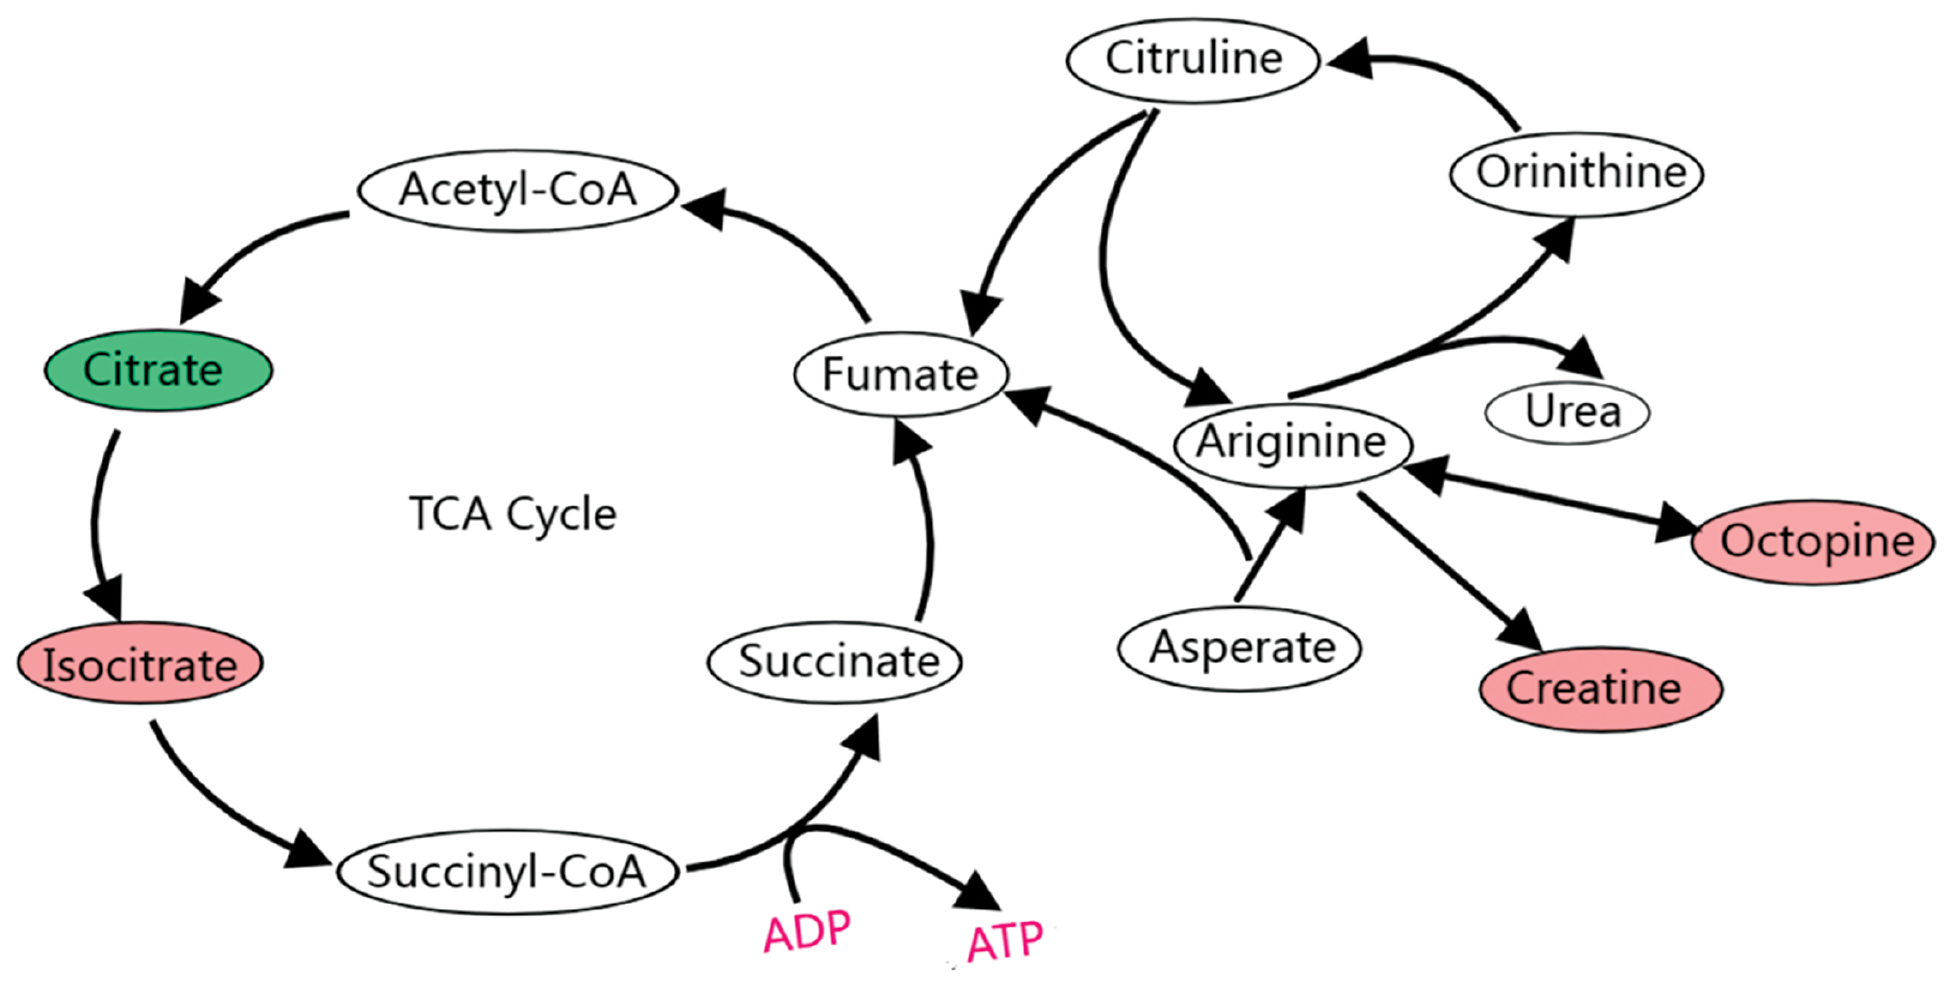
The distinct metabolic divergence captured between the single elite champion and the non-elite cohort was highly reflective of their mismatched competitive histories and training ages. Although the less trained cohort largely relied on immediate carbohydrate and amino acid turnover to satisfy the acute energetic demands of combat simulation (Figure 5), the elite athlete demonstrated a distinct metabolic phenotype characterized by altered lipid pathway mobilization, which might have reflected potential differences in metabolic flexibility. A 17-year elite professional career allows for the development of extensive, chronic physiological adaptations, including expanded mitochondrial volume density, enhanced fatty acid β-oxidation kinetics, and restructured cellular membrane lipid compositions fundamentally differing from those in the collegiate baseline of <10 training years [34]. In contrast, the less trained cohort showed reliance on a classical homeostatic breakdown localized tightly within core bioenergetic pathways, thereby characterizing a high-velocity acute substrate turnover (Figure 5).
Figure 5 Schematic of acute bioenergetic metabolite fluctuations in the non-elite cohort. Nominally altered pathways within the TCA and urea cycles across the non-elite cohort (n = 11) post-exercise. Green and red ovals denote uncorrected nominal down- and upregulation, respectively (p <0.05).
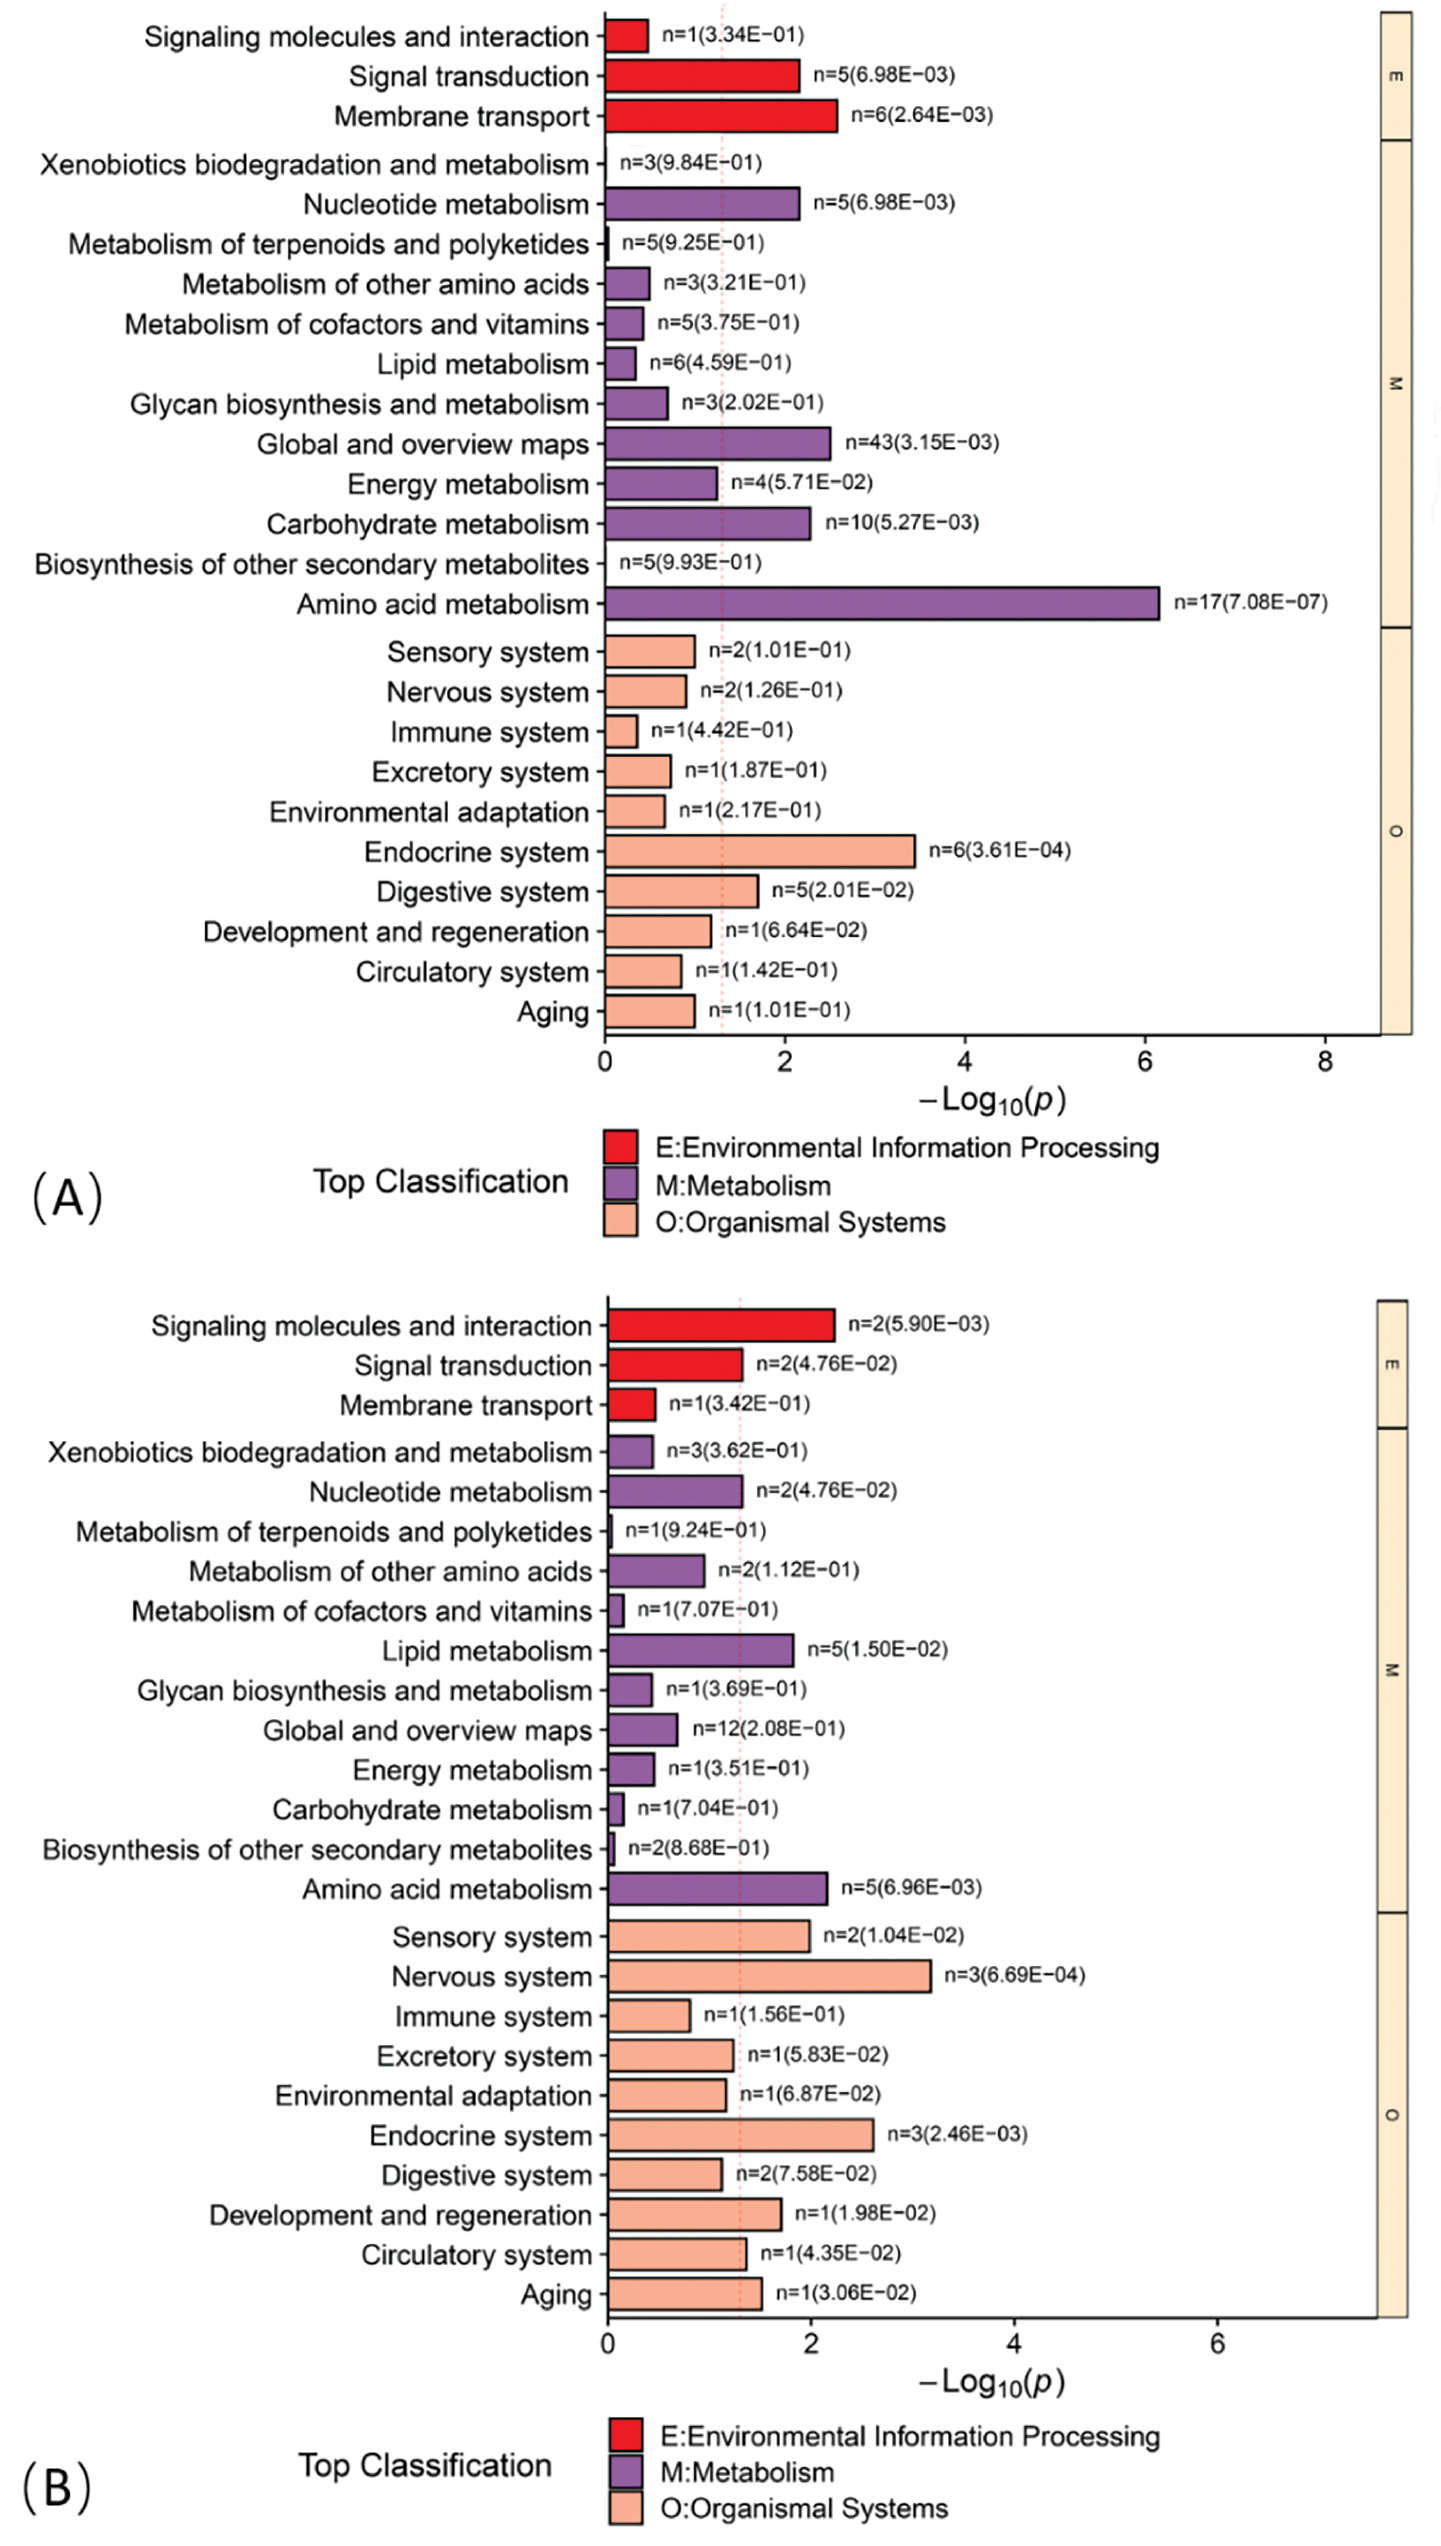
This chronic adaptation hypothesis was further framed by the unique, high-magnitude utilization of specific structural phospholipids, namely PC (16:0/18:2) and PE (18:0/22:6), which exhibited perfect descriptive mathematical separation between the elite athlete and the baseline cohort within our dataset. The post-exercise mobilization of these long-chain polyunsaturated fatty acid species, paired with nominally elevated urinary taurine within the elite athlete, reflected an individual-specific physiological state associated with mitigation of skeletal muscle fatigue, regulation of metabolic acidosis, and maintenance of lipid oxidation under intermittent combat stress [35–38]. Consequently, an extensive cumulative training background provides a plausible physiological explanation for the distinct urinary metabolic signatures observed under identical external workloads. This global divergence in metabolic strategy between chronic adaptation and acute turnover was further substantiated by the structural shift across broader functional pathway hierarchies [39] (Figure 6).
Figure 6 Descriptive profiling of secondary KEGG functional pathway hierarchies. (A) Preliminary secondary pathway distribution for the non-elite cohort (n = 11). (B) Preliminary secondary pathway distribution for the single elite athlete (n = 1). These functional distributions represent uncorrected exploratory observations.
The interpretation of these pilot metabolomic datasets warrants rigorous scientific caution regarding several inherent experimental variables. First, because the elite investigation was fundamentally restricted to a single individual (n = 1), the identified threshold change ratios and candidate lipid features must be treated strictly as hypothesis-generating clues unique to this specific high-performance phenotype. These metrics carry no current statistical validation or diagnostic utility for wide-scale athlete selection or performance forecasting, and any practical application must be deferred until replication in larger, well-matched independent cohorts is achieved. Second, field-based sports metabolomics remains inherently sensitive to residual confounding environmental variations, including minor day-to-day fluctuations in hydration, habitual diet, and circadian variances. Although total peak area normalization and rigorous pre-testing field protocols were applied to mitigate these external forces, the non-clinical field setting is an acknowledged limitation in establishing baseline molecular definitions. Finally, previous literature on world-class athletic metabolomics has indicated that genetic background, physiological structural variations, and distinct ancestral racial lineages can fundamentally alter individual metabolic response profiles to identical physical stressors. Therefore, cross-race applicability is a critical boundary condition, and the preliminary candidate signals extracted from this cohort must be validated within demographically and ethnically matched sports populations to confirm their generalizable biochemical relevance.
Conclusion
This exploratory pilot study provided two distinct methodological and physiological insights into the metabolomic monitoring of Sanda athletes. First, the cross-sectional data from the collegiate cohort successfully captured the generalized bioenergetic signature of acute Sanda training, characterized by conventional phosphagen turnover and carbohydrate catabolism via the TCA cycle. This cohort profile established a stable baseline reference representing the collective homeostatic disruption inherent in high-intensity combat sports workloads. Second, the repeated longitudinal profiling of the single elite champion provided an individual proof of concept demonstrating the technical feasibility of using deep, non-invasive urinary phenotyping to track highly specific metabolic response trajectories in an elite competitor across multiple training days.
The exploratory functional divergence captured in the single elite athlete reflected an idiosyncratic homeostatic status rather than a generalized elite athlete criterion. This individual profile involved predominantly systemic lipid pathway mobilization, nominal γ-aminobutyric acid reduction, and retrograde endocannabinoid signaling clusters. Furthermore, the extensive mathematical separation observed for structural phospholipids, including PC (16:0/18:2), PE (18:0/22:6), and PC (15:0/P-18:1), must be interpreted strictly as case-specific mathematical distances within this restricted dataset, which have no predictive power or diagnostic validity for athlete selection. Given the inherent baseline imbalances in training history and demographic composition between the single elite athlete (n = 1) and the benchmarking cohort, these nominal variations represent preliminary hypothesis-generating clues potentially associated with chronic training-induced phenotype adaptation. Ultimately, these findings reframed individual metabolomic tracking from a generalizable classification framework to a discovery tool for identifying peripheral lipid regulation and signaling networks for future rigorous validation in larger, prospectively matched independent cohorts.
Data availability statement
All data necessary to support the conclusions are included in the article or supplementary materials. The raw data underlying this study may be made available by the corresponding author on reasonable request.
Ethics statement
This study and relevant details were approved by the Ethics Committee at Shanghai University of Sport, China (No. 1027772020RT106). All experiments were performed in accordance with the Declaration of Helsinki and relevant regulations. All participants were adults who provided written informed consent to participate.
Author contributions
Siyan Xu: Data analysis and interpretation, statistical analysis, drafting the manuscript. Jiahui Cheng and Zhen Chen: Data collection, data analysis, manuscript reviewing and editing, and interpretation. Haidong Jiang and Huihui Zhang: Supervision, and manuscript review and editing. Bing Liu: Supervision, manuscript review, and project administration.
Funding
No funding or sponsorship was received for this study.
Conflict of interest
The authors declare that there are no conflicts of interest.
Supplementary materials
Supplementary Material can be downloaded from https://bio-integration.org/wp-content/uploads/2026/08/bioi20260047_Supplemental.zip.
Graphical abstract
Highlights
- Non-invasive urinary metabolomics captured preliminary post-exercise metabolic shifts in Sanda athletes.
- The non-elite cohort showed nominal shifts in core TCA cycle and amino acid pathways.
- Exploratory profiles in an elite champion suggested potential lipid and endocannabinoid signaling involvement.
- PC (16:0/18:2), PE (18:0/22:6), and PC (15:0/P-18:1) served as candidate features warranting future validation in larger cohorts.
In brief
This research was aimed at identifying metabolic signatures distinguishing athletes of different levels, and elucidating the underlying biological mechanisms, on the basis of the importance of metabolic adaptations for sport performance. The screened biomarkers, PC (16:0/18:2), PE (18:0/22:6), and PC (15:0/P-18:1), presented high area under the curve (AUC), sensitivity (SE), and specificity (SP) values and therefore have potential to accurately distinguish between average and elite Sanda athletes.
References
- Contrepois K, Wu S, Moneghetti KJ, Hornburg D, Ahadi S, et al. Molecular choreography of acute exercise. Cell 2020;181(5):1112-30.e22. [PMID: 32470399 DOI: 10.1016/j.cell.2020.04.043]
- Chaabène H, Hachana Y, Franchini E, Mkaouer B, Chamari K. Physical and physiological profile of elite karate athletes. Sports Med 2012;42(10):829-43. [PMID: 22901041 DOI: 10.1007/BF03262297]
- Bongiovanni T, Pintus R, Dessì A, Noto A, Sardo S, et al. Sportomics: metabolomics applied to sports. The new revolution? Eur Rev Med Pharmacol Sci 2019;23(24):11011-9. [PMID: 31858572 DOI: 10.26355/eurrev_201912_19807]
- San-Millán I, Brooks GA. Assessment of metabolic flexibility by means of measuring blood lactate, fat, and carbohydrate oxidation responses to exercise in professional endurance athletes and less-fit individuals. Sports Med 2018;48(2):467-79. [PMID: 28623613 DOI: 10.1007/s40279-017-0751-x]
- Al-Khelaifi F, Diboun I, Donati F, Botré F, Alsayrafi M, et al. A pilot study comparing the metabolic profiles of elite-level athletes from different sporting disciplines. Sports Med Open 2018;4(1):2. [PMID: 29305667 DOI: 10.1186/s40798-017-0114-z]
- Monnerat G, Sánchez CAR, Santos CGM, Paulucio D, Velasque R, et al. Different signatures of high cardiorespiratory capacity revealed with metabolicomic profiling in elite athletes. Int J Sport Physiol Perform 2020;15(8):1156-67. [PMID: 32335533 DOI: 10.1123/ijspp.2019-0267]
- Mourtakos S, Vassiliou G, Kontoangelos K, Philippou A, Tzavellas E, et al. Endocannabinoids and heart rate variability alterations after exposure to prolonged intensive physical exercise of the Hellenic Navy SEALs. Int J Environ Res Public Health 2022;19(1):28. [PMID: 35010291 DOI: 10.3390/ijerph19010028]
- Gorzkiewicz A, Szemraj J. Brain endocannabinoid signaling exhibits remarkable complexity. Brain Res Bull 2018;142:33-46. [PMID: 29953913 DOI: 10.1016/j.brainresbull.2018.06.012]
- Noriega-Prieto JA, Kofuji P, Araque A. Endocannabinoid signaling in synaptic function. Glia 2023;71(1):36-43. [PMID: 36408881 DOI: 10.1002/glia.24256]
- Cristino L, Becker T, Di Marzo V. Endocannabinoids and energy homeostasis: an update. BioFactors 2014;40(4):389-97. [PMID: 24752980 DOI: 10.1002/biof.1168]
- Pardridge WM, Triguero D, Buciak JL. β-Endorphin chimeric peptides: transport through the blood-brain barrier in vivo and cleavage of disulfide linkage by brain. Endocrinology 1990;126(2):977-84. [PMID: 2137082 DOI: 10.1210/endo-126-2-977]
- Banks WA. The blood-brain barrier as an endocrine tissue. Nat Rev Endocrinol 2019;15(8):444-55. [PMID: 31127254 DOI: 10.1038/s41574-019-0213-7]
- Siebers M, Biedermann SV, Bindila L, Lutz B, Fuss J. Exercise-induced euphoria and anxiolysis do not depend on endogenous opioids in humans. Psychoneuroendocrinology 2021;126:105173. [PMID: 33582575 DOI: 10.1016/j.psyneuen.2021.105173]
- Koltyn KF, Brellenthin AG, Cook DB, Sehgal N, Hillard C. Mechanisms of exercise-induced hypoalgesia. J Pain 2014;15(12):1294-304. [PMID: 25261342 DOI: 10.1016/j.jpain.2014.09.006]
- Zou S, Kumar U. Cannabinoid receptors and the endocannabinoid system: signaling and function in the central nervous system. Int J Mol Sci 2018;19(3):833. [PMID: 29533978 DOI: 10.3390/ijms19030833]
- Kaczocha M, Haj-Dahmane S. Mechanisms of endocannabinoid transport in the brain. Br J Pharmacol 2022;179(17):4300-10. [PMID: 33786823 DOI: 10.1111/bph.15469]
- Meyer JD, Crombie KM, Cook DB, Hillard CJ, Koltyn KF. Serum endocannabinoid and mood changes after exercise in major depressive disorder. Med Sci Sports Exerc 2019;51(9):1909-17. [PMID: 30973483 DOI: 10.1249/MSS.0000000000002006]
- Cai M, Wu C, Jing C, Shen X, He M, et al. Blood metabolomics analysis identifies differential serum metabolites in elite and sub-elite swimmers. Front Physiol 2022;13:858869. [PMID: 35600307 DOI: 10.3389/fphys.2022.858869]
- Hargreaves M, Spriet LL. Skeletal muscle energy metabolism during exercise. Nat Metab 2020;2(9):817-28. [PMID: 32747792 DOI: 10.1038/s42255-020-0251-4]
- Singh V, Kushwaha R. Decoding the circulating proteome: matrix and immune context markers shape early multi-cancer detection. bioRxiv 2025. [DOI: 10.1101/2025.11.10.687473]
- San-Millán I, Stefanoni D, Martinez JL, Hansen KC, D’Alessandro A, et al. Metabolomics of endurance capacity in World Tour professional cyclists. Front Physiol 2020;11:578. [PMID: 32581847 DOI: 10.3389/fphys.2020.00578]
- Rubin M. When to adjust alpha during multiple testing: a consideration of disjunction, conjunction, and individual testing. Synthese 2021;199(3-4):10969-1000. [DOI: 10.1007/s11229-021-03276-4]
- Broadhurst DI, Kell DB. Statistical strategies for avoiding false discoveries in metabolomics and related experiments. Metabolomics 2006;2(4):171-96. [DOI: 10.1007/s11306-006-0037-z]
- Mukherjee K, Edgett BA, Burrows HW, Castro C, Griffin JL, et al. Whole blood transcriptomics and urinary metabolomics to define adaptive biochemical pathways of high-intensity exercise in 50-60 year old masters athletes. PLoS One 2014;9(3):e92031. [PMID: 24643011 DOI: 10.1371/journal.pone.0092031]
- Khoramipour K, Sandbakk Ø, Keshteli AH, Gaeini AA, Wishart DS, et al. Metabolomics in exercise and sports: a systematic review. Sports Med 2022;52(3):547-83. [PMID: 34716906 DOI: 10.1007/s40279-021-01582-y]
- Rakotoarivelo V, Sihag J, Flamand N. Role of the endocannabinoid system in the adipose tissue with focus on energy metabolism. Cells 2021;10(6):1279. [PMID: 34064024 DOI: 10.3390/cells10061279]
- Dubreucq S, Durand A, Matias I, Bénard G, Richard E, et al. Ventral tegmental area cannabinoid type-1 receptors control voluntary exercise performance. Biol Psychiatry 2013;73(9):895-903. [PMID: 23237313 DOI: 10.1016/j.biopsych.2012.10.025]
- Colmers PLW, Bains JS. Presynaptic mGluRs control the duration of endocannabinoid-mediated DSI. J Neurosci 2018;38(49):10444-53. [PMID: 30355625 DOI: 10.1523/JNEUROSCI.1097-18.2018]
- Ahn K, McKinney MK, Cravatt BF. Enzymatic pathways that regulate endocannabinoid signaling in the nervous system. Chem Rev 2008;108(5):1687-707. [PMID: 18429637 DOI: 10.1021/cr0782067]
- Vickstrom CR, Liu X, Liu S, Hu MM, Mu L, et al. Role of endocannabinoid signaling in a septohabenular pathway in the regulation of anxiety- and depressive-like behavior. Mol Psychiatry 2021;26(7):3178-91. [PMID: 33093652 DOI: 10.1038/s41380-020-00905-1]
- Conde K, Fabelo C, Krause WC, Propst R, Goethel J, et al. Testosterone rapidly augments retrograde endocannabinoid signaling in proopiomelanocortin neurons to suppress glutamatergic input from steroidogenic factor 1 neurons via upregulation of diacylglycerol lipase-α. Neuroendocrinology 2017;105(4):341-56. [PMID: 27871072 DOI: 10.1159/000453370]
- Kanehisa M, Goto S. KEGG: Kyoto encyclopedia of genes and genomes. Nucleic Acids Res 2000;28(1):27-30. [PMID: 10592173 DOI: 10.1093/nar/28.1.27]
- Kanehisa M, Furumichi M, Sato Y, Matsuura Y, Ishiguro-Watanabe M. KEGG: biological systems database as a model of the real world. Nucleic Acids Res 2025;53(D1):D672-7. [PMID: 39417505 DOI: 10.1093/nar/gkae909]
- Jaguri A, Al Thani AA, Elrayess MA. Exercise metabolome: insights for health and performance. Metabolites 2023;13(6):694. [PMID: 37367852 DOI: 10.3390/metabo13060694]
- Jong CJ, Sandal P, Schaffer SW. The role of taurine in mitochondria health: more than just an antioxidant. Molecules 2021;26(16):4913. [PMID: 34443494 DOI: 10.3390/molecules26164913]
- De Carvalho FG, Barbieri RA, Carvalho MB, Dato CC, Campos EZ, et al. Taurine supplementation can increase lipolysis and affect the contribution of energy systems during front crawl maximal effort. Amino Acids 2018;50(1):189-98. [PMID: 29082444 DOI: 10.1007/s00726-017-2505-3]
- Schaffer SW, Shimada-Takaura K, Jong CJ, Ito T, Takahashi K. Impaired energy metabolism of the taurine-deficient heart. Amino Acids 2016;48(2):549-58. [PMID: 26475290 DOI: 10.1007/s00726-015-2110-2]
- Kurtz JA, VanDusseldorp TA, Doyle JA, Otis JS. Taurine in sports and exercise. J Int Soc Sports Nutr 2021;18(1):39. [PMID: 34039357 DOI: 10.1186/s12970-021-00438-0]
- Cole LK, Vance JE, Vance DE. Phosphatidylcholine biosynthesis and lipoprotein metabolism. Biochim Biophys Acta 2012;1821(5):754-61. [PMID: 21979151 DOI: 10.1016/j.bbalip.2011.09.009]