


Section Discrepancy and Diagnostic Performance of Breast Lesions in Two-dimensional Ultrasound by Dynamic Videos versus Static Images
1Department of Ultrasound, Sun Yat-Sen Memorial Hospital of Sun Yat-Sen University, Guangzhou, Guangdong 510120, P.R. China
aBoth authors contributed equally to the study.
*Correspondence to: Baoming Luo, E-mail: luobm@mail.sysu.edu.cn; and Qiongchao Jiang, E-mail: jiangqch3@mail.sysu.edu.cn
Received: July 15 2021; Revised: October 18 2021; Accepted: December 1 2021; Published Online: December 30 2021
Cite this paper:
Dinghong Yang, Xiaoyun Xiao, Haohu Wang, Huan Wu, Wei Qin, Xiaofeng Guan, Qiongchao Jiang and Baoming Luo. Section Discrepancy and Diagnostic Performance of Breast Lesions in Two-dimensional Ultrasound by Dynamic Videos versus Static Images. BIO Integration 2022; 3(2): 61–70.
DOI: 10.15212/bioi-2021-0021. Available at: https://bio-integration.org/
Download citation 
© 2022 The Authors. This is an open access article distributed under the terms of the Creative Commons Attribution License (https://creativecommons.org/licenses/by/4.0/). See https://bio-integration.org/copyright-and-permissions/
Abstract
Background: Benign or malignant breast lesions with typical ultrasonic characteristics could be easily and correctly diagnosed with two-dimensional ultrasound (2D US). However, diagnosis of atypical lesions remains a challenge. Most atypical lesions have different ultrasonographic features with probe direction variation. Thus, the interpretation of ultrasonographic features based on static images empirically collected by sonographers might be inaccurate. We aimed to investigate the section discrepancy and diagnostic performance of breast lesions in 2D US by dynamic videos versus static images.
Methods: Static images and dynamic videos based on two perpendicular planes of 468 breast lesions were collected and evaluated. The Breast Imaging and Reporting Data System (BI-RADS®) US lexicon was used. Category 3 was used as the cut-off point, and section discrepancy was defined as two perpendicular planes showing different BI-RADS categories (3 versus 4A, 4B, 4C, and 5).
Results: This retrospective study included 315 benign and 153 malignant lesions. There were 53 and 50 lesions with section discrepancy during static and dynamic observations, respectively. The proportion of benign lesions with section discrepancy was significantly higher than that of malignant lesions (P < 0.05) either in dynamic or static observation, and the contingency coefficient was 0.2 between section discrepancy and histopathology. Duct changes were more clearly depicted in dynamic videos than in static images (P < 0.05) both in malignant and benign lesions. Calcification and architectural distortion were more sensitively detected by dynamic videos than with static images (P < 0.05) in malignant lesions. The interpretation of “margin” significantly differed in benign lesions between static images and dynamic videos (P < 0.05). The areas under the curve of static image-horizontal, static image-sagittal, dynamic video-horizontal, and dynamic video-sagittal were 0.807, 0.820, 0.837, and 0.846, respectively. The specificities of dynamic videos were higher than those of static images (P < 0.05).
Conclusion: Breast lesions have section discrepancy in 2D US. Observations based on dynamic videos could more accurately reflect lesion features and increase the specificity of US in the differentiation of atypical breast lesions.
Keywords
Breast, ultrasound, ultrasonography, diagnosis, BI-RADS.
Introduction
Breast cancer has become the most common cancer in women in the latest data of global cancer [1]. The 5-year survival rate of breast cancer patients varied significantly with stage of initial diagnosis (98% for stage I and 27% for stage IV) [2]. Thus, early detection of breast cancer is crucial [3]. Ultrasound (US) has been one of the most widely used modalities for breast cancer diagnosis owing to it being noninvasive and nonradiative, convenient, and cost-effective [4]. In addition, to narrow variability in characterization and final assessment of breast lesions identified on ultrasonography, the Breast Imaging Report and Data System (BI-RADS®) proposed by the American College of Radiology (ACR) unified and standardized the US lexicon and classification [5].
US could assess the morphologies, orientations, internal structures, and margins of lesions from multiple planes with high resolution both in predominantly fatty breasts and in dense glandular structures [6]. However, sonographic manifestations of the lesions varied in different sections due to different growth patterns of the lesions and the influences of surrounding tissue compositions [7]. For example, ductal carcinoma in situ (DCIS) was reported to grow faster in the radial direction than in the anti-radial plane [8]. The visualizations of handheld US images commonly used as documentation usually depended on the information collected in one certain orientation, which was empirically selected by the operator [9]. Thus, the features of lesions reflected only in the static images were likely to be inaccurate. Besides, the examiner could gain important information about surrounding tissue characteristics of the lesions by dynamic US scanning. This information, however, was likely incomplete when the lesion was documented as static images.
In theory, these shortcomings of static image documentation could be overcome by recording the breast lesion as videos [10]. To date, there had been only two studies comparing video and static images of breast lesions with respect to sonographic assessment and diagnostic performance. An article reported that the echogenic halo, orientation, and margin varied while comparing video and static images [11]. Meanwhile, another study showed that the inter-observer variability and diagnostic performance of video clips were similar to those of static images [12]. Thus, whether dynamic observation is superior to static observation needs further study.
Regarding the possible discrepancy ultrasonographic features in different sections of the lesions, we hypothesized that the benign and malignant tendencies of the lesions probably were not consistent when lesions were viewed in different directions. Previous studies found that the results of the quantitative evaluation of breast magnetic resonance imaging and elastography in different directions were different for some atypical lesions, especially malignant lesions. The role of section discrepancy was also explored in the identification of benign and malignant lesions using elastography [13–16]. Nevertheless, whether this rule was applicable in 2D US remains to be studied.
To the best of our knowledge, there was no research comparing diagnostic performance and consistency of dynamic videos and static images between different sections. Therefore, the purposes of this study were to investigate if there were section discrepancy in 2D US and to investigate the diagnostic performance of 2D US based on dynamic videos and static images of breast lesions.
Materials and methods
Patients
The institutional review board approved this retrospective study, and the requirement for informed consent was waived. From September 2018 to April 2020, 723 consecutive women scheduled for breast surgery underwent breast US examinations. The inclusion criteria were presence of a solid mass that occupied space and could be detected in two perpendicular planes with US and available final pathology. The exclusion criteria are presented in Figure 1. Finally, 449 women with 468 breast lesions were included in the study.
Figure 1 Flow chart of patient selection.

Image acquisition
All examinations were performed using the US device Oxana2 (ACUSON Oxana Series; Siemens, Munich, Germany). The frequency range of the probe was 6-12 MHz. All the examinations were performed by the same doctor, who have more than 15 years of experience in breast US. For each lesion, at least three static images were obtained: two representative two-dimensional (2D) static images in two perpendicular planes (horizontal and sagittal) and an image with marked maximum diameter and depth of the lesion. Two corresponding real-time scans of the breast lesion based on horizontal and sagittal planes were collected. The scan range of each video was from “normal glandular tissue–lesion emergence–lesion complete display–lesion disappearance–normal glandular tissue.” Each dynamic videos lasted for about 10 seconds. All the static images and dynamic videos were saved for further analysis.
Image evaluation
Independent and blinded image evaluation were performed by two observers with 15 and 3 years of breast sonography experience, respectively. All the data were verified, and any conflict was resolved by consensus. For lesion assessment, the Breast Imaging and Reporting Data System (BI-RADS®) US lexicon [5] was used. Suspicious US features were defined based on previous studies and the criteria for BI-RADS 4 subcategorization were established according to Li’s research [17]. Suspicious 2D characteristics were divided into malignant and auxiliary malignant signs. Malignant signs included irregular shape, nonparallel orientation, non-circumscribed margin (indistinct, spiculated, microlobulated, or angular), posterior shadowing, microcalcification in the mass, and intraductal calcification. Auxiliary malignant signs included round shape, hypoechoic, abundant blood flow signal, and architectural distortion [18–21]. Category 5 was defined as lesions with at least three malignant signs or two malignant signs plus two or more auxiliary malignant signs. Category 4C was defined as lesions with two malignant signs with or without one auxiliary malignant sign. Category 4B was defined as lesions with one malignant sign and two or more auxiliary malignant signs. Category 4A was defined as lesions with one malignant sign plus one auxiliary malignant sign or with two or more auxiliary malignant signs without any malignant sign. A hypoechoic lesion without any suspicious signs was defined as category 3. Category 3 was used as the cut-off point in this study according to the different clinical management because tissue diagnosis was recommended for category ≥4 by ACR BI-RADS. Therefore, lesions with categories 3 were considered benign; lesions with categories 4A, 4B, 4C, or 5 were considered malignant in the study. If both sections of a lesion showed the same character (benign or malignant), no section difference was defined. If the two planes of a lesion showed different character, section difference was defined.
Statistical analysis
Receiver operating characteristics (ROC) curves were constructed, and the areas under the ROC curves (AUCs) were compared to evaluate the diagnostic efficacies of 2D static images and dynamic videos [22]. Sensitivity, specificity, accuracy, positive predictive value, and negative predictive value were calculated separately using category 3 as the cut-off point. Chi-square test was used to check whether these indicators were different. To evaluate the variations of different sections in lesion description (US features) and assessment (BI-RADS® categories), Pearson’s chi-square test or Fisher’s exact test, where appropriate, was used to analyze these categorical data. The contingency coefficient was used for correlation analysis of disordered classification variable. Chi-square test was used to analyze the difference of categorical variables, whereas t test was used to analyze the difference of continuous variables. P < 0.05 was considered statistically significant. All data were analyzed with the SPSS version 20.0 (IBM Corp., Armonk, NY, USA) and MedCalc version 19.3 (MedCalc, Mariakerke, Belgium).
Results
Patients and lesions characteristics
In total, 449 patients (mean age, 42.8 ± 12.7 years; range, 14–88 years) with 468 breast lesions were included. Of 449 patients, 200 (42.7%) were younger than 40 years, whereas 249 (57.3%) were 40 years or older. There were 315 benign lesions and 153 malignant lesions. The lesion sizes ranged from 3.7 to 38.0 mm (mean, 13.7 ± 6.2 mm). The pathological results of the lesions are summarized in Table 1.
Table 1 Pathology of the Lesions
| Benign | 315 (67.3) | Malignant | 153 (32.6) |
| Fibroadenoma | 168 (53.3) | Invasive ductal carcinoma | 107 (69.9) |
| Fibrocystic disease | 92 (29.2) | Ductal carcinoma in situ | 13 (8.4) |
| Intraductal papilloma | 29 (9.2) | Papillary carcinoma | 9 (5.8) |
| Benign phyllodes tumor | 7 (2.2) | Invasive lobular carcinoma | 6 (3.9) |
| Inflammation | 8 (2.5) | Atypical hyperplasia | 9 (5.8) |
| Sclerotic lesions of the breast | 8 (2.5) | Lobular carcinoma in situ | 3 (1.9) |
| Others | 3 (0.9) | Others | 6 (3.9) |
Values are presented as number (percentage).
Section discrepancy of 2D US in static images and dynamic videos
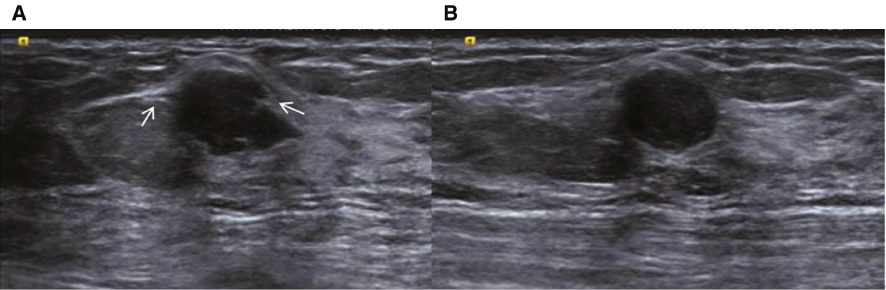
The BI-RADS classifications were evaluated by two sonographers based on the 2D characteristics of the lesions depicted in static images and dynamic videos (Table 2). In our study, there were some lesions with section discrepancy (Figure 2). Sectional differences were detected in 53 (11.3%) lesions by static observation and in 50 (10.7%) lesions by dynamic observation. We found no statistically significant difference in the proportion of lesions with section discrepancy between dynamic and static observations (P > 0.05), but in the results of the two observation methods, the lesions with section discrepancy were incompletely matching.
Table 2 Distribution of Breast Imaging and Reporting Data System Classification of All Lesions in Static Images and Dynamic Videos
| A | |||||||||||||
|---|---|---|---|---|---|---|---|---|---|---|---|---|---|
| Static images | Dynamic videos | ||||||||||||
| B | 3 | 4A | 4B | 4C | 5 | T | 3 | 4A | 4B | 4C | 5 | T | |
| 3 | 89 | 31 | 1 | 0 | 0 | 121 | 186 | 16 | 2 | 2 | 1 | 207 | |
| 4A | 21 | 136 | 7 | 2 | 1 | 167 | 17 | 61 | 6 | 4 | 2 | 90 | |
| 4B | 0 | 9 | 56 | 7 | 1 | 73 | 5 | 12 | 26 | 10 | 0 | 53 | |
| 4C | 0 | 4 | 10 | 53 | 7 | 74 | 7 | 2 | 8 | 53 | 9 | 79 | |
| 5 | 0 | 0 | 3 | 8 | 22 | 33 | 0 | 1 | 0 | 14 | 24 | 39 | |
| T | 110 | 180 | 77 | 70 | 31 | 468 | 215 | 92 | 42 | 83 | 36 | 468 | |
A represents the horizontal plane, and B represents the sagittal plane.
Bold font represents the opposite classification nature.
Figure 2 A hypoechoic lesion located at 10’o clock in the left breast of a 25-year-old woman (A) Plane horizonal: the lesion is irregular and microlobulated (as pointed by the arrow), categorized as BIRADS 4C. (B) Plane sagittal: the lesion is oval and smooth, categorized as BIRADS 3. The final pathology was fibrocystic disease.
Correlation between the section discrepancy and histopathology
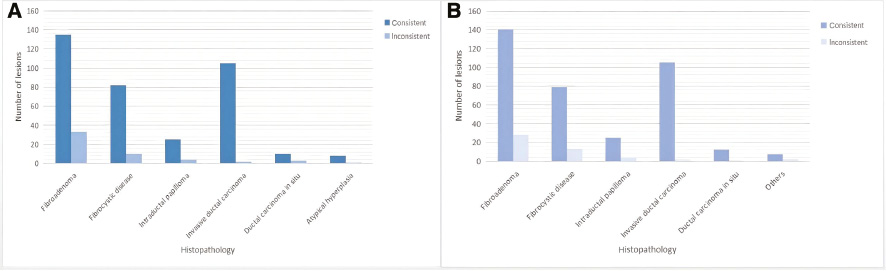
Either in static images or by dynamic videos, benign lesions were more likely to show section discrepancy than malignant lesions (P < 0.05). As presented in Figure 3, the probabilities of section discrepancy in fibroadenoma, fibrocystic breast disease, and intraductal papilloma were significantly higher than other pathological types (P < 0.05). In malignant lesions, DCIS was more likely to show section discrepancy than other pathological types (P < 0.05). Finally, a value of 0.2 (P < 0.05) was obtained when the contingency coefficient was calculated for the correlation between section discrepancy and histopathology either in dynamic or static observation.
Figure 3 (A) The pathological distribution of lesions with section discrepancy by static observation. (B) The pathological distribution of lesions with section discrepancy by dynamic observation.
Sonographic features differences between static images versus dynamic videos
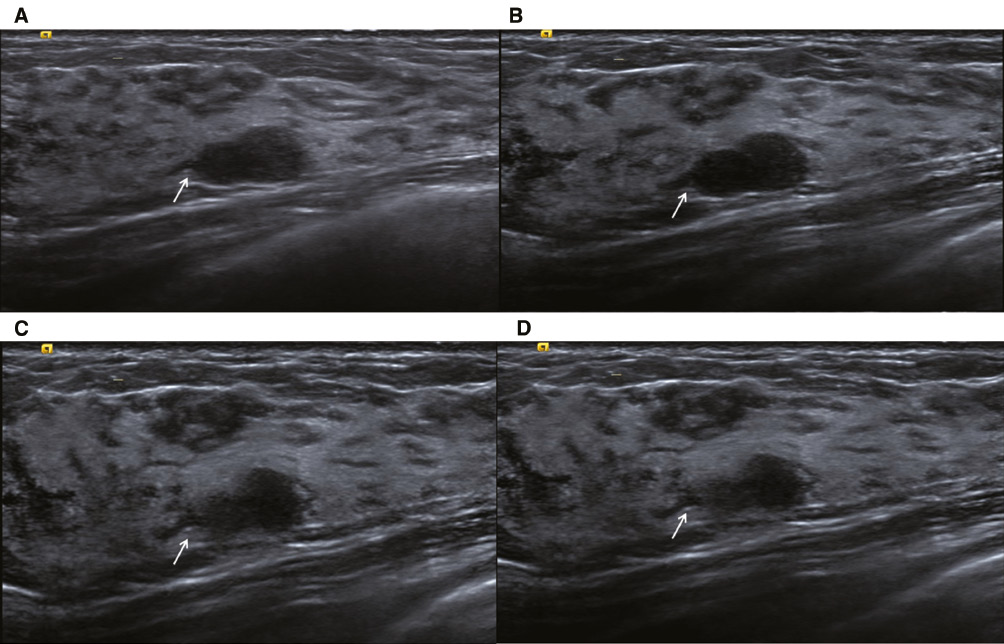
The sonographic features of 468 lesions assessed both in static images and dynamic videos are summarized in Tables 3 and 4. Duct changes were more clearly depicted in dynamic videos than in static images (P < 0.05) both in malignant and benign lesions. Calcification and architectural distortion were more sensitively detected by dynamic videos than by static images (P < 0.05) in malignant lesions (Figures 4 and 5). The interpretation of “margin” significantly differed in benign lesions between static images and dynamic videos (P < 0.05). More benign lesions displayed smooth edge in dynamic videos. On the contrary, they were more easily characterized as microlobulated or angular in static images (Figure 6).
Table 3 Sonographic Features of Benign Lesions (static images versus dynamic videos)
| Ultrasonic characteristics | Benign (n = 315) | ||||||
|---|---|---|---|---|---|---|---|
| Static A | Dynamic A | P | Static B | Dynamic B | P | ||
| Shape | Oval | 246 | 259 | 0.426 | 235 | 248 | 0.487 |
| Circular | 18 | 14 | 28 | 24 | |||
| Irregular | 51 | 42 | 52 | 43 | |||
| Orientation | Parallel | 274 | 285 | 0.207 | 268 | 271 | 0.734 |
| Non-parallel | 41 | 30 | 47 | 44 | |||
| Margin | Smooth | 180 | 261 | 0.000* | 197 | 261 | 0.000 |
| Microlobulated | 84 | 44 | 75 | 45 | |||
| Angular | 9 | 5 | 9 | 2 | |||
| Spiculated | 1 | 0 | 1 | 0 | |||
| Indistinct | 44 | 8 | 36 | 8 | |||
| Echo pattern | Hypoechoic | 293 | 280 | 0.340 | 289 | 288 | 0.876 |
| Isoechoic | 2 | 5 | 3 | 3 | |||
| Complexa | 6 | 9 | 5 | 8 | |||
| Heterogeneousb | 14 | 21 | 18 | 16 | |||
| Posterior features | Combined pattern | 7 | 6 | 0.880 | 7 | 8 | 0.942 |
| Enhancement | 65 | 61 | 66 | 68 | |||
| Shadowing | 0 | 0 | 1 | 2 | |||
| Indifferent | 243 | 248 | 241 | 237 | |||
| Calcifications | Not present | 295 | 287 | 0.323 | 297 | 283 | 0.061 |
| Within lesion | 20 | 26 | 18 | 30 | |||
| Outside lesion | 0 | 1 | 0 | 1 | |||
| Intraductal | 0 | 1 | 0 | 1 | |||
| Surrounding tissue changes | Architectural distortion | 2 | 2 | – | 2 | 2 | – |
| Duct changes | 40 | 94 | 0.000 | 40 | 92 | 0.000 | |
| Edema | 0 | 0 | – | 0 | 0 | – | |
| Skin thickening | 3 | 3 | – | 2 | 3 | – | |
| Skin retraction | 0 | 0 | – | 0 | 0 | – | |
A represents the horizontal plane, and B represents the sagittal plane.
aContains both anechoic (cystic or fluid) and echogenic (solid) components.
bA mixture of echogenic patterns within a solid mass.
*P-values in bold face are statistically different; “–” represents not applicable.
Table 4 Sonographic Features of Malignant Lesions (Static Images versus Dynamic Videos)
| Ultrasonic characteristics | Malignant (n = 153) | ||||||
|---|---|---|---|---|---|---|---|
| Static A | Dynamic A | P | Static B | Dynamic B | P | ||
| Shape | Oval | 50 | 49 | 0.683 | 41 | 41 | 0.979 |
| Circular | 15 | 11 | 14 | 13 | |||
| Irregular | 88 | 93 | 98 | 99 | |||
| Orientation | Parallel | 107 | 111 | 0.613 | 102 | 104 | 0.807 |
| Non-parallel | 46 | 42 | 51 | 49 | |||
| Margin | Smooth | 29 | 41 | 0.549 | 18 | 31 | 0.076 |
| Microlobulated | 92 | 98 | 90 | 102 | |||
| Angular | 13 | 17 | 12 | 18 | |||
| Spiculated | 3 | 3 | 1 | 5 | |||
| Indistinct | 45 | 37 | 54 | 41 | |||
| Echo pattern | Hypoechoic | 132 | 133 | 0.723 | 133 | 132 | 0.830 |
| Isoechoic | 0 | 0 | 0 | 0 | |||
| Complexa | 5 | 7 | 5 | 7 | |||
| Heterogeneousb | 16 | 13 | 15 | 14 | |||
| Posterior features | Combined pattern | 7 | 13 | 0.508 | 11 | 13 | 0.740 |
| Enhancement | 38 | 40 | 48 | 43 | |||
| Shadowing | 8 | 6 | 4 | 7 | |||
| Indifferent | 100 | 94 | 90 | 90 | |||
| Calcifications | Not present | 134 | 117 | 0.011 | 135 | 119 | 0.015 |
| Within lesion | 19 | 36 | 18 | 34 | |||
| Outside lesion | 0 | 0 | 0 | 0 | |||
| Intraductal | 0 | 0 | 0 | 0 | |||
| Surrounding tissue changes | Architectural distortion | 9 | 22 | 0.014 | 12 | 24 | 0.033 |
| Duct changes | 15 | 64 | 0.000* | 22 | 59 | 0.000 | |
| Edema | 0 | 0 | – | 0 | 0 | – | |
| Skin thickening | 2 | 2 | – | 3 | 2 | – | |
| Skin retraction | 0 | 0 | – | 0 | 0 | – | |
A represents the horizontal plane, and B represents the sagittal plane.
*P-values in bold: represents statistically different; “–” represents not applicable.
aContains both anechoic (cystic or fluid) and echogenic (solid) components.
bA mixture of echogenic patterns within a solid mass.
Figure 4 (A) A hypoechoic lesion at 10’o clock in the right breast of a 44-year-old woman. (B) On static observation, the edges of the lesion appear to be either in the blue box or in the red box, making it difficult to define the presence of “calcification” (as shown by arrow) inside or outside the lesion.
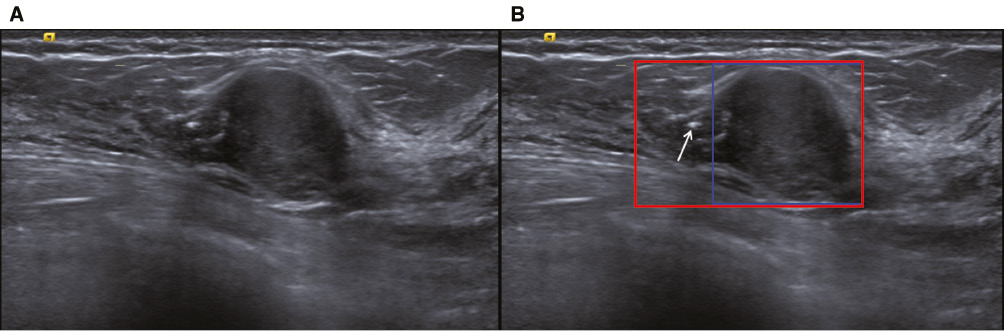
Figure 5 The time point screenshot of the dynamic video of the lesion shown in Figure 4. With the scanning of the probe, the shape, orientation and edge of the lesion were changing (as shown in the blue box), and calcification was observed both inside and outside the lesion (as shown by the arrow).
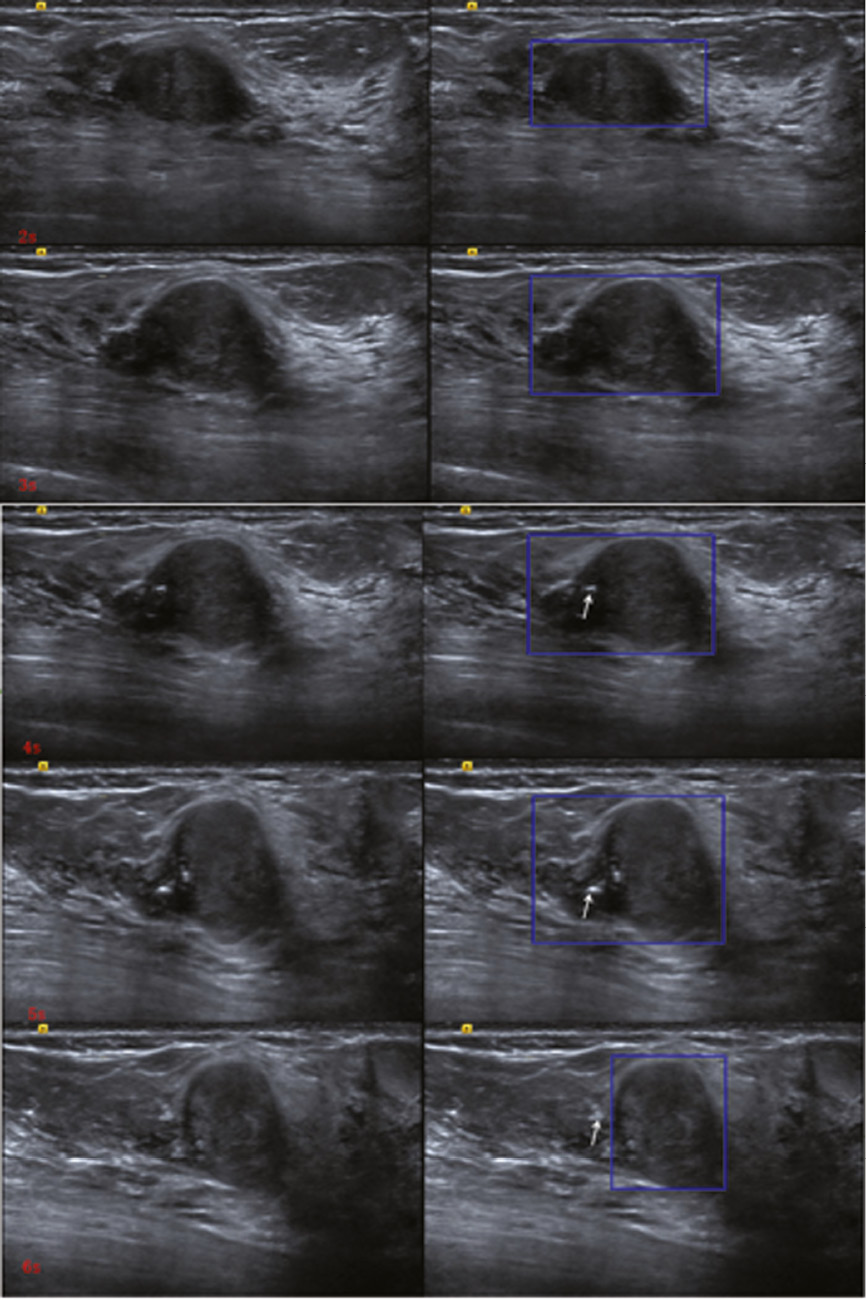
Figure 6 (A) A static image of the detected lesion displayed the feature “margin” for “angular” (as shown by the arrow). (B), (C), and (D) Dynamic video screenshots of the lesions shown in figure (A); the “angular margin” was actually glandular duct (as shown by the arrow).
Diagnostic performance of breast lesions at 2D US by dynamic videos versus static images
The AUC-ROC of dynamic videos were slightly higher than those of the static images (Figure S1). The AUC values of static image-horizontal, static image-sagittal, dynamic video-horizontal, and dynamic video-sagittal were 0.807, 0.820, 0.837, and 0.846, respectively (Table 5). Only the AUC values of static image-horizontal and dynamic videos-horizontal were significantly different (P = 0.026). As for specificity and accuracy, dynamic videos were higher than those of static images (P < 0.05). Dynamic observation had a similar sensitivity to static observation (P > 0.05). The consistency of dynamic and static observations between two sonographers had been showed in Supplementary Table 1.
Table 5 Diagnostic Performance of 2D Ultrasound According to the BI-RADS® Categories
| AUC | 95% Confidence interval | Sensitivity (%) | Specificity (%) | Accuracy (%) | PPV | NPV | |
|---|---|---|---|---|---|---|---|
| Static image A | 0.807 | 0.769–0.842 | 96.7 | 33.3 | 54.1 | 41.0 | 95.0 |
| Dynamic video A | 0.837a | 0.801–0.870 | 88.9 | 62.8a | 71.4a | 54.0 | 92.0 |
| Static image B | 0.820 | 0.782–0.854 | 96.7 | 36.8 | 56.4 | 43.0 | 96.0 |
| Dynamic video B | 0.846 | 0.810–0.878 | 90.2 | 60.9a | 70.5a | 53.0 | 92.0 |
A represents the horizontal plane, and B represents the sagittal plane.
aThe diagnostic efficacies based on static images and dynamic videos were statistically different.
BI-RADS, Breast Imaging and Reporting Data System; AUC, area under the curve; PPV, positive predictive value; NPV, negative predictive value.
Effects of breast tissue composition, lesion size, and depth on two observation methods
Based on breast tissue composition, the background echotextures were divided into fat type, fibroglandular type, and heterogeneous type. As shown in Figure S2, compared with the consistent and inconsistent groups of dynamic and static observation results, there was no significant difference among the different background echotextures (P > 0.05). There was significant difference in lesion sizes between the two groups (P < 0.05). Most of the lesions in the inconsistent group were around 10 mm in the maximal diameter. As for lesion depth, there was no significant effect on the consistency of the dynamic and static observations (P > 0.05).
Discussion
Most atypical lesions appeared different ultrasonographic features with probe direction variation. The interpretation of ultrasonographic features was mainly based on typical images collected by sonographers. The selection of representative static images affected the final category of the lesions. Therefore, we investigated the section discrepancy and diagnostic performance of breast lesions in 2D US by dynamic videos versus static images.
Our research showed that section discrepancy of breast lesions existed in 2D US either by dynamic videos or in static images. We suspected that this may be because the section discrepancy is related to the limitations of 2D imaging, the subjectivity of the observer, and the pathological characteristics of the lesion itself. There was no obvious relationship between section discrepancy and the two observation methods. Our results confirmed that it was weakly correlated with histopathology. In previous study of breast elastography, section anisotropy was found to be highly correlated with malignant lesions. It was attributed to the growth pattern that oriented along the ducts [13, 14]. On the contrary, in our study, benign lesions were more likely to show section discrepancy than malignant lesions, whether in static images or in dynamic videos. This indicated that benign lesions were more likely to have both “benign” and “suspicious malignant” sonograms. In general, the occurrence and development of disease were a gradual process. In the process of occurrence and progression, the pathological features of the lesion were gradually manifested, and different stages might coexist. These different components of the lesion had different pathological characteristics [23], which contributed to the diverse ultrasonographic features of same pathological type.
In the study of Földi et al., statistically significant differences were observed regarding the interpretation of the “margin” of breast lesions between the video sequence and the freeze image [11]. However, statistically significant differences between dynamic videos and static images for the interpretation of the feature “margin” only existed in the benign lesion group of our study. In our study, most benign lesions were defined as “microlobulated” or “angular” in static images. The low contrast between the lesion and its surrounding tissue might have obscured the “margin” especially when the benign lesion did not have an intact or clear capsule. The ducts adjacent to the lesions were usually misinterpreted as part of the lesions in static images, which leads to a characterization of “indistinct margin.” However, with dynamic videos, the course of the ducts could be observed more clearly and be separated from the lesions. “Margin” is an important 2D feature that might affect the final impression of breast lesions. Focusing only on the static image might be the cause for the relatively low specificity of 2D US. We found that dynamic observation could obtain more complete and accurate information about lesions and surrounding relevant features, which would influence the final assessment of the lesions. Therefore, for the computer-aided diagnosis (CAD) system, which had been an active research field for tumor diagnosis owing to its operator-independent in terms of image acquisition and interpretation [24, 25], the prediction models based on the “training” data of static 2D US images may be biased. As is known to all, the CAD system involves the following four steps: image preprocessing, segmentation, feature extraction and selection, and classification [26]. Among them, image segmentation is a key step. In most situations, the segmentation of breast lesions was still performed by manually tracing the lesion contours in static images, which is time-consuming and experience-dependent. According to the results of our study, this traditional segmentation might be affected by the limitations of static US imaging, such as imaging angle, artificial selection, etc. [27, 28]. In the process of improving the segmentation accuracy, proposing automatic and real-time segmentation methods would be a main trend in this field [29–31].
In practice, we had found a large number of atypical lesions that were initially evaluated as BI-RADS 4 were pathologically benign. Our observation based on dynamic videos showed its superiority in differentiating atypical lesions, inconsistent with the study of Földi et al. [11]. This could be due to the smaller sample size (n = 45) in the study of Földi et al., with 30 benign lesions and 15 malignant lesions, leading to insignificant proportion of atypical lesions. Dynamic videos offered better observation of the whole breast lesion, not only the lesion itself, but also the relationship with the surrounding tissue. Our study results showed that the diagnostic performance by dynamic videos surpassed that of static images, which encouraged clinicians to develop CAD system based on dynamic US, since the source of representative and high-quality US was the premise of CAD systems research [32], which would increase the specificity of 2D US to avoid unnecessary waste of medical resources. If artificial intelligence could directly process dynamic videos, it could save time for manual tracing and avoid bias caused by different observers.
In terms of our study, the CAD system based only on 2D US might produce diagnostic bias because of section discrepancy. As we know, the automated breast US system (ABUS) has the capability to overcome some of these limitations by allowing structured image acquisition, which enables whole-breast evaluation with multiplanar reformation and temporal comparisons [33]. However, research on CAD-assisted diagnosis of ABUS is currently based on static images of lesions [34–35]. Therefore, even though the ABUS images have sufficient structural information, the gray contrast between the lesion and its surrounding tissue could still be similar to that of static 2D US.
Our study had several limitations. First, it was a retrospective single-center study, which might elicit selection bias. Second, patients who did not undergo surgery or biopsy were not included in the study, which, again, might cause selection bias. Third, the images and dynamic videos were all collected by one experienced sonographer; therefore, whether the image-collecting process might affect the interpretation of the lesions characteristics could not be evaluated, which is important for further CAD analysis.
Conclusion
Breast lesions have section discrepancy in 2D US. Observations based on dynamic videos could more accurately reflect lesion features and increase the specificity of US in the differentiation of atypical breast lesions.
Acknowledgments
The authors acknowledged the Sun Yat-Sen Memorial Hospital of Sun Yat-sen University for technical assistance.
Financial support
This work was supported by Natural Science Foundation of Guangdong Province, China (2020B151512098 and 2018A030313097), and the National Natural Science Foundation of China (82001822).
Declarations of interest
None
Supplementary Figures and Table
Click here to download Supplementary Figures and Tables.
References
- Wild CP, Weiderpass E, Stewart BW. World cancer report: cancer research for cancer prevention. Lyon: International Agency for Research on Cancer; 2020. 25 pp.
- Carol ED, Jiemin M, Mia MG, Lisa AN, Kimberly DM, et al. Breast cancer statistics, 2019. CA: Cancer J Clin 2019;69:438-51. [PMID: 31577379 DOI: 10.3322/caac.21583]
- Brem RF, Lenihan MJ, Lieberman J, Torrente J. Screening breast ultrasound: past, present, and future. AJR Am J Roentgenol 2015;204:234-40. [PMID: 25615743 DOI: 10.2214/AJR.13.12072]
- Hu Y, Qiao M, Guo Y, Wang Y, Yu J, et al. Reproducibility of quantitative high-throughput BI-RADS features extracted from ultrasound images of breast cancer. Med Phys 2017;44:3676-85. [PMID: 28409843 DOI: 10.1002/mp.12275]
- Mendelson EB, Böhm-Vélez M, Berg WA, Whitman GJ, Feldman MI, et al. ACR BIRADS® ultrasound. In: Fallis AG, editor. ACR BI-RADS® atlas, breast imaging reporting and data system. Reston, VA: American College of Radiology; 2013. pp. 35–152.
- Guo R, Lu G, Qin B, Fei B. Ultrasound imaging technologies for breast cancer detection and management: a review. Ultrasound Med Biol 2018;44:37-70. [PMID: 29107353 DOI: 10.1016/j.ultrasmedbio.2017.09.012]
- Ciurea AI, Bolboaca SD, Ciortea CA, Botar-Jid C, Dudea SM. The influence of technical factors on sonoelastographic assessment of solid breast nodules. Ultraschall Med 2011;32(Suppl 1):S27-34. [DOI: 10.1055/s-0029-1245684]
- Thomson JZ, Evans AJ, Pinder SE, Burrell HC, Wilson AR, et al. Growth pattern of ductal carcinoma in situ (DCIS): a retrospective analysis based on mammographic findings. Br J Cancer 2001;85:225-7. [PMID: 11461081 DOI: 10.1054/bjoc.2001.1877]
- Wang Y, Choi EJ, Choi Y, Zhang H, Jin GY, et al. Breast cancer classification in automated breast ultrasound using multiview convolutional neural network with transfer learning. Ultrasound Med Biol 2020;46:1119-32. [PMID: 32059918 DOI: 10.1016/j.ultrasmedbio.2020.01.001]
- Sung JS. High-quality breast ultrasonography. Radiol Clin North Am 2014;52:519-26. [PMID: 24792653 DOI: 10.1016/j.rcl.2014.02.012]
- Földi M, Hanjalic-Beck A, Klar M, Seybold A, Mayer S, et al. Video sequence compared to conventional freeze image documentation: a way to improve the sonographic assessment of breast lesions? Ultraschall Med 2011;32:497-503. [PMID: 21294070 DOI: 10.1055/s-0029-1245797]
- Youk JH, Jung I, Yoon JH, Kim SH, Kim YM, et al. Comparison of inter-observer variability and diagnostic performance of the fifth edition of BI-RADS for breast ultrasound of static versus video images. Ultrasound Med Biol 2016;42:2083-8. [PMID: 27324292 DOI: 10.1016/j.ultrasmedbio.2016.05.006]
- Skerl K, Vinnicombe S, Thomson K, McLean D, Giannotti E, et al. Anisotropy of solid breast lesions in 2D shear wave elastography is an indicator of malignancy. Acad Radiol 2016;23:53-61. [PMID: 26564483 DOI: 10.1016/j.acra.2015.09.016]
- Chen YL, Gao Y, Chang C, Wang F, Zeng W, et al. Ultrasound shear wave elastography of breast lesions: correlation of anisotropy with clinical and histopathological findings. Cancer Imaging 2018;18:11. [PMID: 29622044 DOI: 10.1186/s40644-018-0144-x]
- Partridge SC, Ziadloo A, Murthy R, White SW, Peacock S, et al. Diffusion tensor MRI: preliminary anisotropy measures and mapping of breast tumors. J Magn Reson Imaging 2010;31:339-47. [PMID: 20099346 DOI: 10.1002/jmri.22045]
- Baltzer PA, Schäfer A, Dietzel M, Grässel D, Gajda M, et al. Diffusion tensor magnetic resonance imaging of the breast: a pilot study. Eur Radiol 2011;21:1-10. [PMID: 20668860 DOI: 10.1007/s00330-010-1901-9]
- Li JL. Application value and recommendation of breast ultrasound imaging report and data system classification. J Chin J Med Ultrasound 2015;12:828-33 (in Chinese).
- Yoon JH, Kim MJ, Moon HJ, Kwak JY, Kim EK. Subcategorization of ultrasonographic BI-RADS category 4: positive predictive value and clinical factors affecting it. Ultrasound Med Biol 2011;37:693-9. [PMID: 21458145 DOI: 10.1016/j.ultrasmedbio.2011.02.009]
- Stavros AT, Thickman D, Rapp CL, Dennis MA, Parker SH, et al. Solid breast nodules: use of sonography to distinguish between benign and malignant lesions. Radiology 1995;196:123-34. [PMID: 7784555 DOI: 10.1148/radiology.196.1.7784555]
- Hong AS, Rosen EL, Soo MS, Baker JA. BI-RADS for sonography: positive and negative predictive values of sonographic features. AJR Am J Roentgenol 2005;184:1260-5. [PMID: 15788607 DOI: 10.2214/ajr.184.4.01841260]
- Taskin F, Koseoglu K, Ozbas S, Erkus M, Karaman C. Sonographic features of histopathologically benign solid breast lesions that have been classified as BI-RADS 4 on sonography. J Clin Ultrasound 2012;40:261-5. [PMID: 22508447 DOI: 10.1002/jcu.21923]
- Sun X, Xu W. Fast Implementation of DeLong’s algorithm for comparing the areas under correlated receiver operating characteristic curves. IEEE Signal Process Lett 2014;21:1389-93. [DOI: 10.1109/LSP.2014.2337313]
- Zhang JX. Breast ultrasonography. Beijing: People’s Medical Publishing House; 2012. pp. 51–95.
- Chan HP, Samala RK, Hadjiiski LM. CAD and AI for breast cancer-recent development and challenges. Br J Radiol 2020;93:20190580. [PMID: 31742424 DOI: 10.1259/bjr.20190580]
- Park HJ, Kim SM, La YB, Jang M, Kim B, et al. A computer-aided diagnosis system using artificial intelligence for the diagnosis and characterization of breast masses on ultrasound: added value for the inexperienced breast radiologist. Medicine (Baltimore) 2019;98:e14146. [PMID: 30653149 DOI: 10.1097/MD.0000000000014146]
- Huang Q, Luo Y, Zhang Q. Breast ultrasound image segmentation: a survey. Int J Comput Assist Radiol Surg 2017;12:493-507. [PMID: 28070777 DOI: 10.1007/s11548-016-1513-1]
- Gu P, Lee WM, Roubidoux MA, Yuan J, Wang X, et al. Automated 3D ultrasound image segmentation to aid breast cancer image interpretation. Ultrasonics 2016;65:51-8. [PMID: 26547117 DOI: 10.1016/j.ultras.2015.10.023]
- Xu Y, Wang Y, Yuan J, Cheng Q, Wang X, et al. Medical breast ultrasound image segmentation by machine learning. Ultrasonics 2019;91:1-9. [PMID: 30029074 DOI: 10.1016/j.ultras.2018.07.006]
- Huang YL, Jiang YR, Chen DR, Moon WK. Level set contouring for breast tumor in sonography. J Digit Imaging 2007;20:238-47. [PMID: 17252171 DOI: 10.1007/s10278-006-1041-6]
- Shi J, Xiao Z, Zhou S. Automatic segmentation of breast tumor in ultrasound image with simplified PCNN and improved fuzzy mutual information. Vis Commun Image Process 2010;7744:77441P-77441P-8.
- Shan J, Cheng HD, Wang Y. Completely automated segmentation approach for breast ultrasound images using multiple-domain features. Ultrasound Med Biol 2012;38:262-75. [PMID: 22230134 DOI: 10.1016/j.ultrasmedbio.2011.10.022]
- Le EPV, Wang Y, Huang Y, Hickman S, Gilbert FJ. Artificial intelligence in breast imaging. Clin Radiol 2019;74:357-66. [PMID: 30898381 DOI: 10.1016/j.crad.2019.02.006]
- Kwon BR, Chang JM, Kim SY, Lee SH, Kim SY, et al. Automated breast ultrasound system for breast cancer evaluation: diagnostic performance of the two-view scan technique in women with small breasts. Korean J Radiol 2020;21:25-32. [PMID: 31920026 DOI: 10.3348/kjr.2019.0275]
- Van Zelst JCM, Tan T, Clauser P, Domingo A, Dorrius MD, et al. Dedicated computer-aided detection software for automated 3D breast ultrasound; an efficient tool for the radiologist in supplemental screening of women with dense breasts. Eur Radiol 2018;28:2996-3006. [PMID: 29417251 DOI: 10.1007/s00330-017-5280-3]
- Lee CY, Chang TF, Chou YH, Yang KC. Fully automated lesion segmentation and visualization in automated whole breast ultrasound (ABUS) images. Quant Imaging Med Surg 2020;10:568-84. [PMID: 32269918 DOI: 10.21037/qims.2020.01.12]