Combining Insulin Resistance and Renal Function to Predict Cardiovascular Events: A Multicenter Cohort Study
1Zhengzhou University, Zhengzhou, Henan 450051, China
2Tianjin Key Laboratory of Ionic-Molecular Function of Cardiovascular disease, Department of Cardiology, Tianjin Institute of Cardiology, the Second Hospital of Tianjin Medical University, Tianjin 300211, China
3Liverpool Centre for Cardiovascular Science at University of Liverpool, Liverpool John Moores University and Liverpool Heart & Chest Hospital, Liverpool, United Kingdom
4Department of Cardiology, First Affiliated Hospital of Xinjiang Medical University, Ürümqi, China
5Department of Plastic and Reconstructive Surgery, Shanghai Ninth People’s Hospital, Shanghai JiaoTong University School of Medicine, Shanghai, China
6The First Affiliated Hospital of Zhengzhou University, Zhengzhou 450052, China
7Division of Biomedical and Life Sciences, Faculty of Health and Medicine, Lancaster University, Lancaster, LA1 4YG, UK
8Department of Cardiology, First Affiliated Hospital of Ningbo University (Ningbo First Hospital), School of Medicine, Ningbo University, Ningbo, China
9Key Laboratory of Precision Prevention and Treatment for Atherosclerotic Diseases of Zhejiang Province, Ningbo, China
10Department of Vascular Surgery, First Affiliated Hospital of Zhengzhou University, Zhengzhou, Henan, China
*Correspondence to: Ge Zhang, PhD, MD, Zhengzhou University, Zhengzhou, Henan 450051, China. E-mail: zg381492242@163.com; Fangkun Yang, PhD, MD, Department of Cardiology, First Affiliated Hospital of Ningbo University (Ningbo First Hospital), School of Medicine, Ningbo University, Ningbo, China. E-mail: yangfk@zju.edu.cn; Bo Yang, PhD, MD, Department of Vascular Surgery, First Affiliated Hospital of Zhengzhou University, Henan, China. E-mail: pkuyangbo@163.com; Chaoyang Yu, PhD, MD, Department of Vascular Surgery, First Affiliated Hospital of Zhengzhou University, Zhengzhou, Henan 450052, China. E-mail: dryucy2024@163.com
Received: January 26 2026; Revised: April 10 2026; Accepted: May 3 2026; Published Online: June 15 2026.
Cite this paper:
Zhang G, Gu T, Kadier K et al. Combining Insulin Resistance and Renal Function to Predict Cardiovascular Events: A Multicenter Cohort Study. BIO Integration 2026; 7: 1–17.
DOI: 10.15212/bioi-2026-0017. Available at: https://bio-integration.org/
Download citation
© 2026 The Authors. This is an open access article distributed under the terms of the Creative Commons Attribution License (https://creativecommons.org/licenses/by/4.0/). See https://bio-integration.org/copyright-and-permissions/
Abstract
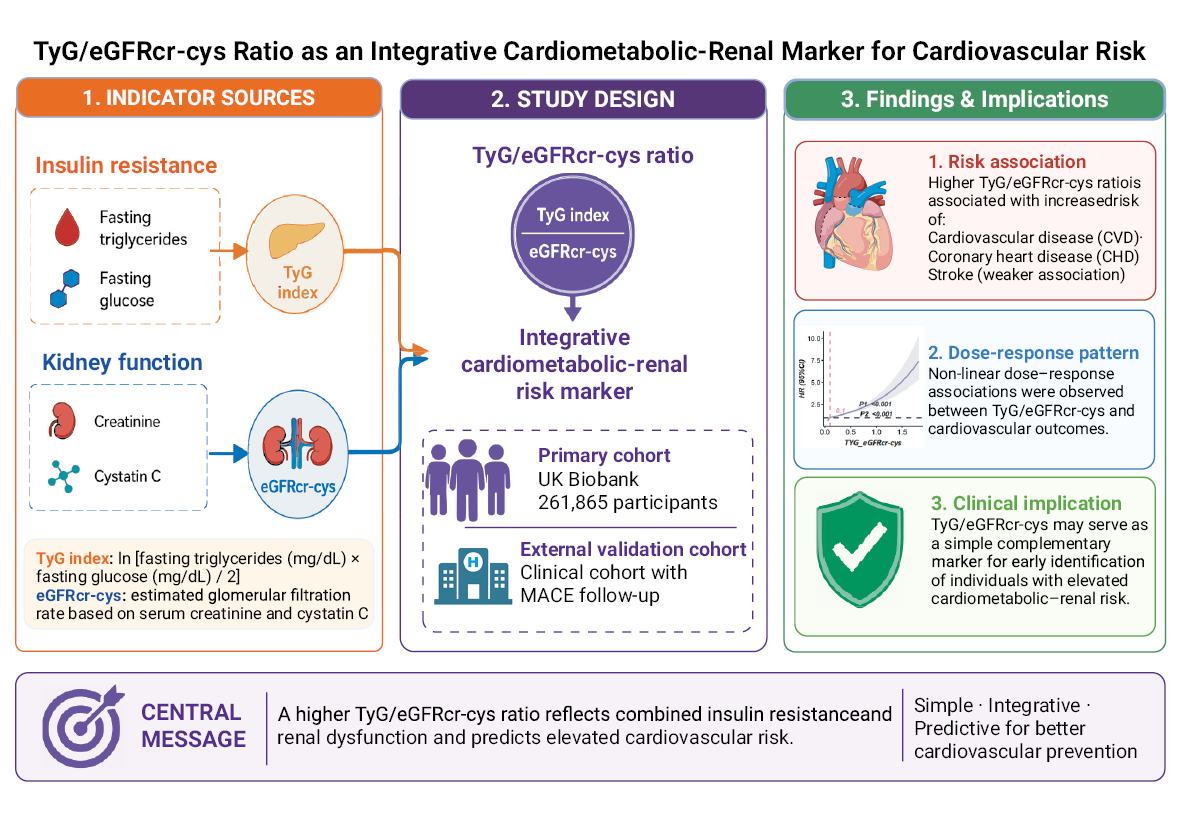
Background: Insulin resistance (IR) and chronic kidney disease (CKD) are independent risk factors for cardiovascular disease (CVD). The triglyceride-glucose (TyG) index is recognized as a convenient marker for IR, while the estimated glomerular filtration rate based on both creatinine and cystatin C (eGFRcr-cys) is commonly used to evaluate kidney function. Therefore, the TyG:eGFRcr-cys ratio is introduced with the aim of obtaining a more effective predictor for CVD risk.
Method: This prospective cohort analysis included 261,865 UK Biobank participants with available information. Cox proportional hazards models were used to evaluate the associations of TyG, eGFRcr-cys, and the TyG:eGFRcr-cys ratio with incident CVD. Restricted cubic splines for model fitting with three knots placed at the 10th, 50th, 90th percentiles were used to determine the non-linear relationship between the TyG:eGFRcr-cys ratio and CVD. Furthermore, subgroup and sensitivity analyses were performed to illustrate the disparate associations across diverse groups and to reinforce the conclusions drawn, respectively. An independent single-center clinical cohort was assembled from the First Affiliated Hospital of Zhengzhou University for external validation by enrolling consecutive patients between 2018 and 2020 with baseline TyG index and eGFRcr-cys measurements and up to 4 years of follow-up. External validation with major adverse cardiovascular events was further performed as the outcome and observed consistent dose–response associations and robust risk stratification for the TyG:eGFRcr-cys ratio.
Result: Following extensive covariate adjustment, the hazard ratios [HRs] (95% confidence intervals [CIs]) for total CVD across increasing quartiles of the TyG:eGFRcr-cys ratio, with the lowest quartile (Q1) as the reference, were 1.15 (1.10–1.21) for Q2 versus Q1, 1.17 (1.12–1.23) for Q3 versus Q1, and 1.24 (1.18–1.30) for Q4 versus Q1, respectively, for the TyG:eGFRcr-cys ratio. In addition, each standard deviation increase in the TyG:eGFRcr-cys ratio was associated with a higher risk of CVD, coronary heart disease, and stroke, corresponding to estimated increases of 249% [HR, 3.49; 95% CI, 2.94–4.15], 250% [HR, 3.50; 95% CI, 2.92–4.20], and 165% [HR, 2.65; 95% CI, 1.80–3.90], respectively, in the fully adjusted models. The non-linear relationship between the TyG:eGFRcr-cys ratio and CVD (P-value for the overall model < 0.001 and P-value for the non-linear model < 0.001) indicated that the CVD risk increased as the TyG:eGFRcr-cys ratio increased. Subgroup analysis results suggested that these associations were more pronounced in White individuals and females.
Conclusion: As the TyG:eGFRcr-cys ratio increased, the risk of CVD also increased with a higher likelihood in females and White individuals.
Keywords
Cardiac & cardiovascular systems, medicine, medicine, endocrinology & metabolism.
Introduction
Within the realm of non-communicable diseases, cardiovascular diseases (CVDs) are the leading cause of mortality, accounting for an estimated 19.8 million deaths globally in 2022, representing approximately 32% of all global deaths [1]. Among the 17 million premature deaths (< 70 years of age) caused by non-communicable diseases in 2019, 38% were attributed to CVDs, accounting for 330 million years of life lost worldwide [2]. Moreover, the number of deaths from CVD and the years of life lost due to CVD have shown a steady increase over the past 3 decades [3–5]. However, most CVDs are preventable through management of behavioral and environmental risk factors, underscoring the importance of early detection.
Insulin resistance (IR) is characterized by reduced cellular sensitivity and responsiveness to insulin. This condition manifests as decreased glucose uptake by tissues and impaired suppression of hepatic glucose production, contributing to the onset and identification of CVD in general and diabetic populations [6]. Furthermore, IR is associated with an elevated risk of obesity, hypertension, dyslipidemia, impaired glucose tolerance, and metabolic syndrome, all of which have been established as independent risk factors for CVD. The hyperinsulinemia euglycemic clamp (HIEC) technique, initially proposed by De Fronzo in 1979, continues to represent the gold standard for measurement of IR [7]. However, the invasive and costly nature of the HIEC technique has substantially restricted the application to research settings rather than routine clinical practice. Consequently, the introduction of various non-insulin-based surrogates for IR has greatly simplified the testing process. The triglyceride-glucose (TyG) index, proven to be a more valuable indicator than the homeostatic model assessment of insulin resistance (HOMA-IR) index, is calculated using the following formula: Ln [triglycerides (mg/dL) × glucose (mg/dL)/2] [7]. The TyG index is a more cost-effective, convenient, and easily obtainable method than the HOMA-IR index [8]. Moreover, the TyG index, which is derived from fasting triglyceride and glucose levels, addresses the limitations of the HOMA-IR index, which cannot be applied to diabetic patients undergoing insulin therapy [9]. The predictive value of the TyG index for CVD and the poor prognosis has been validated by numerous studies [10–17]. In addition, the TyG index serves as an effective tool for identifying asymptomatic individuals at an elevated risk of developing atherosclerosis [18]. Furthermore, the TyG index has proven efficacy in identifying patients at increased risk of in-stent restenosis (ISR) after percutaneous coronary intervention (PCI) [19]. In conclusion, the collective findings indicate that the TyG index has considerable potential for use in the diagnosis and monitoring of diverse CVDs. However, previous studies have shown that the TyG index has limited specificity (45.0%) for diagnosing IR [8]. The predictive utility of the TyG index for CVD incidence across various populations is a subject of ongoing debate. Furthermore, most studies have evaluated the TyG index solely at baseline, thus neglecting the potential temporal fluctuations in the TyG index and associated CVD risk. Despite the undeniable advantages of the TyG index, concerns remain regarding the limited specificity and applicability across diverse populations. Current evidence indicates that additional research is necessary to validate the association between the TyG index and CVD risk. Chronic kidney disease (CKD), which is characterized by a reduced glomerular filtration rate (GFR) or elevated albuminuria, is regarded as an independent risk factor for CVD and a coronary artery disease (CAD) equivalent for all-cause mortality [20]. According to the guidelines established by the Kidney Disease Improving Global Outcomes (KDIGO) initiative, a GFR < 60 mL/min/1.73 m2 is indicative of CKD [21]. Given the aforementioned evidence, it could be posited that a reduction in the estimated glomerular filtration rate based on both creatinine and cystatin C (eGFRcr-cys) significantly contributes to the development of CVD owing to the shared pathogenic mechanisms between CKD and CVD [20]. A considerable body of evidence from extensive cohort studies has established a significant association between sustained reductions in the eGFRcr-cys and an increased risk of developing CAD [22]. However, the ability of the eGFRcr-cys to predict CVD risk depends on various factors, such as the presence of co-morbidities and the specific equation used to calculate the eGFRcr-cys [23]. Moreover, the effectiveness of the eGFRcr-cys as an independent predictor has been shown to be affected by morphologic abnormalities [24].
Therefore, the TyG:eGFRcr-cys ratio was introduced with the aim of obtaining a more effective predictor for CVD risk. The objective of this study was to examine the relationship between TyG, the TyG:eGFRcr-cys ratio, and the eGFRcr-cys and the risk of developing CVD. Cox proportional hazards analysis was used to assess the effect of the TyG:eGFRcr-cys ratio on CVD risk, while restricted cubic splines (RCS) were utilized to evaluate the linear association between each factor and CVD risk. Subgroup and sensitivity analyses were subsequently performed to confirm the robustness of our findings. The findings will contribute to a more comprehensive understanding of CVD risk assessment.
Methods
Study design and population
This study included a primary analysis based on the UK Biobank and an external validation using an independent single-center clinical cohort.
Primary cohort (UK Biobank). The UK Biobank is a prospective cohort involving 500,000 participants 40–69 years of age who were recruited between 2006 and 2010 from 22 assessment centers across England, Wales, and Scotland. The participants provided written informed consent, completed questionnaires and interviews, underwent physical measurements, and provided biological samples, including blood collected under standardized quality-control procedures, at baseline. A total of 261,865 participants were included after excluding participants with CVD at baseline (n = 22,949) and participants with missing exposures (n = 71,731) or covariates (n = 145,821).
External validation cohort. An independent clinical cohort was assembled from the Department of Vascular Surgery (the First Affiliated Hospital of Zhengzhou University, Zhengzhou, China) by enrolling consecutive patients between January 2018 and December 2020 to externally validate the UK Biobank findings. A total of 1798 patients were initially included in the external cohort. Eligibility assessment and exclusions were aligned with the eligibility assessment and exclusions used in the UK Biobank analysis when feasible. Patients with available baseline measurements of the TyG index and the eGFRcr-cys were included and baseline data were collected at the index hospitalization. The external validation endpoint was major adverse cardiovascular events (MACE), which is defined as fatal or non-fatal coronary heart disease (CHD) or stroke. Outcomes were identified using diagnosis codes from hospital records and death registries. Participants were followed for up to 4 years from the index date to the first event or the last follow-up, whichever came first. Event-free participants were censored at the last follow-up evaluation. A total of 328 participants were included in the complete-case dataset used for the fully adjusted external validation analysis, among whom 88 developed MACE during follow-up, corresponding to an event rate of 26.8%. This study was conducted in accordance with the Declaration of Helsinki and approved by the Institutional Ethics Committee of the First Affiliated Hospital of Zhengzhou University (No. 2026-KY-0398).
Assessment of the TyG index and the TyG:eGFRcr-cys ratio
Peripheral venous blood samples were collected from all participants at study onset. The collection procedures used in the UK Biobank study were subsequently validated [25]. The duration of fasting and the number of hours elapsed since the previous meal were documented. Blood samples were analyzed within 24 h of collection by the UK Biobank using standard hematologic tests. Coefficients of variation for triglycerides and glucose were determined to be < 3% and < 2%, respectively, indicating high precision and accuracy in the testing process. The TyG index was calculated using the following formula: ln [triglycerides (mg/dL) × glucose (mg/dL)/2] [26]. The eGFR was calculated using the Chronic Kidney Disease Epidemiology Collaboration (CKD-EPI) creatinine-cystatin C equation [26, 27]. The TyG:eGFRcr-cys ratio was calculated as the TyG index divided by the eGFRcr-cys (mL/min/1.73 m2).
Assessment of covariates
Baseline characteristics were collected via a touch-screen questionnaire gathering data on age, race, gender, ethnicity, Townsend Deprivation Index, employment, current smoking status, and baseline medication use (aspirin, insulin, and antihypertensive and cholesterol-lowering medications). The Townsend Deprivation Index is a composite measure of socioeconomic deprivation based on factors, such as unemployment, non-car ownership, non-home ownership, and household overcrowding. The Townsend Deprivation Index is derived from the residential postcode with a negative value representing high socioeconomic status [28]. Total metabolic equivalent (MET) minutes per week were calculated based on a modified International Physical Activity Questionnaire (IPAQ) [29]. Moreover, baseline data, including diastolic blood pressure (DBP), systolic blood pressure (SBP), and low-density lipoprotein-cholesterol (LDL-C) and high-density lipoprotein-cholesterol (HDL-C) levels, were obtained in accordance with established protocols.
Assessment of outcomes
As with the primary outcome of the study, incident CVD was defined as a fatal or non-fatal case of CHD or stroke. CHD and stroke were further considered as secondary outcomes in this study. All outcomes were diagnosed by means of diagnosis codes, which were obtained from registered hospital admissions and death registries. The incidence of CHD was defined according to the I20-I25 codes of the 10th revision of the International Classification of Diseases (ICD-10). The incidence of stroke was defined by ICD-10 codes I60–I64.
Statistical analyses
The characteristics of the participants are expressed as mean values (standard deviation [SD]) for continuous variables, whereas frequencies (percentages) were used for categorical variables. Participants were stratified into four groups according to the TyG index, TyG:eGFRcr-cys ratio, and eGFRcr-cys quartiles. A chi-squared test for categorical variables was used to ascertain the existence of discrepancies between the quartiles. ANOVA was applied to continuous variables. Cox proportional hazard models were used to elucidate the relationships between the TyG index, the TyG:eGFRcr-cys ratio, CVD, CHD, and stroke risk, deriving hazard ratios (HRs) and 95% confidence intervals (CIs) of higher quartiles in relation to the lowest quartiles, as used in previous studies [30–32]. Three models with increasing levels of adjustment were fitted to assess potential confounders of CVD: Model 1 was adjusted for age, race, gender, employment status, educational level, and Townsend Deprivation Index; Model 2 was further adjusted for alcohol intake, body mass index, smoking status, and MET; and Model 3 was further adjusted for cholesterol-lowering medication, antihypertensive medication, and insulin treatment. RCS models were used to determine the non-linear associations between TyG index, the TyG:eGFRcr-cys ratio, and the eGFRcr-cys with CVD, CHD, and stroke. A parsimonious 3-knot specification was applied for the primary analysis in the UK Biobank cohort with knots placed at the 10th, 50th, and 90th percentiles, whereas 4 knots were used in the external validation cohort to provide greater flexibility in the smaller clinical sample, as used in previous studies [33–35].
Subgroup and sensitivity analyses were conducted to further substantiate our findings. An assessment was performed to determine whether age, gender, race, education, employment status, Townsend Deprivation Index, current smoking status, alcohol consumption habits, body mass index, and MET could serve as potential effect modifiers in the context of subgroup analysis. An adjustment for SBP, glycosylated hemoglobin (HbA1C), C-reactive protein (CRP), and total cholesterol level was carried out for sensitivity analysis to confirm the robustness of the results. In addition, individuals who developed CVD within the first 3 years of follow-up and were lost to follow-up were excluded to minimize potential reverse causality.
External validation statistical analysis
External validation used the same exposure definitions as the primary analysis. The TyG index, the eGFRcr-cys, and the TyG:eGFRcr-cys ratio were analyzed as continuous variables and results were reported per 1-SD increase. Associations with incident MACE were assessed using Cox proportional hazards models with the fully adjusted Model 3. Analyses were performed in complete cases. Non-linear relationships were explored using RCS (4 knots) within Model 3. P values for the overall association (P1) and non-linearity (P2) were obtained from Wald tests and plots highlighted the 25th and 75th percentiles. Kaplan–Meier curves were generated by the TyG:eGFRcr-cys ratio quartiles and compared using the log-rank test.
Dynamic network biomarker analysis
Participants were divided into four groups according to quartiles of the TyG:eGFRcr-cys ratio (Q1–Q4) to further explore potential transition-related dynamic changes across the TyG:eGFRcr-cys ratio-based risk strata and dynamic network biomarker (DNB) analysis was performed across these ordered groups. Transitions may occur abruptly and non-linearly in complex disease progression rather than through a gradual linear process. A critical transition stage is considered an intermediate state between a relatively stable stage and a more advanced stage of disease progression within this framework. DNB analysis was used as an exploratory approach to detect potential transition-related signals across the four TyG:eGFRcr-cys ratio-based risk groups.
Let M denote a μ × ν data matrix, where μ represents the number of selected variables and ν represents the number of participants. After stratification into K ordered groups (K = 4 in the present study), the full matrix can be represented as follows:
where MK denotes the submatrix corresponding to the k-th TyG:eGFRcr-cys ratio quartile group and νk denotes the number of participants in that group. For each group k, Pearson correlation coefficients were calculated for all variable pairs. A correlation network was constructed and partitioned into highly connected modules by optimizing network modularity based on these pairwise correlations. Each module therefore represented a cluster of variables showing relatively strong internal connectivity.
For each module h within group k, the following DNB-related quantities were calculated:
Within-module fluctuation
where SD(z) denotes the standard deviation of variable z within the module.
Within-module correlation
where cor(za, zb) denotes the Pearson correlation coefficient between two variables within the same module.
Between-module correlation

where zc denotes a variable outside the module.
The DNB composite index for module h was then defined as:
In this formulation, Fh corresponds to the DNB SD, Rh corresponds to the intra-module Pearson correlation coefficient (PCC), Bh corresponds to the out-of-module Pearson correlation coefficient (PCCo), and Dh corresponds to the DNB composite index. For each quartile group, the module with the highest Dh value was defined as the biomodule and the corresponding SD, PCC, PCCo, and composite index were used to characterize transition-related network instability in that group. Higher composite index values were interpreted as indicating stronger transition-related signals.
The DNB scores were evaluated using bootstrap resampling with 1000 iterations to further assess robustness. The DNB findings were interpreted cautiously because this analysis was exploratory and intended to characterize potential transition-related changes across the TyG:eGFRcr-cys ratio-based risk strata rather than to establish causal relationships.
Results
Population characteristics
A total of 261,865 participants who met the inclusion criteria were recruited in the current study. Participants were stratified into quartiles based on the TyG:eGFRcr-cys ratio, TyG index, and the eGFRcr-cys, as detailed in Tables 1 and S1, S2, respectively. Of the 261,865 participants, 138,453 (52.87%) were women, 249,599 (95.32%) were White, and the mean (SD) age at baseline was 55.25 (8.06) years. Furthermore, 32,906 participants (12.57%) were receiving cholesterol-lowering medications, 42,524 (16.24%) were on antihypertensive medications, and 2067 (0.79%) were using insulin therapy. A higher TyG index and TyG:eGFRcr-cys ratio were correlated with older age, White ethnicity, male gender, elevated body mass index (BMI), lower educational attainment, smoking status, a higher Townsend Deprivation Index, indicating greater socioeconomic deprivation, unemployment, alcohol consumption, lower METs, use of cholesterol-lowering and antihypertensive medications, insulin usage, higher blood pressure, and serum levels of total cholesterol, HDL-C, LDL-C, and CRP, and a lower eGFRcr-cys (Figure 1).
Figure 1 TyG:eGFRcr-cys ratio and cardiovascular risk: Evidence from 261,865 participants in the UK Biobank.
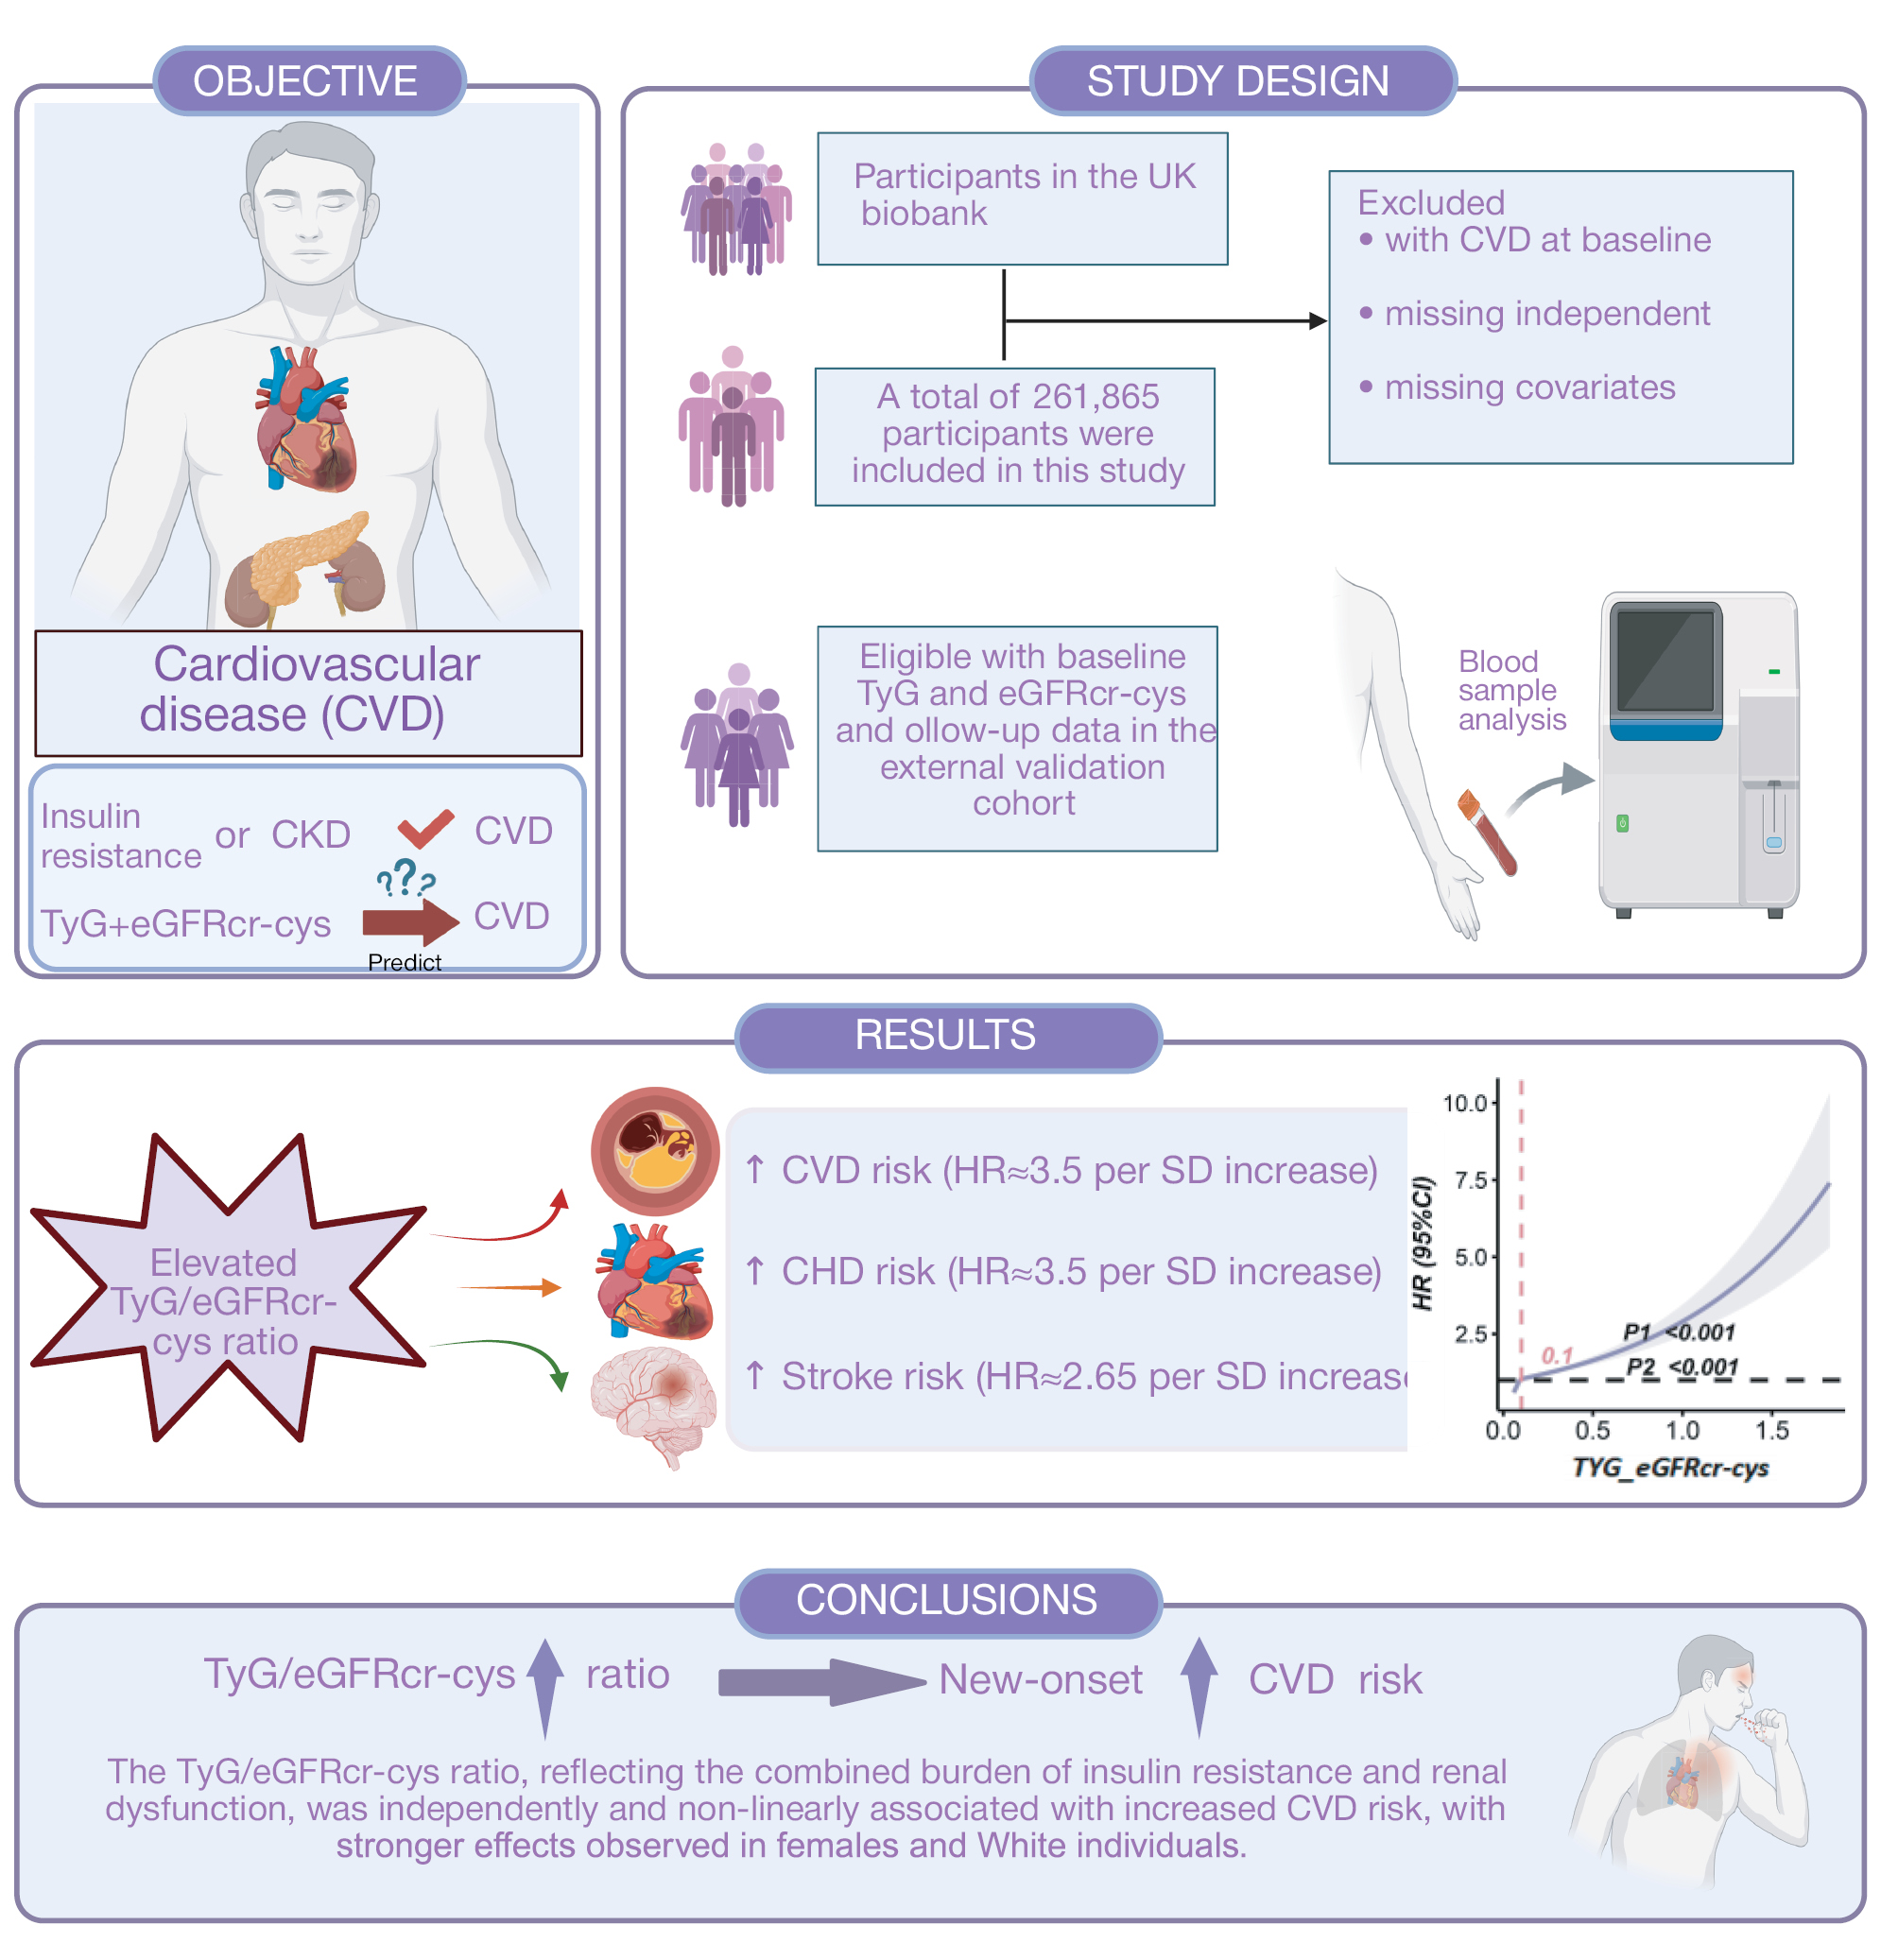
Table 1 Characteristics of the study population according to the TyG:eGFRcr-cys ratio quartiles
| Level | Q1 | Q2 | Q3 | Q4 | P | |
|---|---|---|---|---|---|---|
| n | 65,467 | 65,466 | 65,466 | 65,466 | ||
| Age (mean (SD)) | 49.25 (6.55) | 54.99 (7.43) | 57.45 (7.45) | 59.31 (6.99) | < 0.001 | |
| Race (%) | White | 60,527 (92.45) | 62,697 (95.77) | 63,129 (96.43) | 63,246 (96.61) | < 0.001 |
| Others | 4940 (7.55) | 2769 (4.23) | 2337 (3.57) | 2220 (3.39) | ||
| Gender (%) | Male | 23,221 (35.47) | 30,849 (47.12) | 34,481 (52.67) | 34,861 (53.25) | < 0.001 |
| Female | 42,246 (64.53) | 34,617 (52.88) | 30,985 (47.33) | 30,605 (46.75) | ||
| BMI [mean (SD)] | 25.59 (4.52) | 26.86 (4.58) | 27.59 (4.46) | 28.19 (4.47) | < 0.001 | |
| Education (%) | College or university degree | 30,422 (46.47) | 28,080 (42.89) | 26,508 (40.49) | 25,053 (38.27) | < 0.001 |
| Others | 35,045 (53.53) | 37,386 (57.11) | 38,958 (59.51) | 40,413 (61.73) | ||
| Smoker (%) | Current | 7411 (11.32) | 6536 (9.98) | 5712 (8.73) | 4688 (7.16) | < 0.001 |
| Ever | 29,850 (45.60) | 32,214 (49.21) | 33,660 (51.42) | 34,314 (52.41) | ||
| Never | 28,206 (43.08) | 26,716 (40.81) | 26,094 (39.86) | 26,464 (40.42) | ||
| Deprivation [mean (SD)] | 16.58 (13.39) | 15.39 (12.54) | 14.99 (12.28) | 14.92 (12.22) | < 0.001 | |
| Employment (%) | Employed | 53,805 (82.19) | 44,351 (67.75) | 38,359 (58.59) | 33,716 (51.50) | < 0.001 |
| Unemployed | 11,662 (17.81) | 21,115 (32.25) | 27,107 (41.41) | 31,750 (48.50) | ||
| Alcohol consumption (%) | Frequently | 29,689 (45.35) | 32,033 (48.93) | 32,366 (49.44) | 30,858 (47.14) | < 0.001 |
| Occasionally | 31,496 (48.11) | 29,515 (45.08) | 29,294 (44.75) | 30,403 (46.44) | ||
| Never | 4282 (6.54) | 3918 (5.98) | 3806 (5.81) | 4205 (6.42) | ||
| MET (%) | Low | 11,195 (17.10) | 11,637 (17.78) | 12,171 (18.59) | 12,529 (19.14) | < 0.001 |
| Moderate | 34,054 (52.02) | 34,282 (52.37) | 33,956 (51.87) | 34,046 (52.01) | ||
| High | 20,218 (30.88) | 19,547 (29.86) | 19,339 (29.54) | 18,891 (28.86) | ||
| Cholesterol-lowering medication (%) | Yes | 3082 (4.71) | 6864 (10.48) | 9827 (15.01) | 13,133 (20.06) | < 0.001 |
| No | 62,385 (95.29) | 58,602 (89.52) | 55,639 (84.99) | 52,333 (79.94) | ||
| Antihypertensive medication (%) | Yes | 4875 (7.45) | 9144 (13.97) | 12,022 (18.36) | 16,483 (25.18) | < 0.001 |
| No | 60,592 (92.55) | 56,322 (86.03) | 53,444 (81.64) | 48,983 (74.82) | ||
| Insulin (%) | Yes | 462 (0.71) | 420 (0.64) | 483 (0.74) | 702 (1.07) | < 0.001 |
| No | 65,005 (99.29) | 65,046 (99.36) | 64,983 (99.26) | 64,764 (98.93) | ||
| DBP [mean (SD)] | 79.92 (10.12) | 82.30 (10.04) | 83.16 (9.95) | 83.23 (9.98) | < 0.001 | |
| SBP [mean (SD)] | 129.92 (17.01) | 136.62 (17.84) | 139.26 (18.22) | 140.25 (18.22) | < 0.001 | |
| TC [mean (SD)] | 210.70 (37.95) | 224.09 (41.42) | 226.88 (43.59) | 225.72 (44.97) | < 0.001 | |
| HDL-C [mean (SD)] | 60.82 (15.13) | 57.58 (14.64) | 54.83 (14.09) | 53.38 (14.09) | < 0.001 | |
| LDL-C [mean (SD)] | 129.31 (29.17) | 140.62 (31.80) | 143.10 (33.12) | 142.19 (33.93) | < 0.001 | |
| CRP [mean (SD)] | 2.02 (3.99) | 2.30 (4.00) | 2.42 (3.82) | 2.68 (4.20) | < 0.001 | |
| HbA1C [mean (SD)] | 33.91 (4.85) | 35.22 (5.55) | 36.11 (6.42) | 36.77 (6.90) | < 0.001 | |
| TyG [mean (SD)] | 8.26 (0.43) | 8.64 (0.47) | 8.86 (0.53) | 8.97 (0.55) | < 0.001 | |
| eGFRcr-cys [mean (SD)] | 105.07 (6.17) | 97.22 (5.47) | 90.49 (5.92) | 75.70 (9.98) | < 0.001 | |
Continuous variables are expressed as the mean (SD). Categorical variables are expressed as a frequency (percentage).
Associations between the TyG index and the TyG:eGFRcr-cys ratio with CVD
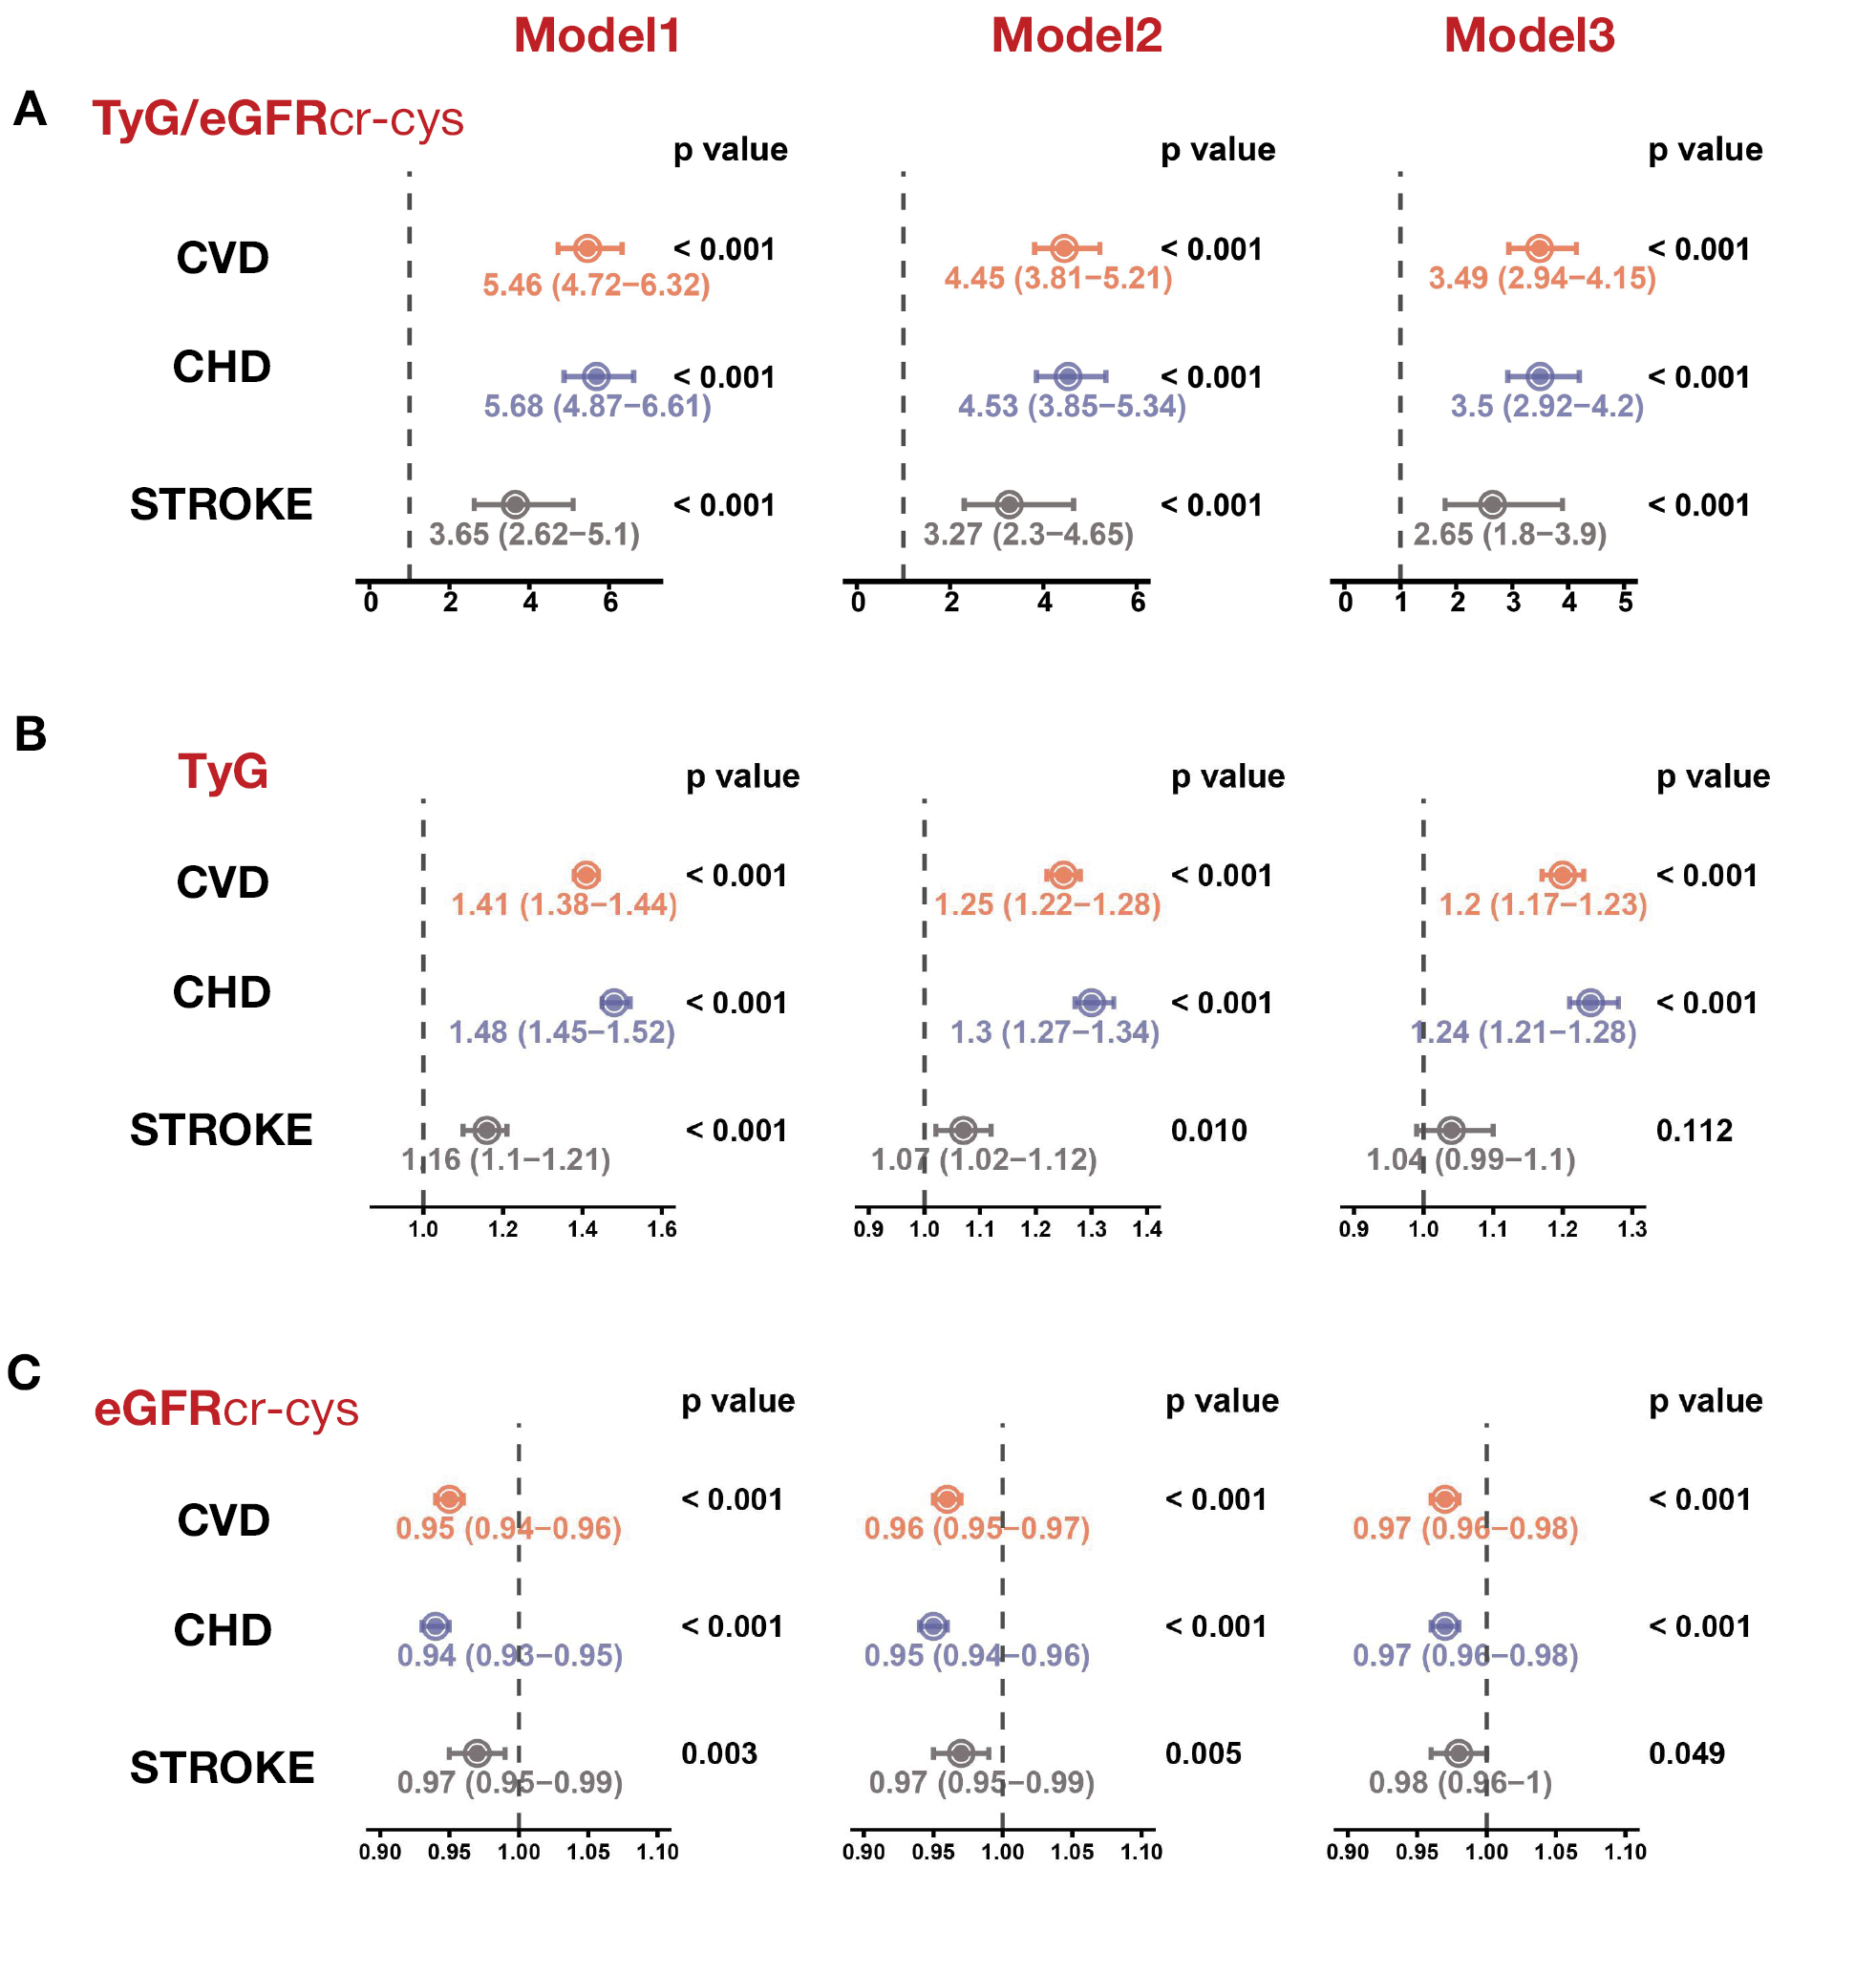
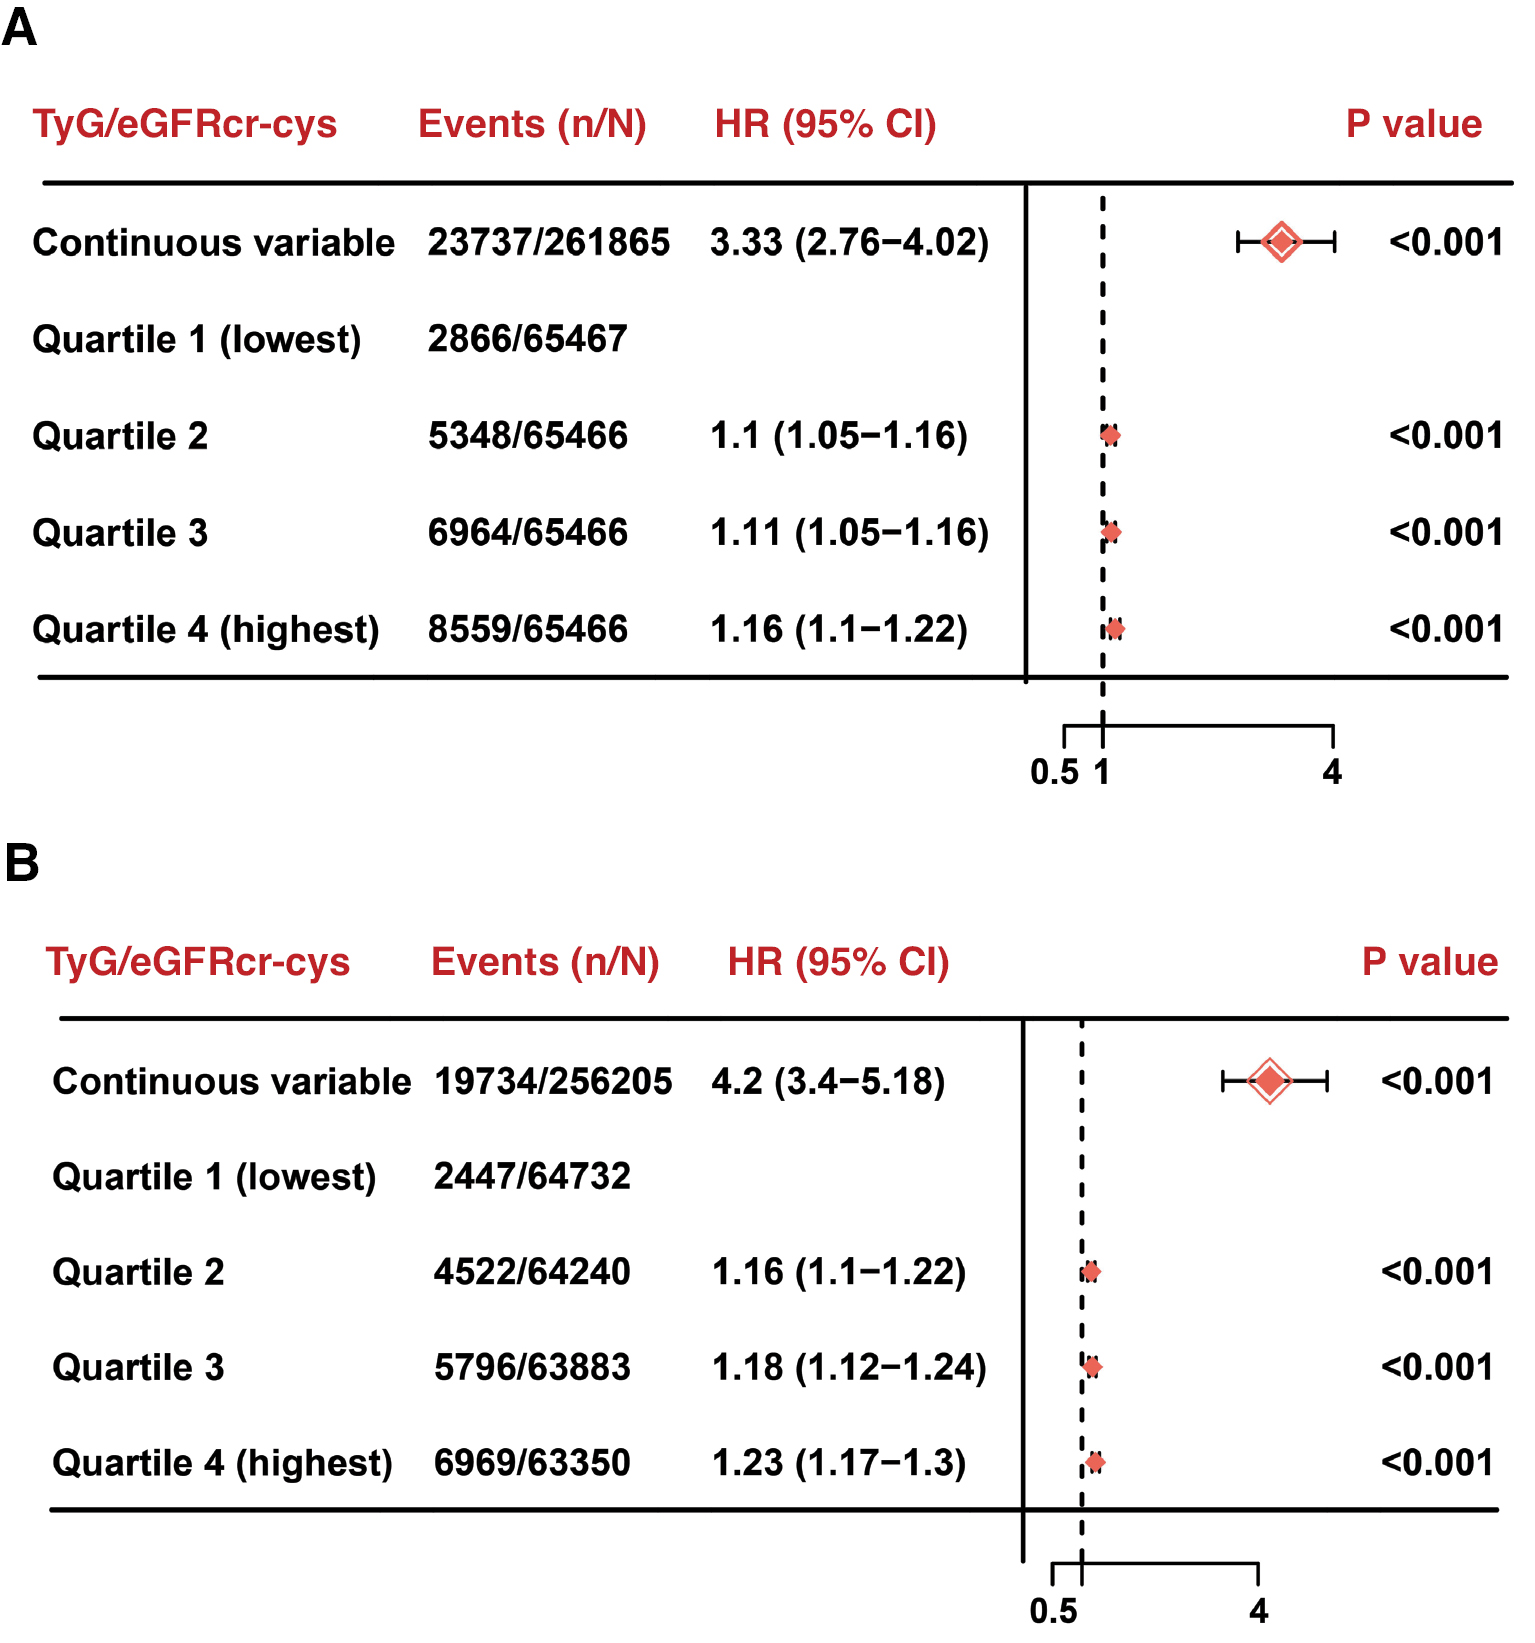
Elevated levels of the TyG index and the TyG:eGFRcr-cys ratio have been linked to an increased risk of CVD, CHD, and stroke based on an unadjusted COX regression analysis. This association was shown to persist in the model adjusted for age, race, gender, employment status, educational level, and level of deprivation (referred to here as Model 1). Following extensive covariate adjustment, the HRs (95% CIs) for total CVD in the highest versus lowest quartiles were 1.15 (1.1–1.21), 1.17 (1.12–1.23), and 1.24 (1.18–1.3), respectively, for the TyG:eGFRcr-cys ratio. The HRs (95% CIs) for CHD in the highest versus lowest quartiles were 1.18 (1.12–1.24), 1.23 (1.17–1.3), and 1.3 (1.23–1.37) for the TyG:eGFRcr-cys ratio. The HRs (95% CIs) in the highest versus lowest quartiles for stroke were 1.04 (0.95–1.15), 0.97 (0.88–1.07), and 1.05 (0.96–1.16) for the TyG:eGFRcr-cys ratio (Table 2).
Table 2 Prospective associations between the TyG:eGFRcr-cys ratio and risk of cardiovascular diseases in the UK Biobank
| Characteristics | n/N | HR_CI_1 | P_value_1 | HR_CI_2 | P_value_2 | HR_CI_3 | P_value_3 | |
|---|---|---|---|---|---|---|---|---|
| 1 | CVD | |||||||
| 2 | Quartile 1 (lowest) | 2866/65,467 | Reference | – | Reference | – | Reference | – |
| 3 | Quartile 2 | 5348/65,466 | 1.2 (1.15–1.26) | < 0.001 | 1.13 (1.08–1.18) | < 0.001 | 1.15 (1.1–1.21) | < 0.001 |
| 4 | Quartile 3 | 6964/65,466 | 1.29 (1.23–1.35) | < 0.001 | 1.16 (1.1–1.21) | < 0.001 | 1.17 (1.12–1.23) | < 0.001 |
| 5 | Quartile 4 (highest) | 8559/65,466 | 1.44 (1.37–1.51) | < 0.001 | 1.26 (1.2–1.32) | < 0.001 | 1.24 (1.18–1.3) | < 0.001 |
| 6 | CHD | |||||||
| 7 | Quartile 1 (lowest) | 2233/65,467 | Reference | – | Reference | – | Reference | – |
| 8 | Quartile 2 | 4256/65,466 | 1.24 (1.18–1.31) | < 0.001 | 1.16 (1.1–1.22) | < 0.001 | 1.18 (1.12–1.24) | < 0.001 |
| 9 | Quartile 3 | 5710/65,466 | 1.37 (1.3–1.45) | < 0.001 | 1.22 (1.15–1.28) | < 0.001 | 1.23 (1.17–1.3) | < 0.001 |
| 10 | Quartile 4 (highest) | 7047/65,466 | 1.54 (1.46–1.62) | < 0.001 | 1.32 (1.25–1.39) | < 0.001 | 1.3 (1.23–1.37) | < 0.001 |
| 11 | STROKE | |||||||
| 12 | Quartile 1 (lowest) | 735/65,467 | Reference | – | Reference | – | Reference | – |
| 13 | Quartile 2 | 1323/65,466 | 1.06 (0.97–1.17) | 0.2 | 1.03 (0.94–1.13) | 0.57 | 1.04 (0.95–1.15) | 0.37 |
| 14 | Quartile 3 | 1588/65,466 | 1.01 (0.92–1.11) | 0.83 | 0.96 (0.87–1.05) | 0.35 | 0.97 (0.88–1.07) | 0.55 |
| 15 | Quartile 4 (highest) | 2025/65,466 | 1.14 (1.03–1.25) | 0.008 | 1.06 (0.96–1.17) | 0.23 | 1.05 (0.96–1.16) | 0.29 |
Model 1: adjusted for age, race, gender, employment status, educational level, and level of deprivation.
Model 2: adjusted for age, race, gender, employment status, educational level, level of deprivation, alcohol consumption, BMI, smoking status, and MET.
Model 3: further adjusted for age, race, gender, employment status, educational level, level of deprivation, alcohol consumption, BMI, smoking status, MET, cholesterol-lowering medication (yes or no), antihypertensive medication (yes or no), and insulin (yes or no).
In addition, each incremental SD increase in the TyG:eGFRcr-cys ratio was associated with higher risks of CVD, CHD, and stroke in the fully adjusted models (Model 3), corresponding to estimated increases of 249% [HR, 3.49; 95% CI, 2.94–4.15], 250% [HR, 3.50; 95% CI, 2.92–4.20], and 165% [HR, 2.65; 95% CI, 1.80–3.90], respectively (Figure 2A). Similarly, each incremental SD increase in the TyG index was linked to a notable rise in the risk of CVD, CHD, and stroke with estimated increases of 20% [HR (95% CI): 1.2 (1.17–1.23)], 24% [HR (95% CI): 1.24 (1.21–1.28)], and 4% [HR (95% CI): 1.04 (0.99–1.1)], respectively, in fully adjusted models (Model 3; Figure 2B). A similar conclusion was drawn by Li et al. (2022) in a study involving a Chinese population [36]. Conversely, each incremental SD increase in the eGFRcr-cys was linked to a significant reduction in the risk of CVD, CHD, and stroke with estimated decreases of 3% [HR (95% CI): 0.97 (0.96–0.98)], 3% [HR (95% CI): 0.97 (0.96–0.98)], and 2% [HR (95% CI): 0.98 (0.96–1)], respectively, in fully adjusted models (Model 3; Figure 2C). It is noteworthy that similar conclusions were drawn by Cui et al. (2023) in a Chinese population [37].
Figure 2 Association analysis of the TyG index, eGFRcr-cys, and TyG:eGFRcr-cys ratio with cardiovascular events. Association of the TyG:eGFRcr-cys ratio (A), TyG index (B), and eGFRcr-cys (C) with the risk of cardiovascular disease, coronary heart disease, and stroke across three different models. The results are presented as HRs with 95% CIs. Model definitions were identical to those described in the Methods section.
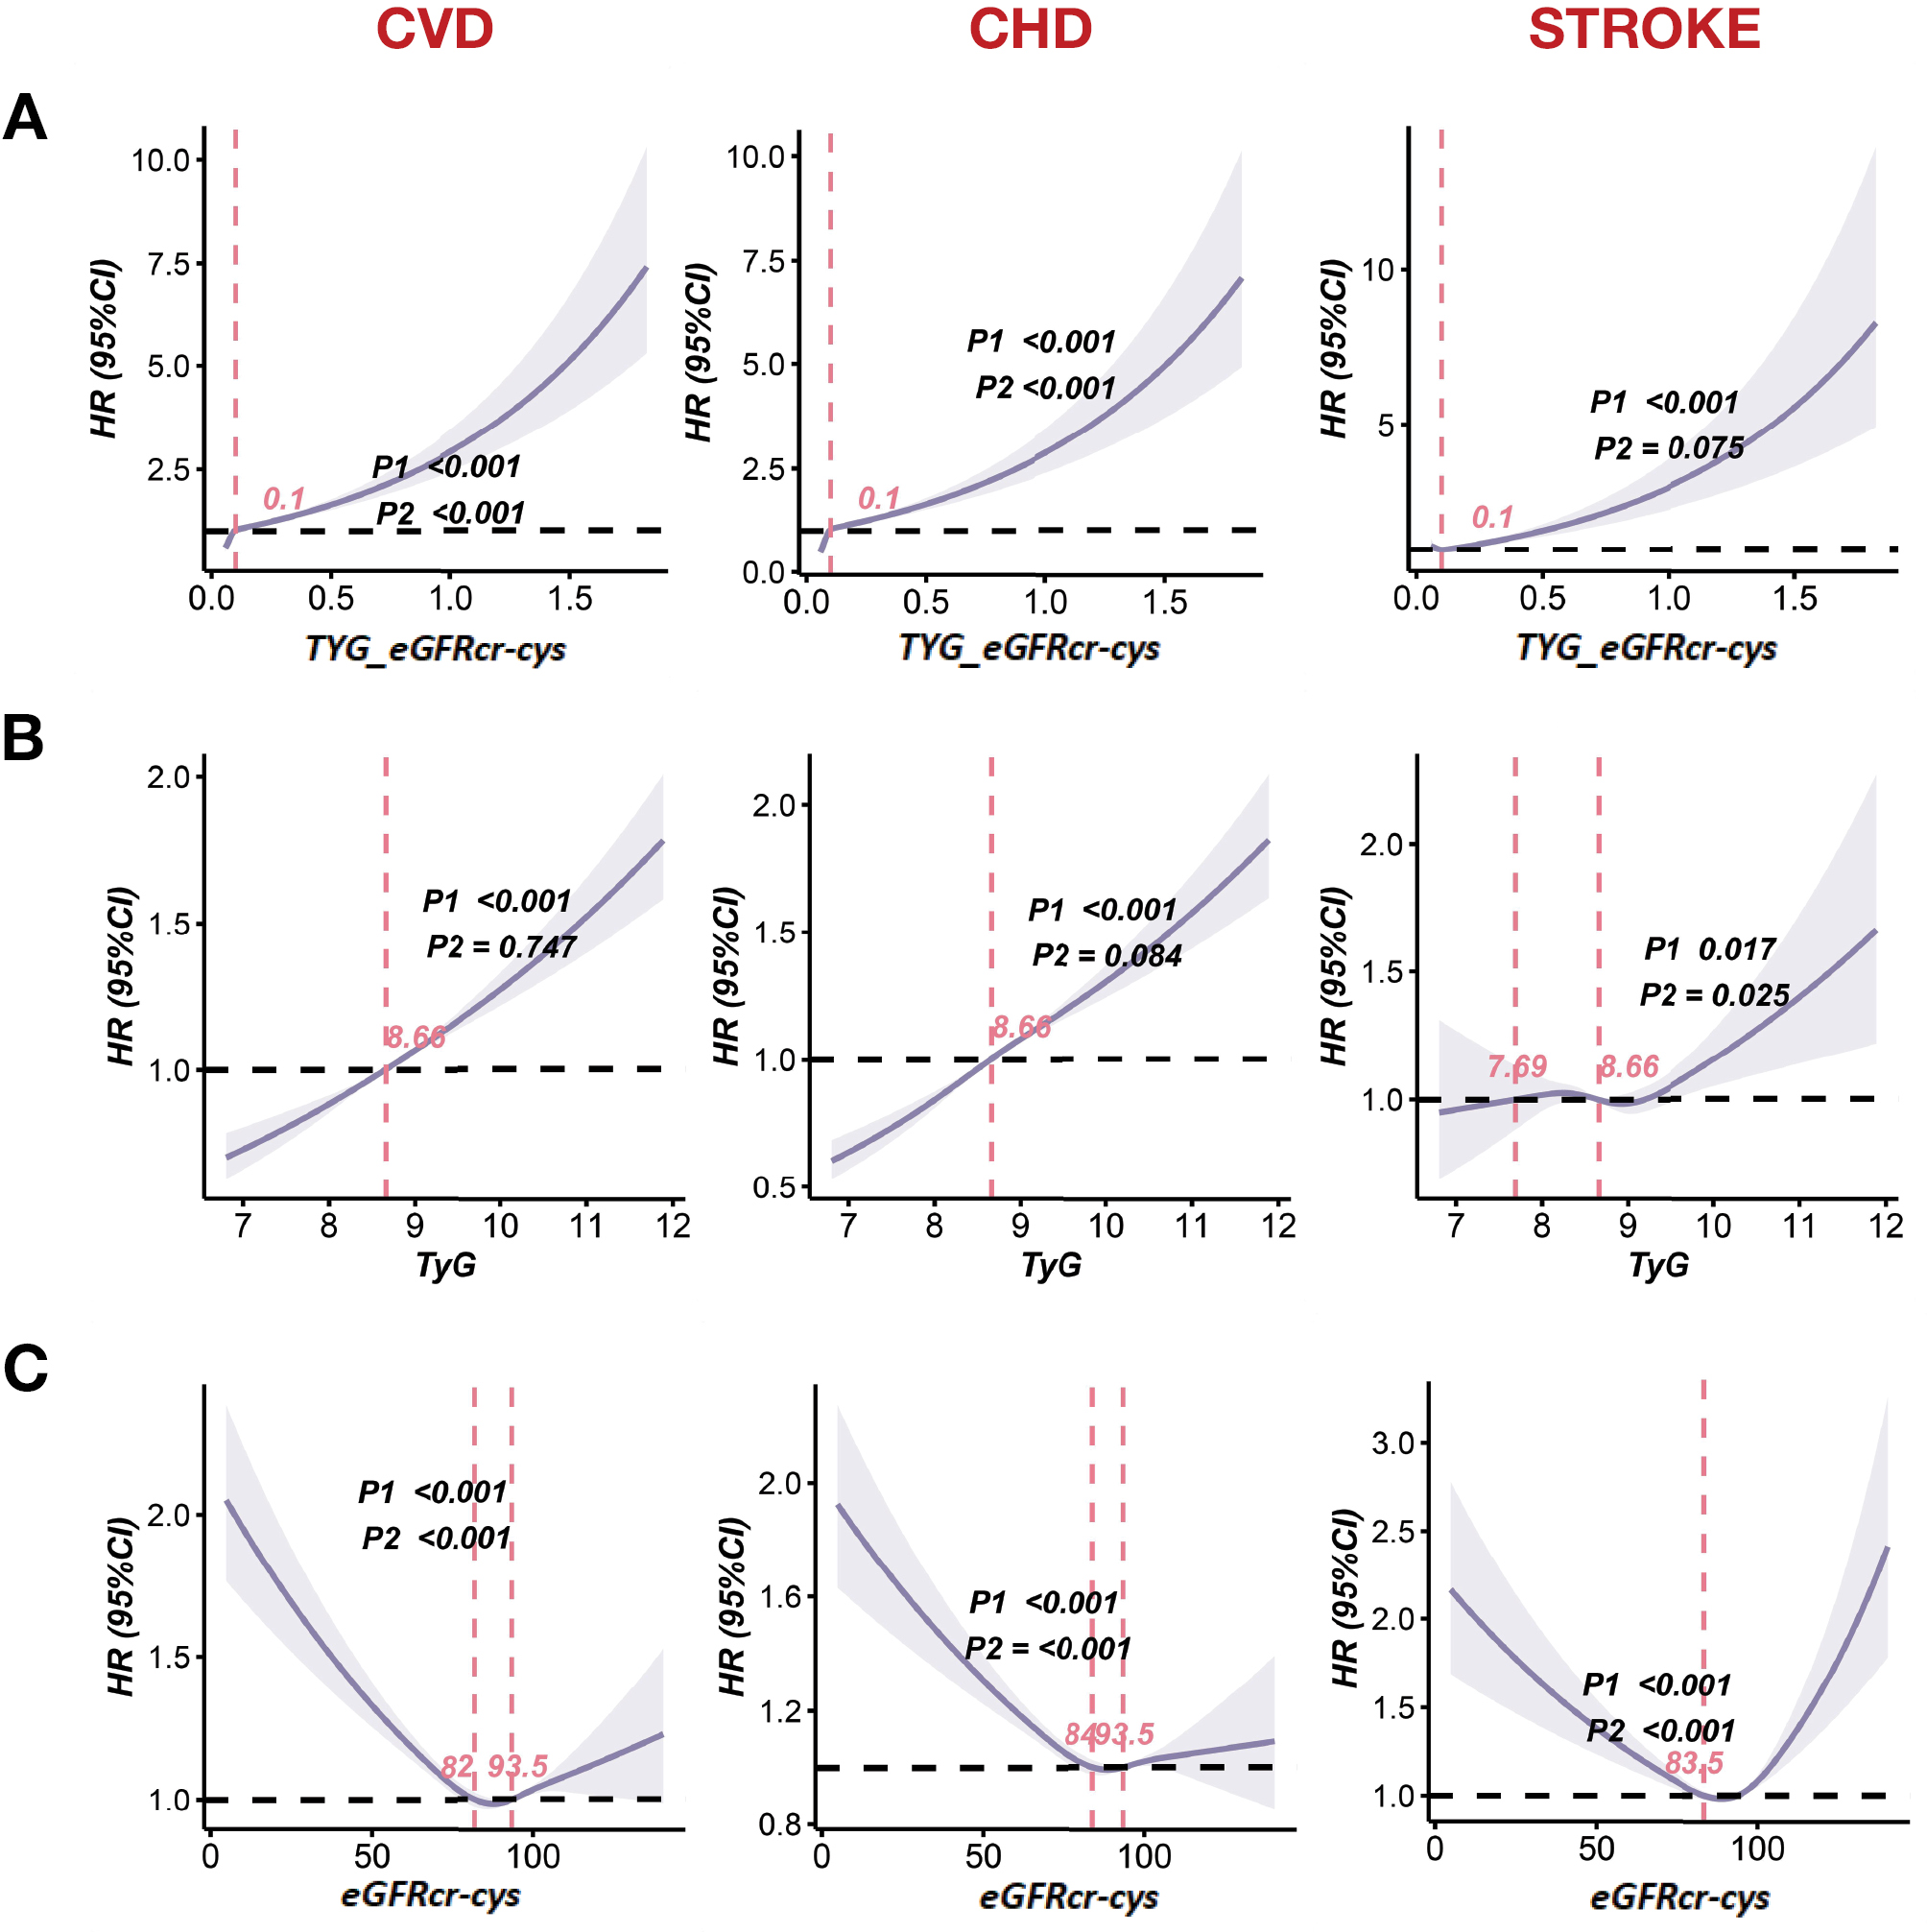
RCS analysis between the TyG index, the TyG:eGFRcr-cys ratio, and the eGFRcr-cys
RCS analysis was used to investigate the non-linear relationships between the TyG:eGFRcr-cys ratio, the TyG index, and the eGFRcr-cys in relation to CVD, CHD and stroke, as illustrated in Figure 3. Non-linear associations between the TyG:eGFRcr-cys ratio and CVD (P-value for the overall model < 0.001 and P-value for the non-linear model < 0.001) as well as CHD (P-value for the overall model < 0.001 and P-value for the non-linear model < 0.001) were observed in multivariable-adjusted RCS analyses (Figure 3A). Notably, the inflection points and the overall trend of the curves were consistent. Although a non-linear association between the TyG:eGFRcr-cys ratio and stroke was not statistically significant (P-value for the overall model < 0.001 and P-value for the non-linear model = 0.075), the inflection point (0.1) remained evident (Figure 3A). Furthermore, it was noted that no non-linear relationship exists between the TyG index and CVD (P-value for the overall model < 0.001 and P-value for the non-linear model = 0.747) or CHD (P-value for the overall model < 0.001 and P-value for the non-linear model = 0.084), a finding consistent with the results reported by Zhang et al. (2024) in non-alcoholic fatty liver disease (NAFLD) populations [38]. However, Liang et al. (2024) demonstrated a non-linear association between the TyG index and CVD in the U.S. population aged > 60 years [39]. All findings indicated a positive correlation between an elevated TyG index and a higher risk of developing CVD. In addition, a U-shaped curve was noted between the eGFRcr-cys and the risks of CVD, CHD, and stroke (P-value for the overall model < 0.001 and P-value for the non-linear model < 0.001; Figure 3C). As the eGFRcr-cys decreased, the risk of CVD, CHD, and stroke exhibited a gradual decline, reaching minimum eGFRcr-cys values of 82, 84, and 83.5 mL/min/1.73 m2, respectively. Nevertheless, the standard definition of CKD is an eGFRcr-cys < 60 mL/min/1.73 m2.
Figure 3 Multivariable-adjusted hazard ratios and 95% confidence intervals for cardiovascular disease, coronary heart disease, and stroke associated with the TyG:eGFRcr-cys ratio, TyG index, and eGFRcr-cys. (A) TyG:eGFRcr-cys ratio. (B) TyG index. (C) eGFRcr-cys. P1 refers to the overall significance of the association, while P2 specifically tests for non-linearity in the association. Model definitions were identical to those described in the Methods section.
Subgroup analysis
A positive correlation between the TyG:eGFRcr-cys ratio and the risk of developing CVD persisted across most strata in the subgroup analysis. However, significant interactions were identified within the age (P value for interaction = 0.002), gender (P value for interaction = 0.003), race (P value for interaction = 0.016), employment status (P value for interaction = 0.002), and deprivation (P value for interaction < 0.001) subgroup (Table 3).
Table 3 Multivariable-adjusted hazard ratios and 95% confidence intervals for CVD according to the TyG:eGFRcr-cys ratio in various subgroups
| Subgroup | HR_CVD | P_CVD | Pinter | |
|---|---|---|---|---|
| 1 | Age | 0.002 | ||
| 2 | Young adult | 4.75 (3.86–5.85) | < 0.001 | |
| 3 | Old adult | 3.63 (2.95–4.49) | < 0.001 | |
| 4 | Gender | 0.003 | ||
| 31 | Male | 3.25 (2.63–4.02) | < 0.001 | |
| 41 | Female | 4.33 (3.17–5.91) | < 0.001 | |
| 110 | Race | 0.016 | ||
| 5 | White | 4.1 (3.36–4.99) | < 0.001 | |
| 6 | Others | 2.33 (1.59–3.43) | < 0.001 | |
| 111 | Education | 0.495 | ||
| 7 | College or university degree | 3.36 (2.58–4.38) | < 0.001 | |
| 8 | Others | 3.52 (2.81–4.43) | < 0.001 | |
| 112 | Employment | 0.002 | ||
| 9 | Employed | 5.02 (3.61–6.98) | < 0.001 | |
| 10 | Unemployed | 3.13 (2.53–3.86) | < 0.001 | |
| 113 | Deprivation | < 0.001 | ||
| 11 | High deprivation | 3.14 (2.54–3.88) | < 0.001 | |
| 12 | Low deprivation | 6.09 (4.4–8.44) | < 0.001 | |
| 114 | Smoker | 0.923 | ||
| 13 | Current | 5.09 (2.41–10.77) | < 0.001 | |
| 14 | Ever | 3.2 (2.41–.25) | < 0.001 | |
| 15 | Never | 3.56 (2.83–4.49) | < 0.001 | |
| 115 | Alcohol consumption | 0.471 | ||
| 16 | Frequently | 3.69 (2.41–5.67) | < 0.001 | |
| 17 | Occasionally | 3.8 (3.03–4.76) | < 0.001 | |
| 18 | Never | 2.97 (2.05–4.31) | < 0.001 | |
| 116 | BMI | 0.176 | ||
| 19 | Obese | 3.7 (3.05–4.51) | < 0.001 | |
| 20 | Non-obese | 3.96 (2.76–5.69) | < 0.001 | |
| 117 | MET | 0.232 | ||
| 21 | Low | 3.28 (2.52–4.27) | < 0.001 | |
| 22 | Moderate | 3.08 (2.29–4.14) | < 0.001 | |
| 23 | High | 5.32 (3.58–7.89) | < 0.001 | |
Sensitivity analysis
A sensitivity analysis was performed to evaluate the robustness of the primary findings by incorporating additional covariates, including SBP, HbA1C, CRP, and total cholesterol, into the model. The results remained consistent, indicating that the observed effect was robust to the inclusion of these potential confounders (Figure 4A). Participants who developed the disease or were lost to follow-up within 3 years of baseline were further excluded to evaluate the effect on the results. Excluding these participants did not significantly alter the results, suggesting that the results are robust (Figure 4B).
Figure 4 Sensitivity analyses of the association between the TyG:eGFRcr-cys ratio and cardiovascular disease. (A) Multivariable-adjusted hazard ratios and 95% confidence intervals after additional adjustment for SBP, HbA1c, and CRP. (B) Sensitivity analysis after excluding participants who developed CVD or were lost to follow-up within 3 years of baseline.
External validation
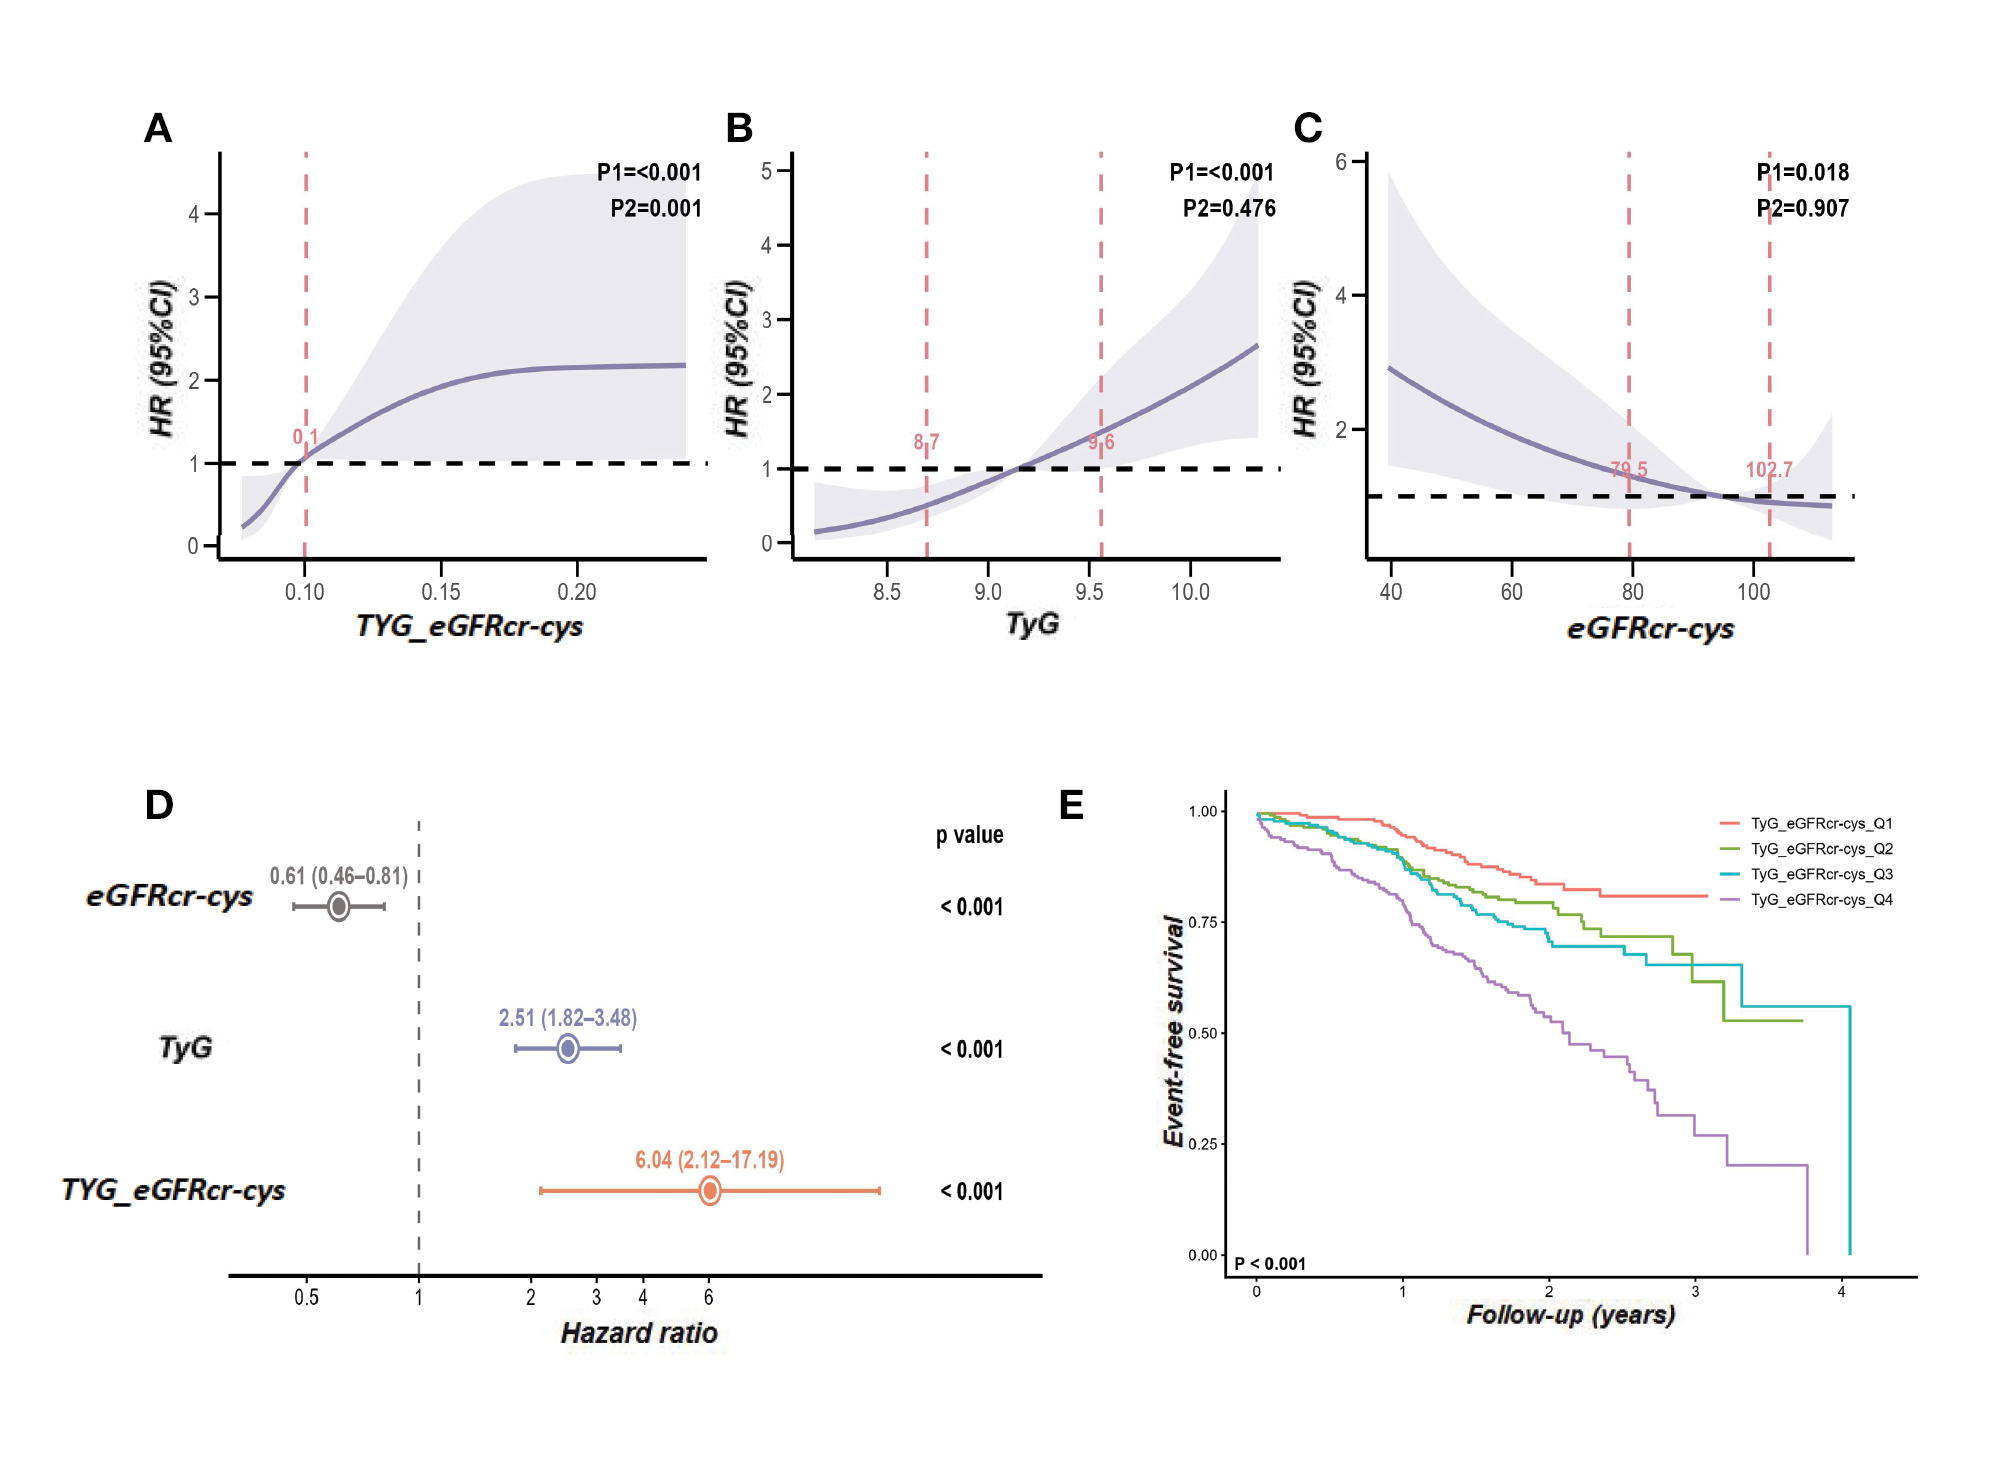
RCS analyses in the external cohort showed a dose–response association between the TyG:eGFRcr-cys ratio and incident MACE (Figure 5A) with a similar positive pattern for the TyG index (Figure 5B), whereas a higher eGFRcr-cys was associated with a lower risk of MACE (Figure 5C). The TyG:eGFRcr-cys ratio remained significantly associated with MACE in the fully adjusted model (HR per 1-SD increase, 6.04; 95% CI, 2.12–17.19; P < 0.001) with the TyG index (HR, 2.51; 95% CI, 1.82–3.48; P < 0.001) and an inverse association for the eGFRcr-cys (HR, 0.61; 95% CI, 0.46–0.81; P < 0.001; Figure 5D). Kaplan–Meier curves further demonstrated clear separation in event-free survival across the TyG:eGFRcr-cys ratio quartiles (log-rank P < 0.001; Figure 5E).
Figure 5 External validation of the the TyG:eGFRcr-cys ratio in an independent clinical cohort. (A–C) Restricted cubic spline plots showing adjusted hazard ratios (HRs) and 95% CIs for MACE across the TyG:eGFRcr-cys ratio (A), TyG index (B), and eGFRcr-cys (C). Dashed vertical lines indicate the 25th and 75th percentiles; the horizontal dashed line denotes HR = 1. P1 indicates overall association and P2 indicates non-linearity. (D) Forest plot of HRs (95% CIs) per 1-SD increase in the TyG:eGFRcr-cys ratio, TyG index, and eGFRcr-cys for MACE. (E) Kaplan–Meier curves for event-free survival by the TyG:eGFRcr-cys ratio quartiles with log-rank P value.
Dynamic network biomarker analysis suggested a potential transition stage during CVD risk progression
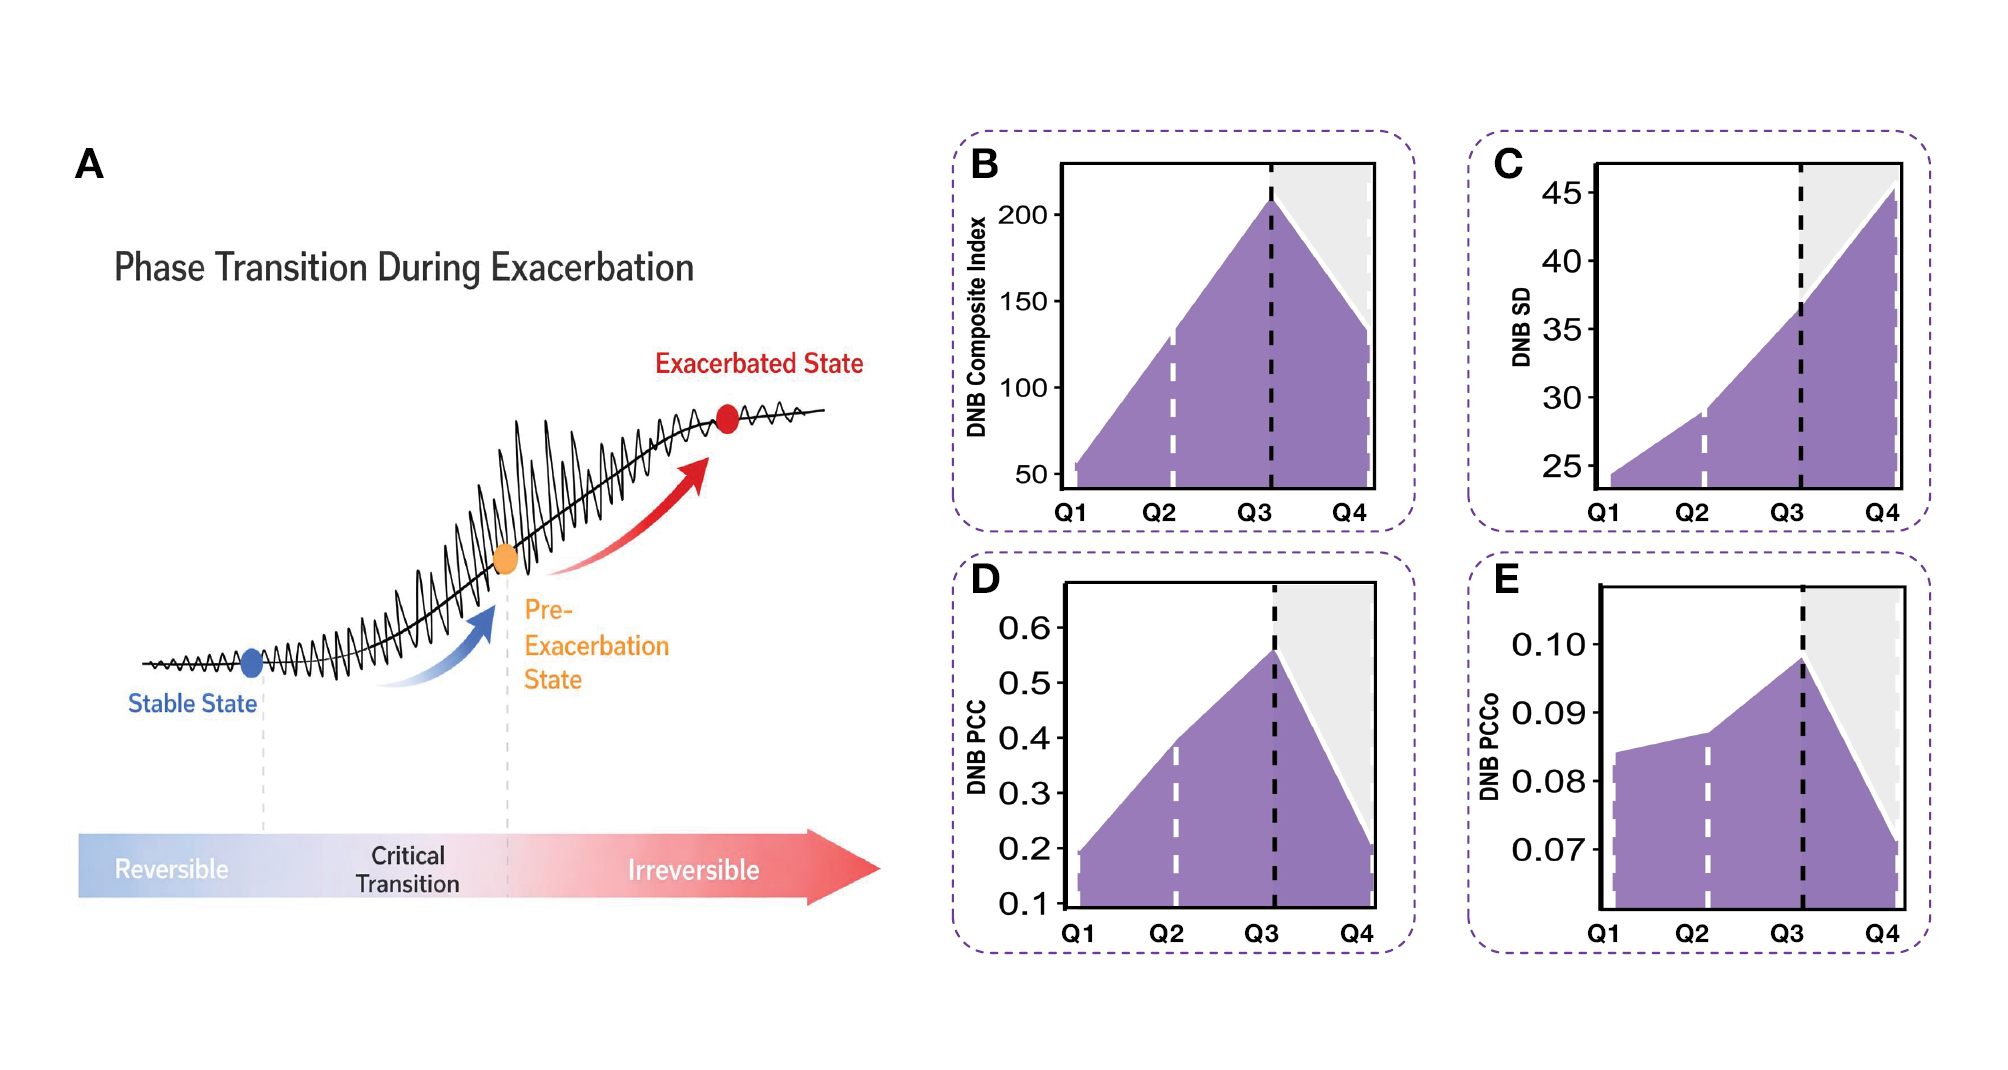
Participants were divided into four groups (Q1–Q4) to further explore the dynamic progression pattern across the TyG/eGFRcr-cys ratio-based risk strata and DNB analysis was performed to determine the potential transition stage preceding overt CVD progression. The conceptual disease trajectory followed a non-linear phase-transition pattern, shifting from a relatively stable state to a pre-exacerbation stage, then to a more advanced stage (Figure 6A). The DNB composite index increased from Q1 to Q3, then declined in Q4 with the highest value in Q3 (Figure 6B). The DNB SD showed a progressive increase across the four groups and reached a maximum in Q4 (Figure 6C). In contrast, both the DNB PCC and DNB PCCo increased from Q1 to Q3, then decreased in Q4 with peaks occurring at Q3 (Figure 6D-E). Taken together, although individual DNB components exhibited slightly different trajectories, the overall pattern suggested that Q3 may represent a potential transition stage during cardiovascular risk progression based on the TyG:eGFRcr-cys ratio.
Figure 6 Dynamic network biomarker analysis across the TyG:eGFRcr-cys ratio-based risk groups. (A) Schematic illustration of the phase transition during cardiovascular risk progression, showing the shift from a relatively stable state to a pre-exacerbation stage, then to a more advanced stage. (B) DNB composite index across the four TyG:eGFRcr-cys ratio quartile groups (Q1–Q4). (C) DNB standard deviation (SD) across the four quartile groups. (D) Intra-module Pearson correlation coefficient (PCC) across the four quartile groups. (E) Out-of-module Pearson correlation coefficient (PCCo) across the four quartile groups.
Discussion
CVD remains the leading cause of death worldwide and is responsible for a substantial proportion of premature mortality and years of life lost [40, 41]. CKD and IR are both well-established risk factors for CVD. However, few studies have evaluated the combined effect within a single integrated marker. In this large prospective cohort study a higher TyG:eGFRcr-cys ratio was shown to be significantly associated with an increased risk of incident CVD, particularly overall CVD and CHD. In contrast, the association with stroke was weaker and less consistent across analyses. RCS analysis further demonstrated non-linear associations between the TyG:eGFRcr-cys ratio and CVD and CHD, whereas a U-shaped association was noted between the eGFRcr-cys and the risks of CVD, CHD, and stroke. Sensitivity analyses yielded similar results, supporting the robustness of the findings. To our knowledge, this is the largest prospective cohort study to investigate the association between the TyG:eGFRcr-cys ratio and CVD outcomes using UK Biobank data.
Several studies have indicated that IR is an independent risk factor for CVD [42, 43]. From a mechanistic perspective, IR has been shown to induce elevated levels of inflammation and oxidative stress. In addition, IR contributes to lipid metabolism disorders, including elevated triglycerides and LDL-C levels, as well as reduced HDL-C levels, all of which promote the initiation of atherosclerosis [44]. Moreover, several mechanisms underlying IR have been identified, including increased fatty acid utilization, reduced mitochondrial oxidative capacity, mitochondrial dysfunction, decreased cardiac efficiency, oxidative stress, accumulation of bioactive lipids, inflammation, increased apoptosis, disrupted calcium metabolism and signaling, and myocardial fibrosis [45]. Collectively, these factors contribute to heightened cardiac vulnerability, leading to an elevated risk of heart failure. IR has been shown to mediate aberrant nitric oxide (NO) release, which subsequently leads to various pathologic processes, including inflammation, oxidative stress, endothelial dysfunction, and vascular damage [46–49]. In addition, alterations in the expression of stress proteins, such as heat shock protein 70 (HSP70) and HSP72, are closely linked to NO regulatory mechanisms, resulting in impaired vascular protective effects [50–55]. Furthermore, extensive evidence from multiple studies has suggested that IR is associated with mitochondrial oxidative dysfunction and morphologic abnormalities [56, 57]. IR is associated with increased mitochondrial reactive oxygen species (ROS) production due to the formation of hydroxyl radicals (OH−), singlet oxygen (O), superoxide anion (O2−), NO, and peroxynitrite (ONOO−), ultimately leading to endothelial dysfunction [58, 59]. Finally, platelets from patients with IR exhibited increased production of tissue factor, which is commonly linked to thrombosis and inflammation [60]. The TyG index has been identified as a reliable alternative biomarker of IR. Recently, a considerable number of studies have provided robust statistical evidence suggesting that the TyG index is associated with the development and prognosis of CVD. Many previous studies have demonstrated that the TyG index is a highly relevant predictor of CVD development, which aligned with the findings in the current study [61–64].
Moreover, the TyG index, derived from fasting triglyceride and glucose levels, serves as an indicator of vascular injury. Some studies have suggested that saturated fatty acids, stored as triglycerides and glucose, may contribute to vascular inflammation, a key factor in the development of vertebral arteriosclerosis [65–69]. Given the considerable complexity of CVD, evaluating the TyG index in isolation would be overly simplistic. A study also showed that the TyG index is not the most effective marker for identifying all-cause and CVD mortality risk in the general population. In contrast, some complex indices, like METS-IR, have demonstrated greater effectiveness in predicting CVD risk compared to simpler indices [70]. CKD, defined by a reduced eGFRcr-cys, is an independent risk factor for CVD. Donfrancesco et al. [23] strongly suggested that in an elderly general population with a low CVD risk and a low prevalence of reduced renal filtration, even a modest reduction in the eGFRcr-cys is associated with all-cause mortality and CVD incidence, highlighting the potential benefit of incorporating the eGFRcr-cys into risk prediction for this population. A reduced eGFRcr-cys is causally related to decreases in ascending aorta diameter, proximal pulmonary artery diameter, right atrial size, left ventricular stroke volume, and right ventricular volumes [71]. Consequently, the TyG:eGFRcr-cys ratio was used herein as an indicator of vascular injury to develop a more effective and precise predictor of CVD risk.
Furthermore, elevated TyG:eGFRcr-cys ratios were significantly associated with an increased risk of CVD, CHD, and stroke with adjustments for several confounding factors, indicating that the TyG:eGFRcr-cys ratio is a key biomarker for cardiovascular health assessment. RCS analysis revealed a synergistic effect between the TyG index and the eGFRcr-cys on CVD risk. Elevated TyG levels were associated with an increased risk of IR, whereas a reduced eGFRcr-cys was linked to a greater likelihood of impaired kidney function, both of which contributed to an increased risk of CVD. Importantly, we replicated the main association in an independent single-center clinical cohort using MACE as the outcome, supporting the robustness and generalizability of the TyG:eGFRcr-cys ratio across different populations and clinical settings. These findings were aligned with a previous study, which reported that the combination of a higher TyG index and a lower eGFRcr-cys level resulting in an elevated TyG:eGFRcr-cys ratio was associated with the highest risk of CVD [37].
In the current study the subgroup analysis revealed significant interactions between the TyG:eGFRcr-cys ratiio and various demographic and socioeconomic factors, including age, gender, race, employment status, and level of deprivation. These findings suggested that the association between an elevated TyG:eGFRcr-cys ratio and the risk of CVD was not uniform across all populations but was influenced by specific characteristics. The positive correlation between the TyG:eGFRcr-cys ratio and CVD risk was more pronounced in female, White, and older participants. These findings may be associated with estrogen insufficiency and the resultant visceral obesity observed after menopause [72]. Some studies have suggested that the primary factors contributing to CVD vary by race, primarily due to environmental factors rather than genetic predispositions, including disparities in socioeconomic status and access to healthcare resources [73]. Indeed, metabolic alterations, lifestyle factors, and genetic predispositions might contribute to this disparity [74]. The aforementioned characteristics revealed a series of high-risk populations for CVD, necessitating the implementation of early prevention strategies.
In general, two major mechanisms were considered to contribute to the development of CVD in CKD. Hormones, enzymes, and cytokines released from the kidneys lead to characteristic changes in the vasculature [75]. In contrast, factors associated with CKD and hemodynamic mediators contribute to cardiac damage [75]. In addition to traditional risk factors, such as proteinuria, abnormal blood glucose levels, and dyslipidemia, CKD contributes to CVD through three primary mechanisms: vascular calcification; inflammation; and myocardial alterations. Central arterial vessels showed accelerated calcification in patients with CKD compared to individuals without kidney disease, especially in patients with diabetes. This finding was accompanied by increased pulse wave velocity, earlier pulse wave reflection, and greater cardiac afterload [76]. Taken together, these changes represent significant risk factors for heart failure. Moreover, cardiac valve calcification results in the necessity for intervention due to the development of valvular stenosis [75]. The inflammatory state in patients with CKD is associated with various infections, oxidative stress from the accumulation of advanced glycation end products (AGEs), metabolic acidosis, impaired cytokine clearance, and IR, all of which contribute to an increased risk of CVD [77]. The primary myocardial alterations identified in patients with CKD or end-stage renal disease (ESRD) include pathologic myocardial fibrosis and cardiac hypertrophy [78]. The pathogenic factors were categorized into three groups: (1) afterload mediators; (2) preload mediators; and (3) mediators that are neither afterload nor preload [79]. In fact, it was challenging to categorize the impact of preload and afterload mediators in ESRD patients due to the intricate interrelationships. The external validation cohort was relatively small and from a single center using MACE as the endpoint, and a limited set of covariates, which may affect precision and generalizability. Moreover, supplementary evidence indicated that insufficient salt restriction and ultrafiltration may be substantial contributing factors [80, 81].
This study had several limitations. First, the cohort from the UK Biobank primarily consisted of relatively healthy individuals, which introduced selection bias and limited the generalizability of the findings to more diverse populations. Second, the age range of participants, predominantly between 40 and 69 years, restricted the applicability of the results to younger or older populations. Third, the reliance on self-reported medical history introduced recall bias. In addition, some potential confounding factors were not accounted for in the analysis, which could have influenced the observed associations. Finally, the absence of genome-wide association study (GWAS) data limited the ability to perform a causal relationship study.
Clinically, a higher TyG:eGFRcr-cys ratio may be interpreted as reflecting the coexistence of greater IR and reduced renal function. Because both domains are mechanistically linked to CVD, the ratio may serve as a simple integrative marker for identifying individuals with an unfavorable cardiometabolic–renal profile. However, the data do not support a universal clinical cut-off and the ratio should currently be viewed as a complementary marker rather than a replacement for established CVD risk scores. In addition, although the TyG:eGFRcr-cys ratio was significantly associated with CVD outcomes, we did not evaluate whether TyG:eGFRcr-cys ratio improves discrimination or reclassification beyond established CVD risk factors or existing risk scores. Future studies should assess incremental predictive performance using measures, such as the C-statistic, net reclassification improvement (NRI), and integrated discrimination improvement (IDI).
In this large prospective cohort, a higher TyG:eGFRcr-cys ratio was associated with an increased risk of CVD, particularly overall CVD and CHD. These findings suggested that the TyG:eGFRcr-cys ratio may serve as a simple integrative marker of cardiometabolic and renal risk, although the incremental predictive value beyond established risk factors requires further study.
Data availability statement
The UK Biobank data used in this study are available from the UK Biobank upon application and approval under application number 102158. The data from the external validation cohort are not publicly available because of institutional and patient privacy restrictions but may be made available from the corresponding author upon reasonable request and with permission from the relevant Ethics Committee.
Ethics statement
The UK Biobank study was approved by the North West Multi-Centre Research Ethics Committee (REC reference: 11/NW/03820) and all participants provided written informed consent prior to participation. This research was conducted using the UK Biobank resource under application number 102158. The external validation cohort study was conducted in accordance with the Declaration of Helsinki and approved by the Institutional Ethics Committee of the First Affiliated Hospital of Zhengzhou University (No. 2026-KY-0398). Written informed consent was obtained from all participants or waived by the Ethics Committee in accordance with local regulations, where applicable.
Author contributions
G.Z. and C.Y. contributed to study design, data collection, data analysis, manuscript drafting, and figure preparation. G.Z., B.Y., and F.Y. supervised the project. T.G., Z.Z., K.K., and Q.G. contributed to manuscript revision and language editing. S.C., W.H., F.Y., and B.Y. provided technical support and contributed to experimental optimization, data curation, and data preprocessing. All authors reviewed the manuscript, approved the final version, and agreed to be accountable for the content of the work.
Acknowledgment
This research was conducted using the UK Biobank resource under application number 102158. We thank all participants and staff of the UK Biobank for their valuable contributions. We also thank Editage for English language editing assistance. The Graphical Abstract and Figure 1 were created by using Biorender (https://www.biorender.com/),released under a Creative Commons Attribution-NonCommercial-NoDerivs 4.0 International license.
Conflict of interest
The authors declare that there are no conflicts of interest.
Supplementary materials
Supplementary Material can be downloaded from https://bio-integration.org/wp-content/uploads/2026/06/bioi20260017_Supplemental.zip.
Graphical abstract
Highlights
- TyG/eGFRcr-cys integrates insulin resistance and renal function into one marker.
- In 261,865 UK Biobank participants, higher TyG/eGFRcr-cys predicted increased CVD and CHD risk.
- Restricted cubic splines showed non-linear associations between TyG/eGFRcr-cys and cardiovascular outcomes.
- Associations were supported by sensitivity analyses and external validation in an independent clinical cohort.
- TyG/eGFRcr-cys may help identify individuals with unfavorable cardiometabolicrenal profiles.
In brief
This multicenter cohort study shows that a higher TyG/eGFRcr-cys ratio, integrating insulin resistance and renal function, is associated with increased cardiovascular disease risk, particularly coronary heart disease. Findings from UK Biobank were supported by sensitivity analyses and external validation, suggesting TyG/eGFRcr-cys as a simple complementary cardiometabolicrenal risk marker.
References
- World Health Organization. Cardiovascular diseases (CVDs). Available from: https://www.who.int/news-room/fact-sheets/detail/cardiovascular-diseases-(cvds). [Published on 31 Jul 2025. Accessed on 3 Jun 2026]
- GBD 2017 Causes of Death Collaborators. Global, regional, and national age-sex-specific mortality for 282 causes of death in 195 countries and territories, 1980–2017: a systematic analysis for the Global Burden of Disease Study 2017. Lancet 2018;392(10159):1736-88. [PMID: 30496103 DOI: 10.1016/s0140-6736(18)32203-7]
- Roth GA, Mensah GA, Johnson CO, Addolorato G, Ammirati E, et al. Global burden of cardiovascular diseases and risk factors, 1990–2019: update from the GBD 2019 study. J Am Coll Cardiol 2020;76(25):2982-3021. [PMID: 33309175 DOI: 10.1016/j.jacc.2020.11.010]
- Zuo Q, He L, Ma S, Zhang G, Zhai J, et al. Canagliflozin alleviates atherosclerosis progression through inflammation, oxidative stress, and autophagy in Western diet-fed ApoE −/− mice. Cardiovasc Innov Appl 2024;9(1):e981. [DOI: 10.15212/CVIA.2023.0093]
- Zhang T, Zhang G, Liu TD, Gu T, Yu F, et al. Circadian immunity and vascular inflammation in cardiovascular disease chronotherapy windows: time for a re-assessment. Med Res 2026. [DOI: 10.1002/mdr2.70052]
- Bornfeldt KE, Tabas I. Insulin resistance, hyperglycemia, and atherosclerosis. Cell Metab 2011;14(5):575-85. [PMID: 22055501 DOI: 10.1016/j.cmet.2011.07.015]
- Minh HV, Tien HA, Sinh CT, Thang DC, Chen CH, et al. Assessment of preferred methods to measure insulin resistance in Asian patients with hypertension. J Clin Hypertens (Greenwich) 2021;23(3):529-37. [PMID: 33415834 DOI: 10.1111/jch.14155]
- Simental-Mendía LE, Rodríguez-Morán M, Guerrero-Romero F. The product of fasting glucose and triglycerides as surrogate for identifying insulin resistance in apparently healthy subjects. Metab Syndr Relat Disord 2008;6(4):299-304. [PMID: 19067533 DOI: 10.1089/met.2008.0034]
- Tao LC, Xu JN, Wang TT, Hua F, Li JJ. Triglyceride-glucose index as a marker in cardiovascular diseases: landscape and limitations. Cardiovasc Diabetol 2022;21(1):68. [PMID: 35524263 DOI: 10.1186/s12933-022-01511-x]
- Shi W, Xing L, Jing L, Tian Y, Yan H, et al. Value of triglyceride-glucose index for the estimation of ischemic stroke risk: insights from a general population. Nutr Metab Cardiovasc Dis 2020;30(2):245-53. [PMID: 31744716 DOI: 10.1016/j.numecd.2019.09.015]
- Guo W, Zhu W, Wu J, Li X, Lu J, et al. Triglyceride glucose index is associated with arterial stiffness and 10-year cardiovascular disease risk in a Chinese population. Front Cardiovasc Med 2021;8:585776. [PMID: 33816569 DOI: 10.3389/fcvm.2021.585776]
- Su WY, Chen SC, Huang YT, Huang JC, Wu PY, et al. Comparison of the effects of fasting glucose, hemoglobin A1C, and triglyceride-glucose index on cardiovascular events in type 2 diabetes mellitus. Nutrients 2019;11(11):2838. [PMID: 31752391 DOI: 10.3390/nu11112838]
- Li S, Guo B, Chen H, Shi Z, Li Y, et al. The role of the triglyceride (triacylglycerol) glucose index in the development of cardiovascular events: a retrospective cohort analysis. Sci Rep 2019;9(1):7320. [PMID: 31086234 DOI: 10.1038/s41598-019-43776-5]
- Hong S, Han K, Park CY. The triglyceride glucose index is a simple and low-cost marker associated with atherosclerotic cardiovascular disease: a population-based study. BMC Med 2020;18(1):361. [PMID: 33234146 DOI: 10.1186/s12916-020-01824-2]
- Bertoluci MC, Quadros AS, Sarmento-Leite R, Schaan BD. Insulin resistance and triglyceride/HDLc index are associated with coronary artery disease. Diabetol Metab Syndr 2010;2(1):11. [PMID: 20181078 DOI: 10.1186/1758-5996-2-11]
- Thai PV, Tien HA, Van Minh H, Valensi P. Triglyceride glucose index for the detection of asymptomatic coronary artery stenosis in patients with type 2 diabetes. Cardiovasc Diabetol 2020;19(1):137. [PMID: 32919465 DOI: 10.1186/s12933-020-01108-2]
- Huang R, Wang Z, Chen J, Bao X, Xu N, et al. Prognostic value of triglyceride glucose (TyG) index in patients with acute decompensated heart failure. Cardiovasc Diabetol 2022;21(1):88. [PMID: 35641978 DOI: 10.1186/s12933-022-01507-7]
- Lee EY, Yang HK, Lee J, Kang B, Yang Y, et al. Triglyceride glucose index, a marker of insulin resistance, is associated with coronary artery stenosis in asymptomatic subjects with type 2 diabetes. Lipids Health Dis 2016;15(1):155. [PMID: 27633375 DOI: 10.1186/s12944-016-0324-2]
- Zhu Y, Liu K, Chen M, Liu Y, Gao A, et al. Triglyceride-glucose index is associated with in-stent restenosis in patients with acute coronary syndrome after percutaneous coronary intervention with drug-eluting stents. Cardiovasc Diabetol 2021;20(1):137. [PMID: 34238294 DOI: 10.1186/s12933-021-01332-4]
- Vallianou NG, Mitesh S, Gkogkou A, Geladari E. Chronic kidney disease and cardiovascular disease: is there any relationship? Curr Cardiol Rev 2019;15(1):55-63. [PMID: 29992892 DOI: 10.2174/1573403×14666180711124825]
- Kidney Disease: Improving Global Outcomes (KDIGO) CKD Work Group. KDIGO 2024 Clinical Practice Guideline for the evaluation and management of chronic kidney disease. Kidney Int 2024;105(4S):S117-314. [PMID: 38490803 DOI: 10.1016/j.kint.2023.10.018]
- Briasoulis A, Bakris GL. Chronic kidney disease as a coronary artery disease risk equivalent. Curr Cardiol Rep 2013;15(3):340. [PMID: 23338722 DOI: 10.1007/s11886-012-0340-4]
- Lees JS, Welsh CE, Celis-Morales CA, Mackay D, Lewsey J, et al. Glomerular filtration rate by differing measures, albuminuria and prediction of cardiovascular disease, mortality and end-stage kidney disease. Nat Med 2019;25(11):1753-60. [PMID: 31700174 DOI: 10.1038/s41591-019-0627-8]
- Donfrancesco C, Palleschi S, Palmieri L, Rossi B, Lo Noce C, et al. Estimated glomerular filtration rate, all-cause mortality and cardiovascular diseases incidence in a low risk population: the MATISS study. PLoS One 2013;8(10):e78475. [PMID: 24147135 DOI: 10.1371/journal.pone.0078475]
- Elliott P, Peakman TC; UK Biobank. The UK Biobank sample handling and storage protocol for the collection, processing and archiving of human blood and urine. Int J Epidemiol 2008;37(2):234-44. [PMID: 18381398 DOI: 10.1093/ije/dym276]
- Fritz J, Bjørge T, Nagel G, Manjer J, Engeland A, et al. The triglyceride-glucose index as a measure of insulin resistance and risk of obesity-related cancers. Int J Epidemiol 2020;49(1):193-204. [PMID: 30945727 DOI: 10.1093/ije/dyz053]
- Levey AS, Stevens LA, Schmid CH, Zhang YL, Castro AF 3rd, et al. A new equation to estimate glomerular filtration rate. Ann Intern Med 2009;150(9):604-12. [PMID: 19414839 DOI: 10.7326/0003-4819-150-9-200905050-00006]
- Tyrrell J, Jones SE, Beaumont R, Astley CM, Lovell R, et al. Height, body mass index, and socioeconomic status: mendelian randomisation study in UK Biobank. BMJ 2016;352:i582. [PMID: 26956984 DOI: 10.1136/bmj.i582]
- Craig CL, Marshall AL, Sjöström M, Bauman AE, Booth ML, et al. International physical activity questionnaire: 12-country reliability and validity. Med Sci Sports Exerc 2003;35(8):1381-95. [PMID: 12900694 DOI: 10.1249/01.MSS.0000078924.61453.FB]
- Ferdowsi M, Goh CH, Liu H, Tse G, Hui JMH, et al. Clinical application of artificial intelligence in the diagnosis, prediction, and classification of coronary heart disease. Cardiovasc Innov Appl 2025;10(1):e976. [DOI: 10.15212/CVIA.2025.0009]
- Lopez-Jaramillo P, Gomez-Arbelaez D, Martinez-Bello D, Abat MEM, Alhabib KF, et al. Association of the triglyceride glucose index as a measure of insulin resistance with mortality and cardiovascular disease in populations from five continents (PURE study): a prospective cohort study. Lancet Healthy Longev 2023;4(1):e23-33. [PMID: 36521498 DOI: 10.1016/S2666-7568(22)00247-1]
- Cui C, Liu L, Zhang T, Fang L, Mo Z, et al. Triglyceride-glucose index, renal function and cardiovascular disease: a national cohort study. Cardiovasc Diabetol 2023;22(1):325. [PMID: 38017519 DOI: 10.1186/s12933-023-02055-4]
- Zhang S, Zhang G, Wang W, Guo SB, Zhang P, et al. An assessment system for clinical and biological interpretability in ulcerative colitis. Aging (Albany NY) 2024;16(4):3856-79. [PMID: 38372705 DOI: 10.18632/aging.205564]
- Del Pozo Cruz B, Ahmadi MN, Lee IM, Stamatakis E. Prospective associations of daily step counts and intensity with cancer and cardiovascular disease incidence and mortality and all-cause mortality. JAMA Intern Med 2022;182(11):1139-48. [PMID: 36094529 DOI: 10.1001/jamainternmed.2022.4000]
- Zhang H, Zhang G, Xu P, Yu F, Li L, et al. Optimized dynamic network biomarker deciphers a high-resolution heterogeneity within thyroid cancer molecular subtypes. Med Res 2025;1(1):10-31. [DOI: 10.1002/mdr2.70004]
- Li H, Zuo Y, Qian F, Chen S, Tian X, et al. Triglyceride-glucose index variability and incident cardiovascular disease: a prospective cohort study. Cardiovasc Diabetol 2022;21(1):105. [PMID: 35689232 DOI: 10.1186/s12933-022-01541-5]
- Cui C, Liu L, Zhang T, Fang L, Mo Z, et al. Triglyceride-glucose index, renal function and cardiovascular disease: a national cohort study. Cardiovasc Diabetol 2023;22(1):325. [PMID: 38017519 DOI: 10.1186/s12933-023-02055-4]
- Zhang Y, Wang F, Tang J, Shen L, He J, et al. Association of triglyceride glucose-related parameters with all-cause mortality and cardiovascular disease in NAFLD patients: NHANES 1999–2018. Cardiovasc Diabetol 2024;23(1):262. [PMID: 39026233 DOI: 10.1186/s12933-024-02354-4]
- Liang D, Liu C, Wang Y. The association between triglyceride-glucose index and the likelihood of cardiovascular disease in the U.S. population of older adults aged ≥ 60 years: a population-based study. Cardiovasc Diabetol 2024;23(1):151. [PMID: 38702717 DOI: 10.1186/s12933-024-02248-5]
- Chen S, Sun M, Chen Y, Liu Y, Du J, et al. Hemodynamic evaluation of an enhanced external counterpulsation strategy for coronary heart disease with a geometric multiscale model. Cardiovasc Innov Appl 2025;10(1):e963. [DOI: 10.15212/CVIA.2025.0020]
- Xu S, Zhang G, Tan X, Zeng Y, Jiang H, et al. Plasma Olink proteomics reveals novel biomarkers for prediction and diagnosis in dilated cardiomyopathy with heart failure. J Proteome Res 2024;23(9):4139-50. [PMID: 39129220 DOI: 10.1021/acs.jproteome.4c00522]
- Nie W, Yan J, Xie Z, Liu Y, Zhang J, et al. Single-cell omics analysis reveals critical cell subtypes and their functional attributes in myocardial ischemia-reperfusion injury. BIO Integration 2026;7(1):e994. [DOI: 10.15212/bioi-2025-0159]
- Dugani SB, Moorthy MV, Li C, Demler OV, Alsheikh-Ali AA, et al. Association of lipid, inflammatory, and metabolic biomarkers with age at onset for incident coronary heart disease in women. JAMA Cardiol 2021;6(4):437-47. [PMID: 33471027 DOI: 10.1001/jamacardio.2020.7073]
- Yang Q, Vijayakumar A, Kahn BB. Metabolites as regulators of insulin sensitivity and metabolism. Nat Rev Mol Cell Biol 2018;19(10):654-72. [PMID: 30104701 DOI: 10.1038/s41580-018-0044-8]
- Riehle C, Abel ED. Insulin signaling and heart failure. Circ Res 2016;118(7):1151-69. [PMID: 27034277 DOI: 10.1161/CIRCRESAHA.116.306206]
- Williams IL, Wheatcroft SB, Shah AM, Kearney MT. Obesity, atherosclerosis and the vascular endothelium: mechanisms of reduced nitric oxide bioavailability in obese humans. Int J Obes Relat Metab Disord 2002;26(6):754-64. [PMID: 12037644 DOI: 10.1038/sj.ijo.0801995]
- Abudukadier A, Fujita Y, Obara A, Ohashi A, Fukushima T, et al. Tetrahydrobiopterin has a glucose-lowering effect by suppressing hepatic gluconeogenesis in an endothelial nitric oxide synthase–dependent manner in diabetic mice. Diabetes 2013;62(9):3033-43. [PMID: 23649519 DOI: 10.2337/db12-1242]
- Ignarro LJ, Buga GM, Wood KS, Byrns RE, Chaudhuri G. Endothelium-derived relaxing factor produced and released from artery and vein is nitric oxide. Proc Natl Acad Sci U S A 1987;84(24):9265-9. [PMID: 2827174 DOI: 10.1073/pnas.84.24.9265]
- Duplain H, Burcelin R, Sartori C, Cook S, Egli M, et al. Insulin resistance, hyperlipidemia, and hypertension in mice lacking endothelial nitric oxide synthase. Circulation 2001;104(3):342-5. [PMID: 11457755 DOI: 10.1161/01.cir.104.3.342]
- Wild S, Roglic G, Green A, Sicree R, King H. Global prevalence of diabetes: estimates for the year 2000 and projections for 2030. Diabetes Care 2004;27(5):1047-53. [PMID: 15111519 DOI: 10.2337/diacare.27.5.1047]
- Yip J, Facchini FS, Reaven GM. Resistance to insulin-mediated glucose disposal as a predictor of cardiovascular disease. J Clin Endocrinol Metab 1998;83(8):2773-6. [PMID: 9709945 DOI: 10.1210/jcem.83.8.5005]
- Jeon JY, Ko SH, Kwon HS, Kim NH, Kim JH, et al. Prevalence of diabetes and prediabetes according to fasting plasma glucose and HbA1c. Diabetes Metab J 2013;37(5):349-57. [PMID: 24199164 DOI: 10.4093/dmj.2013.37.5.349]
- DeFronzo RA, Ferrannini E. Insulin resistance. A multifaceted syndrome responsible for NIDDM, obesity, hypertension, dyslipidemia, and atherosclerotic cardiovascular disease. Diabetes Care 1991;14(3):173-94. [PMID: 2044434 DOI: 10.2337/diacare.14.3.173]
- Solinas G, Karin M. JNK1 and IKKβ: molecular links between obesity and metabolic dysfunction. FASEB J 2010;24(8):2596-611. [PMID: 20371626 DOI: 10.1096/fj.09-151340]
- Krause M, Ludwig MS, Heck TG, Takahashi HK. Heat shock proteins and heat therapy for type 2 diabetes: pros and cons. Curr Opin Clin Nutr Metab Care 2015;18(4):374-80. [PMID: 26049635 DOI: 10.1097/MCO.0000000000000183]
- Befroy DE, Petersen KF, Dufour S, Mason GF, de Graaf RA, et al. Impaired mitochondrial substrate oxidation in muscle of insulin-resistant offspring of type 2 diabetic patients. Diabetes 2007;56(5):1376-81. [PMID: 17287462 DOI: 10.2337/db06-0783]
- Kim JA, Wei Y, Sowers JR. Role of mitochondrial dysfunction in insulin resistance. Circ Res 2008;102(4):401-14. [PMID: 18309108 DOI: 10.1161/CIRCRESAHA.107.165472]
- Nishikawa T, Kukidome D, Sonoda K, Fujisawa K, Matsuhisa T, et al. Impact of mitochondrial ROS production in the pathogenesis of insulin resistance. Diabetes Res Clin Pract 2007;77(Suppl 1):S161-4. [PMID: 17481767 DOI: 10.1016/j.diabres.2007.01.071]
- Murphy MP. Induction of mitochondrial ROS production by electrophilic lipids: a new pathway of redox signaling? Am J Physiol Heart Circ Physiol 2006;290(5):H1754-5. [PMID: 16415083 DOI: 10.1152/ajpheart.00040.2006]
- Gerrits AJ, Koekman CA, van Haeften TW, Akkerman JW. Platelet tissue factor synthesis in type 2 diabetic patients is resistant to inhibition by insulin. Diabetes 2010;59(6):1487-95. [PMID: 20200314 DOI: 10.2337/db09-1008]
- Che B, Zhong C, Zhang R, Pu L, Zhao T, et al. Triglyceride-glucose index and triglyceride to high-density lipoprotein cholesterol ratio as potential cardiovascular disease risk factors: an analysis of UK biobank data. Cardiovasc Diabetol 2023;22(1):34. [PMID: 36797706 DOI: 10.1186/s12933-023-01762-2]
- Li F, Wang Y, Shi B, Sun S, Wang S, et al. Association between the cumulative average triglyceride glucose-body mass index and cardiovascular disease incidence among the middle-aged and older population: a prospective nationwide cohort study in China. Cardiovasc Diabetol 2024;23(1):16. [PMID: 38184577 DOI: 10.1186/s12933-023-02114-w]
- Dang K, Wang X, Hu J, Zhang Y, Cheng L, et al. The association between triglyceride-glucose index and its combination with obesity indicators and cardiovascular disease: NHANES 2003–2018. Cardiovasc Diabetol 2024;23(1):8. [PMID: 38184598 DOI: 10.1186/s12933-023-02115-9]
- Zhang Q, Xiao S, Jiao X, Shen Y. The triglyceride-glucose index is a predictor for cardiovascular and all-cause mortality in CVD patients with diabetes or pre-diabetes: evidence from NHANES 2001–2018. Cardiovasc Diabetol 2023;22(1):279. [PMID: 37848879 DOI: 10.1186/s12933-023-02030-z]
- Shi H, Kokoeva MV, Inouye K, Tzameli I, Yin H, et al. TLR4 links innate immunity and fatty acid–induced insulin resistance. J Clin Invest 2006;116(11):3015-25. [PMID: 17053832 DOI: 10.1172/JCI28898]
- Suganami T, Mieda T, Itoh M, Shimoda Y, Kamei Y, et al. Attenuation of obesity-induced adipose tissue inflammation in C3H/HeJ mice carrying a toll-like receptor 4 mutation. Biochem Biophys Res Commun 2007;354(1):45-9. [PMID: 17210129 DOI: 10.1016/j.bbrc.2006.12.190]
- Poggi M, Bastelica D, Gual P, Iglesias MA, Gremeaux T, et al. C3H/HeJ mice carrying a toll-like receptor 4 mutation are protected against the development of insulin resistance in white adipose tissue in response to a high-fat diet. Diabetologia 2007;50(6):1267-76. [PMID: 17426960 DOI: 10.1007/s00125-007-0654-8]
- Kim F, Pham M, Luttrell I, Bannerman DD, Tupper J, et al. Toll-like receptor-4 mediates vascular inflammation and insulin resistance in diet-induced obesity. Circ Res 2007;100(11):1589-96. [PMID: 17478729 DOI: 10.1161/CIRCRESAHA.106.142851]
- Zhao M, Wang S, Zuo A, Zhang J, Wen W, et al. HIF-1α/JMJD1A signaling regulates inflammation and oxidative stress following hyperglycemia and hypoxia-induced vascular cell injury. Cell Mol Biol Lett 2021;26(1):40. [PMID: 34479471 DOI: 10.1186/s11658-021-00283-8]
- Duan M, Zhao X, Li S, Miao G, Bai L, et al. Metabolic score for insulin resistance (METS-IR) predicts all-cause and cardiovascular mortality in the general population: evidence from NHANES 2001–2018. Cardiovasc Diabetol 2024;23(1):243. [PMID: 38987779 DOI: 10.1186/s12933-024-02334-8]
- Zhou X, Ruan W, Zhao L, Lin K, Li J, et al. Causal links between renal function and cardiac structure, function, and disease risk. Glob Heart 2024;19(1):83. [PMID: 39524990 DOI: 10.5334/gh.1366]
- Suman S, Pravalika J, Manjula P, Farooq U. Gender and CVD- does it really matters? Curr Probl Cardiol 2023;48(5):101604. [PMID: 36690310 DOI: 10.1016/j.cpcardiol.2023.101604]
- Egan KJ, Knutson KL, Pereira AC, von Schantz M. The role of race and ethnicity in sleep, circadian rhythms and cardiovascular health. Sleep Med Rev 2017;33:70-8. [PMID: 27908540 DOI: 10.1016/j.smrv.2016.05.004]
- Zhao D, Liu J, Wang M, Zhang X, Zhou M. Epidemiology of cardiovascular disease in China: current features and implications. Nat Rev Cardiol 2019;16(4):203-12. [PMID: 30467329 DOI: 10.1038/s41569-018-0119-4]
- Jankowski J, Floege J, Fliser D, Böhm M, Marx N. Cardiovascular disease in chronic kidney disease: pathophysiological insights and therapeutic options. Circulation 2021;143(11):1157-72. [PMID: 33720773 DOI: 10.1161/CIRCULATIONAHA.120.050686]
- Guérin AP, London GM, Marchais SJ, Metivier F. Arterial stiffening and vascular calcifications in end-stage renal disease. Nephrol Dial Transplant 2000;15(7):1014-21. [PMID: 10862640 DOI: 10.1093/ndt/15.7.1014]
- Zoccali C, Vanholder R, Massy ZA, Ortiz A, Sarafidis P, et al. The systemic nature of CKD. Nat Rev Nephrol 2017;13(16):344-58. [PMID: 28435157 DOI: 10.1038/nrneph.2017.52]
- Alhaj E, Alhaj N, Rahman I, Niazi TO, Berkowitz R, et al. Uremic cardiomyopathy: an underdiagnosed disease. Congest Heart Fail 2013;19(4):E40-45. [PMID: 23615021 DOI: 10.1111/chf.12030]
- Glassock RJ, Pecoits-Filho R, Barberato SH. Left ventricular mass in chronic kidney disease and ESRD. Clin J Am Soc Nephrol 2009;4(Suppl 1):S79-91. [PMID: 19996010 DOI: 10.2215/CJN.04860709]
- Ozkahya M, Ok E, Cirit M, Aydin S, Akçiçek F, et al. Regression of left ventricular hypertrophy in haemodialysis patients by ultrafiltration and reduced salt intake without antihypertensive drugs. Nephrol Dial Transplant 1998;13(6):1489-93. [PMID: 9641180 DOI: 10.1093/ndt/13.6.1489]
- Charra B, Chazot C. The neglect of sodium restriction in dialysis patients: a short review. Hemodial Int 2003;7(4):342-7. [PMID: 19379386. DOI: 10.1046/j.1492-7535.2003.00060.x]