Novel Metabolomic Biomarkers for Latent Tuberculosis Infection: A Plasma-based Untargeted Metabolomics Approach Using Mass Spectrometry
1Institute of Physical and Chemical Analysis, Center for Disease Control and Prevention of Jiangsu Province, Nanjing 210009, China
2Department of Chronic Communicable Disease, Center for Disease Control and Prevention of Jiangsu Province, Nanjing 210009, China
3Department of Epidemiology, School of Public Health, Boston University, Boston, MA, USA
aThese authors contributed equally to this work.
*Correspondence to: Dr. Wenliang Ji, Institute of Physical and Chemical Analysis, Center for Disease Control and Prevention of Jiangsu Province, Nanjing 210009, China, Tel: +86-25-83759369. E-mail: jwl320911@163.com; Dr. Qiao Liu, Department of Chronic Communicable Disease, Center for Disease Control and Prevention of Jiangsu Province, Nanjing 210009, China, Tel: +86-25-83759458. E-mail: liuqiaonjmu@163.com
Received: January 4 2026; Revised: April 6 2026; Accepted: May 6 2026; Published Online: June 4 2026
Cite this paper:
Wang X, Pan Y, Zhang H et al. Novel Metabolomic Biomarkers for Latent Tuberculosis Infection: A Plasma-based Untargeted Metabolomics Approach Using Mass Spectrometry. BIO Integration 2026; 7: 1–13.
DOI: 10.15212/bioi-2026-0003. Available at: https://bio-integration.org/
Download citation
© 2026 The Authors. This is an open access article distributed under the terms of the Creative Commons Attribution License (https://creativecommons.org/licenses/by/4.0/). See https://bio-integration.org/copyright-and-permissions/
Abstract
Objective: Latent tuberculosis infection (LTBI) is difficult to diagnose due to the lack of a definitive gold standard. This study aimed to explore plasma metabolic alterations associated with LTBIs using an untargeted metabolomics approach.
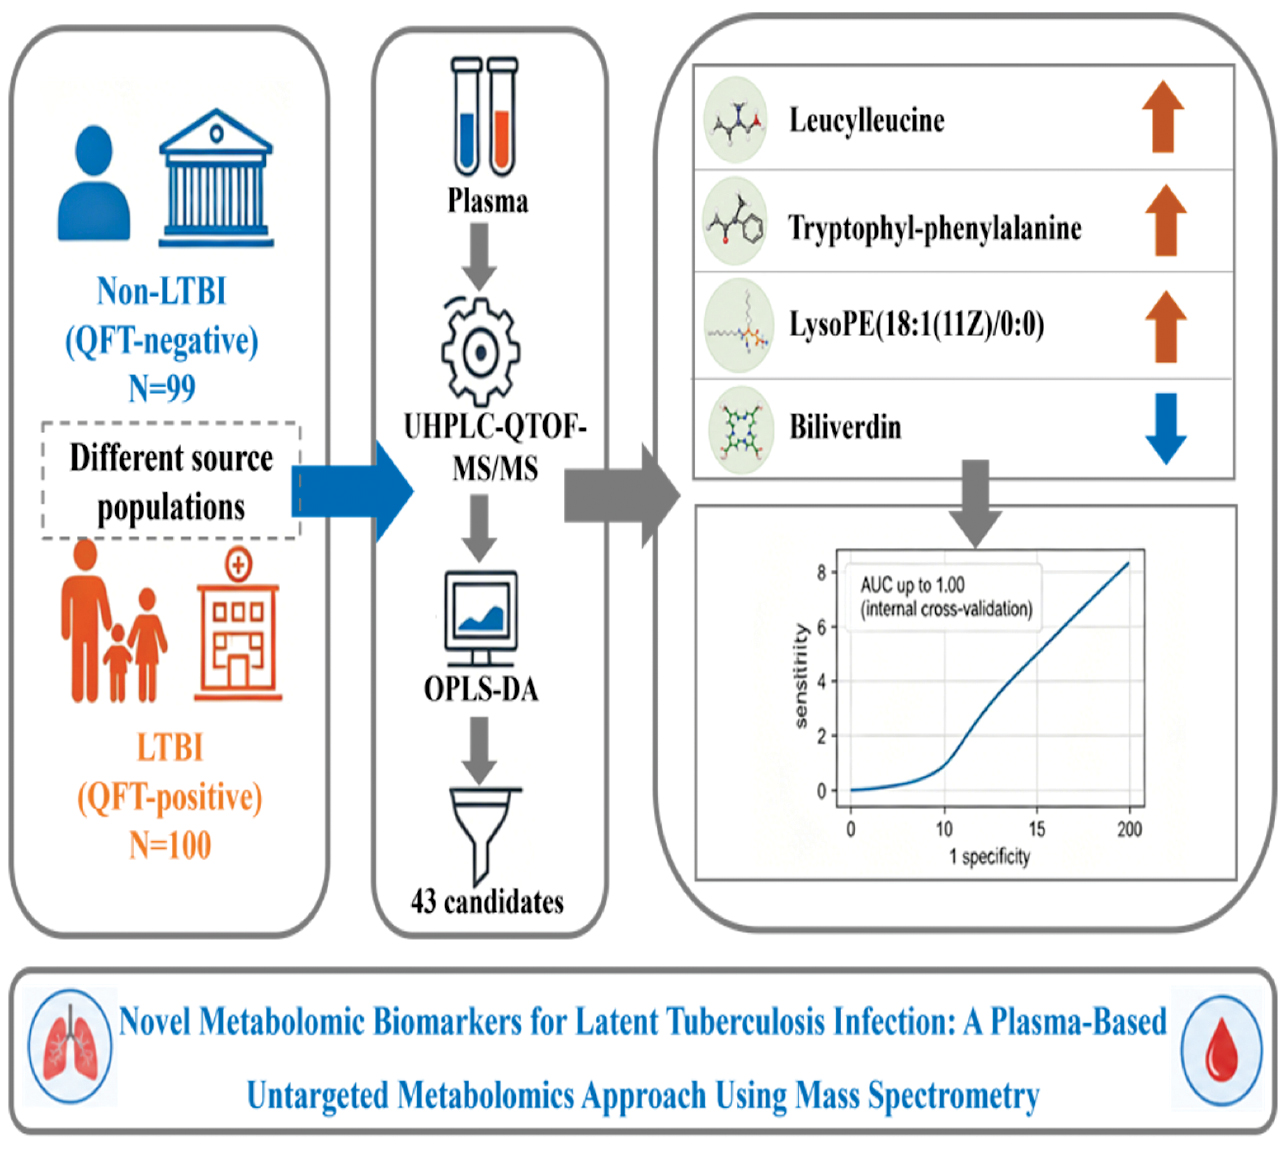
Design: In this discovery-phase study, LTBI individuals (QuantiFERON-TB Gold-positive) were recruited from close contacts of tuberculosis patients, while non-LTBI individuals (QuantiFERON-TB Gold-negative) were recruited from prison detainees. Plasma samples were analyzed using ultra-high-performance liquid chromatography coupled with quadrupole time-of-flight tandem mass spectrometry. Multivariate statistical analysis combined with univariate screening was used to identify differential metabolites, followed by receiver operating characteristic analysis.
Results: A total of 43 metabolites showed significant differences between the LTBI (n = 100) and non-LTBI groups (n = 99). Among the 43 metabolites, leucylleucine, tryptophyl-phenylalanine, lysoPE(18:1(11Z)/0:0), and biliverdin displayed relatively high discriminatory ability in this discovery cohort with area under the curve values ranging from 0.975–0.981. Models combining selected metabolites achieved higher apparent classification performance under internal validation, with some area under the curve values approaching 1.00. However, because feature selection and model evaluation were performed within the same cohort and no external validation was performed, these results may overestimate true diagnostic performance.
Conclusions: This study provides exploratory evidence of plasma metabolic differences between LTBI and non-LTBI individuals and identifies four metabolites of potential interest. However, the two groups were drawn from different source populations, which may introduce selection bias and unmeasured confounding. In addition, all metabolites were identified at Metabolomics Standards Initiative level 2 without confirmation using authentic standards and no targeted validation was performed. Therefore, these findings should be interpreted as preliminary and hypothesis-generating. Independent validation in well-matched cohorts with targeted metabolomic approaches is required before any clinical interpretation.
Keywords
Biomarkers, latent tuberculosis infection, metabolomics, plasma.
Background
Latent tuberculosis infection (LTBI) refers to a persistent immune response triggered by Mycobacterium tuberculosis (MTB) antigens without any evident signs of active tuberculosis (TB) [1]. It is estimated that approximately 25% of the global population is latently infected with MTB with China bearing the highest burden of LTBIs [2]. The End TB Strategy, first launched in 2014 by the World Health Organization, includes the preventive treatment of an LTBI as a key element [3]. The new End TB Strategy, first launched in 2014 by the World Health Organization, identifies preventive treatment of an LTBI as a key component of TB control [3]. Hence, accurate diagnosis and prompt treatment of an LTBI have a crucial role in lessening the burden of TB.
Establishing the diagnosis of an LTBI is constrained by a low bacteria load that makes it impossible to directly detect MTB. So, there is no universally accepted gold standard for diagnosing an LTBI. The prevalent clinical diagnostic methods for an LTBI primarily involve immunologic tests, such as the tuberculin skin test and γ-interferon release assay [4]. These tests indirectly pinpoint MTB infection by detecting the immune response to MTB antigens. However, a weak humoral response makes serologic testing unreliable [5]. Moreover, an LTBI often lacks overt clinical symptoms or changes in chest imaging, complicating differentiation from non-LTBIs and further hindering the diagnosis [6]. Consequently, there is a pressing need for effective biomarkers to distinguish between LTBIs and non-LTBIs. Identifying individuals with LTBIs through the discovery of highly specific diagnostic markers holds significance in curbing the TB epidemic.
Metabolomics, an emerging field following genomics and proteomics, involves quantifying metabolites within an organism and investigating the interaction with physiopathologic changes [7]. The primary analytical platforms used are nuclear magnetic resonance and mass spectrometry (MS) [8]. Liquid chromatography-mass spectrometry serves as the primary tool in metabolomics. Leveraging this technology for metabolomics analysis can heighten sensitivity, which facilitates the identification of MTB infection-related metabolic pathways and metabolites, providing a foundation for understanding disease onset and progression. With advancing technology, substantial progress in metabolomics studies on TB has been made in diagnosis and the understanding of the pathogen-host interaction, as well as the mechanism underlying MTB drug resistance [9].
Currently, most metabolomics research is focused on the differential diagnosis of active TB and few studies have focused on distinguishing between LTBIs and non-LTBIs. In this study untargeted metabolomics analysis of plasma from non-LTBIs and LTBIs was performed using ultra-high performance liquid chromatography-quadrupole time-of-flight mass spectrometry (UHPLC-QTOF-MS/MS). The plasma for differentially expressed metabolites was screened to assess the performance of the differentially expressed metabolites as potential biomarkers for diagnosis in LTBIs.
Methods
Study population
QuantiFERON-TB Gold (QFT) screening was performed on healthy detainees who were newly admitted to a prison in Nanjing in August, September, and October 2023. QFT-negative individuals were selected as the non-LTBI group. QFT-positive individuals were selected from close contacts of newly diagnosed active pulmonary TB patients registered in three cities (Kunshan, Danyang, and Wuxi) of Jiangsu Province from 1 July 2022 to 30 November 2023 and who were currently residing in the same city (district). These individuals were included in the LTBI group as study subjects. All participants participated in the study voluntarily and signed an informed consent form. The inclusion criteria included a negative γ-interferon release test, no abnormality in chest imaging, and no clinical symptoms of active TB. The exclusion criteria were as follows: individuals who were HIV-, hepatitis B virus-, or hepatitis C virus-positive; diagnosed with diabetes, a malignant tumor, or severe autoimmune disease; diagnosed with TB in the past; individuals taking immunosuppressants or immune enhancers; and pregnant or lactating women.
Definitions
Individuals with positive QFT results are defined as LTBI-positive [10], while individuals with negative QFT results are defined as non-LTBI.
Close family contacts were defined as follows: during the infectious period of the designated case (from 3 months before the diagnosis of pathogen-positive patients to 2 weeks of effective treatment, and 1 month before the diagnosis of other TB patients); individuals who have been in the same space as the patient and have been in continuous contact for ≥8 h; or individuals who have had cumulative contact with the patient for >40 h.
Chemicals and reagents
Carnitine C16:0-d3 was purchased from Shanghai Sigma-Aldrich Co., Ltd. (Shanghai, China). Tryptophan-d5 was purchased from Shanghai ANPEL TRACE Standard Technical Service Co., Ltd. (Shanghai, China). Cholic acid-d4 was purchased from TRC (Toronto, ON, Canada). High-performance liquid chromatography grade acetonitrile (ACN) was purchased from Merck (Darmstadt, Germany). Formic acid and deionized water were produced by Fisher Chemical Corporation (Pittsburgh, PA, USA).
Plasma metabolite extraction
Plasma samples were thawed at room temperature. A 50-μL plasma portion was added to 200 μL of acetonitrile containing internal standards (carnitine C16:0-d3 and tryptophan-d5, 1 μg/mL; cholic acid-d4, 1.25 μg/mL). The mixture was vortex-mixed for 2 min, extracted for 10 min by ultrasound, and centrifuged at 12,470 × g for 10 min at 4 °C. Then, the transferred supernatant (200 μL) was evaporated to dryness under nitrogen gas. The residue was reconstituted in 80 μL of 80% ACN and centrifuged (12,470 × g for 10 min at 4 °C). The supernatant was transferred to auto-sampler vials for further UHPLC-QTOF-MS/MS analysis.
UHPLC-QTOF-MS/MS analysis
Chromatographic separation was performed on an ExionLC™ UHPLC system (AB SCIEX Technologies, city, state, USA) with an ACQUITY UPLC™ HSST3 column (100 mm × 2.1 mm, 1.7 μm; Waters, Milford, city, state, USA) at 30 °C. The mobile phase was composed of 0.1% formic acid water (A) and ACN (B) at a flow rate of 0.3 mL/min. The gradient conditions were as follows for plasma analysis, followed by 2.5 min of re-equilibration: 0–5 min, 3% B → 8% B; 5–11 min, 8% B → 30% B; 11–20 min, 30% B → 80% B; 20–21 min, 80% B → 95% B; and 21–25 min, 95% B. The injection volume was set at 2 μL.
MS analysis was performed on an ABSciex TripleTOF™ X500R system (AB SCIEX Technologies) equipped with an electrospray ionization source in the positive mode. The MS parameters of plasma samples were as follows: electrospray ionization temperature, 550 °C; ion source gas 1&2 pressure, 55 psi; curtain gas, 35 psi; and ion spray voltage, 5500 V. The TOF MS scan range was 100–1200 with a declustering potential of 60 V and collision energy of 5 V. For MS/MS analysis, the scan range was 50–1200 with a declustering potential of 60 V, collision energy of 35 V, and collision energy spread of 15 V.
MD analysis was performed in the positive ion mode only based on preliminary experiments showing limited spectral information and detectable differentially abundant features in the negative ion mode, while the positive ion mode provided sufficient coverage for the purposes of this discovery-phase study.
Data processing
LC-MS raw data were analyzed by MarkerView (AB SCIEX Technologies). After data pretreatment procedures, including peak finding, alignment, filtering, and normalization to total area, a three-dimensional dataset was generated comprising sample information, peak intensities, retention time, and the mass-to-charge ratio (m/z). Retention time and the m/z values were utilized as identifiers for each ion. Moreover, peaks with missing values (ion intensity = 0) in <10 samples were removed to obtain consistent variables. Then, the resultant data matrices were imported into the SIMCA-P+ 14.1 software (Umetrics, Umea, Sweden) for multivariate statistical analysis. The analysis methods containing partial least-squares discriminant analysis and orthogonal partial least-squares discriminant analysis (OPLS-DA) were used for metabolite profile analysis.
OPLS-DA, a supervised multivariate statistical model, was performed to visualize the metabolic difference between the model and control groups. Metabolites meeting the criteria of variable importance in a projection >1 and a P-value <0.05 and fold-change (FC) ≥2 or ≤0.5 were considered differential metabolites. The potential biomarkers were identified by SCIEX OS (AB SCIEX Technologies) in combination with the HMDB database (http://www.hmdb.ca) [11]. Then, receiver operating characteristic curves were applied to analyze data for evaluating the predictive power of the identified biomarkers. Pathway analysis relied on data from the KEGG database (http://www.genome.jp/kegg) [12], MetaboAnalyst 6.0 (http://www.MetaboAnalyst.ca/) [13], the METLIN database (https://metlin.scripps.edu/), and the HMDB database.
Quality control
Isotope-labeled internal standards (carnitine C16:0-d3, tryptophan-d5, and cholic acid-d4) were added to the extraction solvent prior to sample preparation and used throughout the analytical workflow for retention time alignment and signal normalization. Instrumental drift was monitored based on the consistency of internal standard signals across the analytical sequence. All internal standards exhibited a relative standard deviation <15%, indicating relatively stable instrument performance during the run.
However, no pooled quality control samples were included in this study. Pooled QC samples are essential for untargeted metabolomics to assess batch-to-batch variation, monitor feature stability, and correct for intensity drift over time. Without pooled QC the reproducibility of low-abundance features or distinguish technical variation from biological differences cannot be rigorously evaluated. Therefore, the assessment of batch drift was limited to the three internal standards, which may not represent the behavior of all detected metabolites. The robustness claims based solely on internal standards should be interpreted with caution. All samples were processed using a unified protocol and analyzed under consistent LC-MS conditions and internal standard normalization was applied prior to statistical analysis to minimize technical variation.
Statistical analysis
Random forest models were constructed using the randomForest package in R software (version 4.2.1; R Foundation for Statistical Computing, Vienna, Austria) to evaluate the diagnostic performance of the identified metabolites individually and in combination. The models included four key metabolites [leucylleucine, tryptophyl-phenylalanine, biliverdin, and lysoPE(18:1(11Z)/0:0)] as predictors with the number of trees set to 500. The predicted probabilities for LTBI classification generated by the random forest models were used to construct receiver operating characteristic curves using the pROC package (https://cran.r-project.org/package=pROC). The area under the curve (AUC) was calculated for individual metabolites and the combined model. The optimal cut-off value for the combined model was determined by maximizing the Youden index. Model performance was assessed using sensitivity, specificity, and AUC with 95% confidence intervals (CIs) estimated by 1000 bootstrap resamples.
Five-fold cross-validation was repeated 5 times using the caret package (https://cran.r-project.org/package=caret) to prevent overfitting and ensure model stability. The mtry parameter was optimized via grid search within the cross-validation procedure. The 95% CIs for AUC values were estimated using 1000 bootstrap resamples.
Multivariable linear regression analyses were performed for the four key metabolites with age (continuous), gender (categorical [male or female]), and smoking status (categorical [never, former, or current]) included as covariates to control for potential confounding effects of age, gender, and smoking on metabolic profiles. The false discovery rate (FDR) method was applied to correct for multiple testing.
Baseline characteristics were compared between the LTBI and non-LTBI groups using the Mann-Whitney U test for continuous variables (age and body mass index) and the Pearson χ2 test or Fisher’s exact test for categorical variables (smoking status, alcohol consumption, education level, residence, Bacillus Calmette-Guérin vaccination, and diabetes). The results are presented as a median (interquartile range) for continuous variables and frequencies (percentages) for categorical variables.
All statistical analyses were performed using R software and SIMCA-P+ 14.1 (Umetrics) for multivariate analysis.
Results
Characteristics of the participants
A total of 199 participants were included in the analysis (99 individuals without an LTBI and 100 individuals with an LTBI; Figure 1). The median age of non-LTBI participants was 42.0 years (interquartile range, 35.0–51.5 years) and the median age of LTBI participants was 56.0 years (interquartile range, 37.5–67.0 years). The baseline demographic and clinical characteristics of the study participants are summarized in Table 1. The LTBI group was significantly older compared to the non-LTBI group (median age, 56.0 vs. 42.0 years; P = 0.001). Notably, smoking status differed significantly between groups (P = 0.002) with a higher proportion of current smokers in the LTBI group (17.7% vs. 4.1%) and a higher proportion of former smokers in the non-LTBI group (13.3% vs. 3.1%). Bacillus Calmette-Guérin vaccination status was comparable between groups with approximately two-thirds of participants in each group vaccinated.
Figure 1 Flow chart of baseline population in this study.
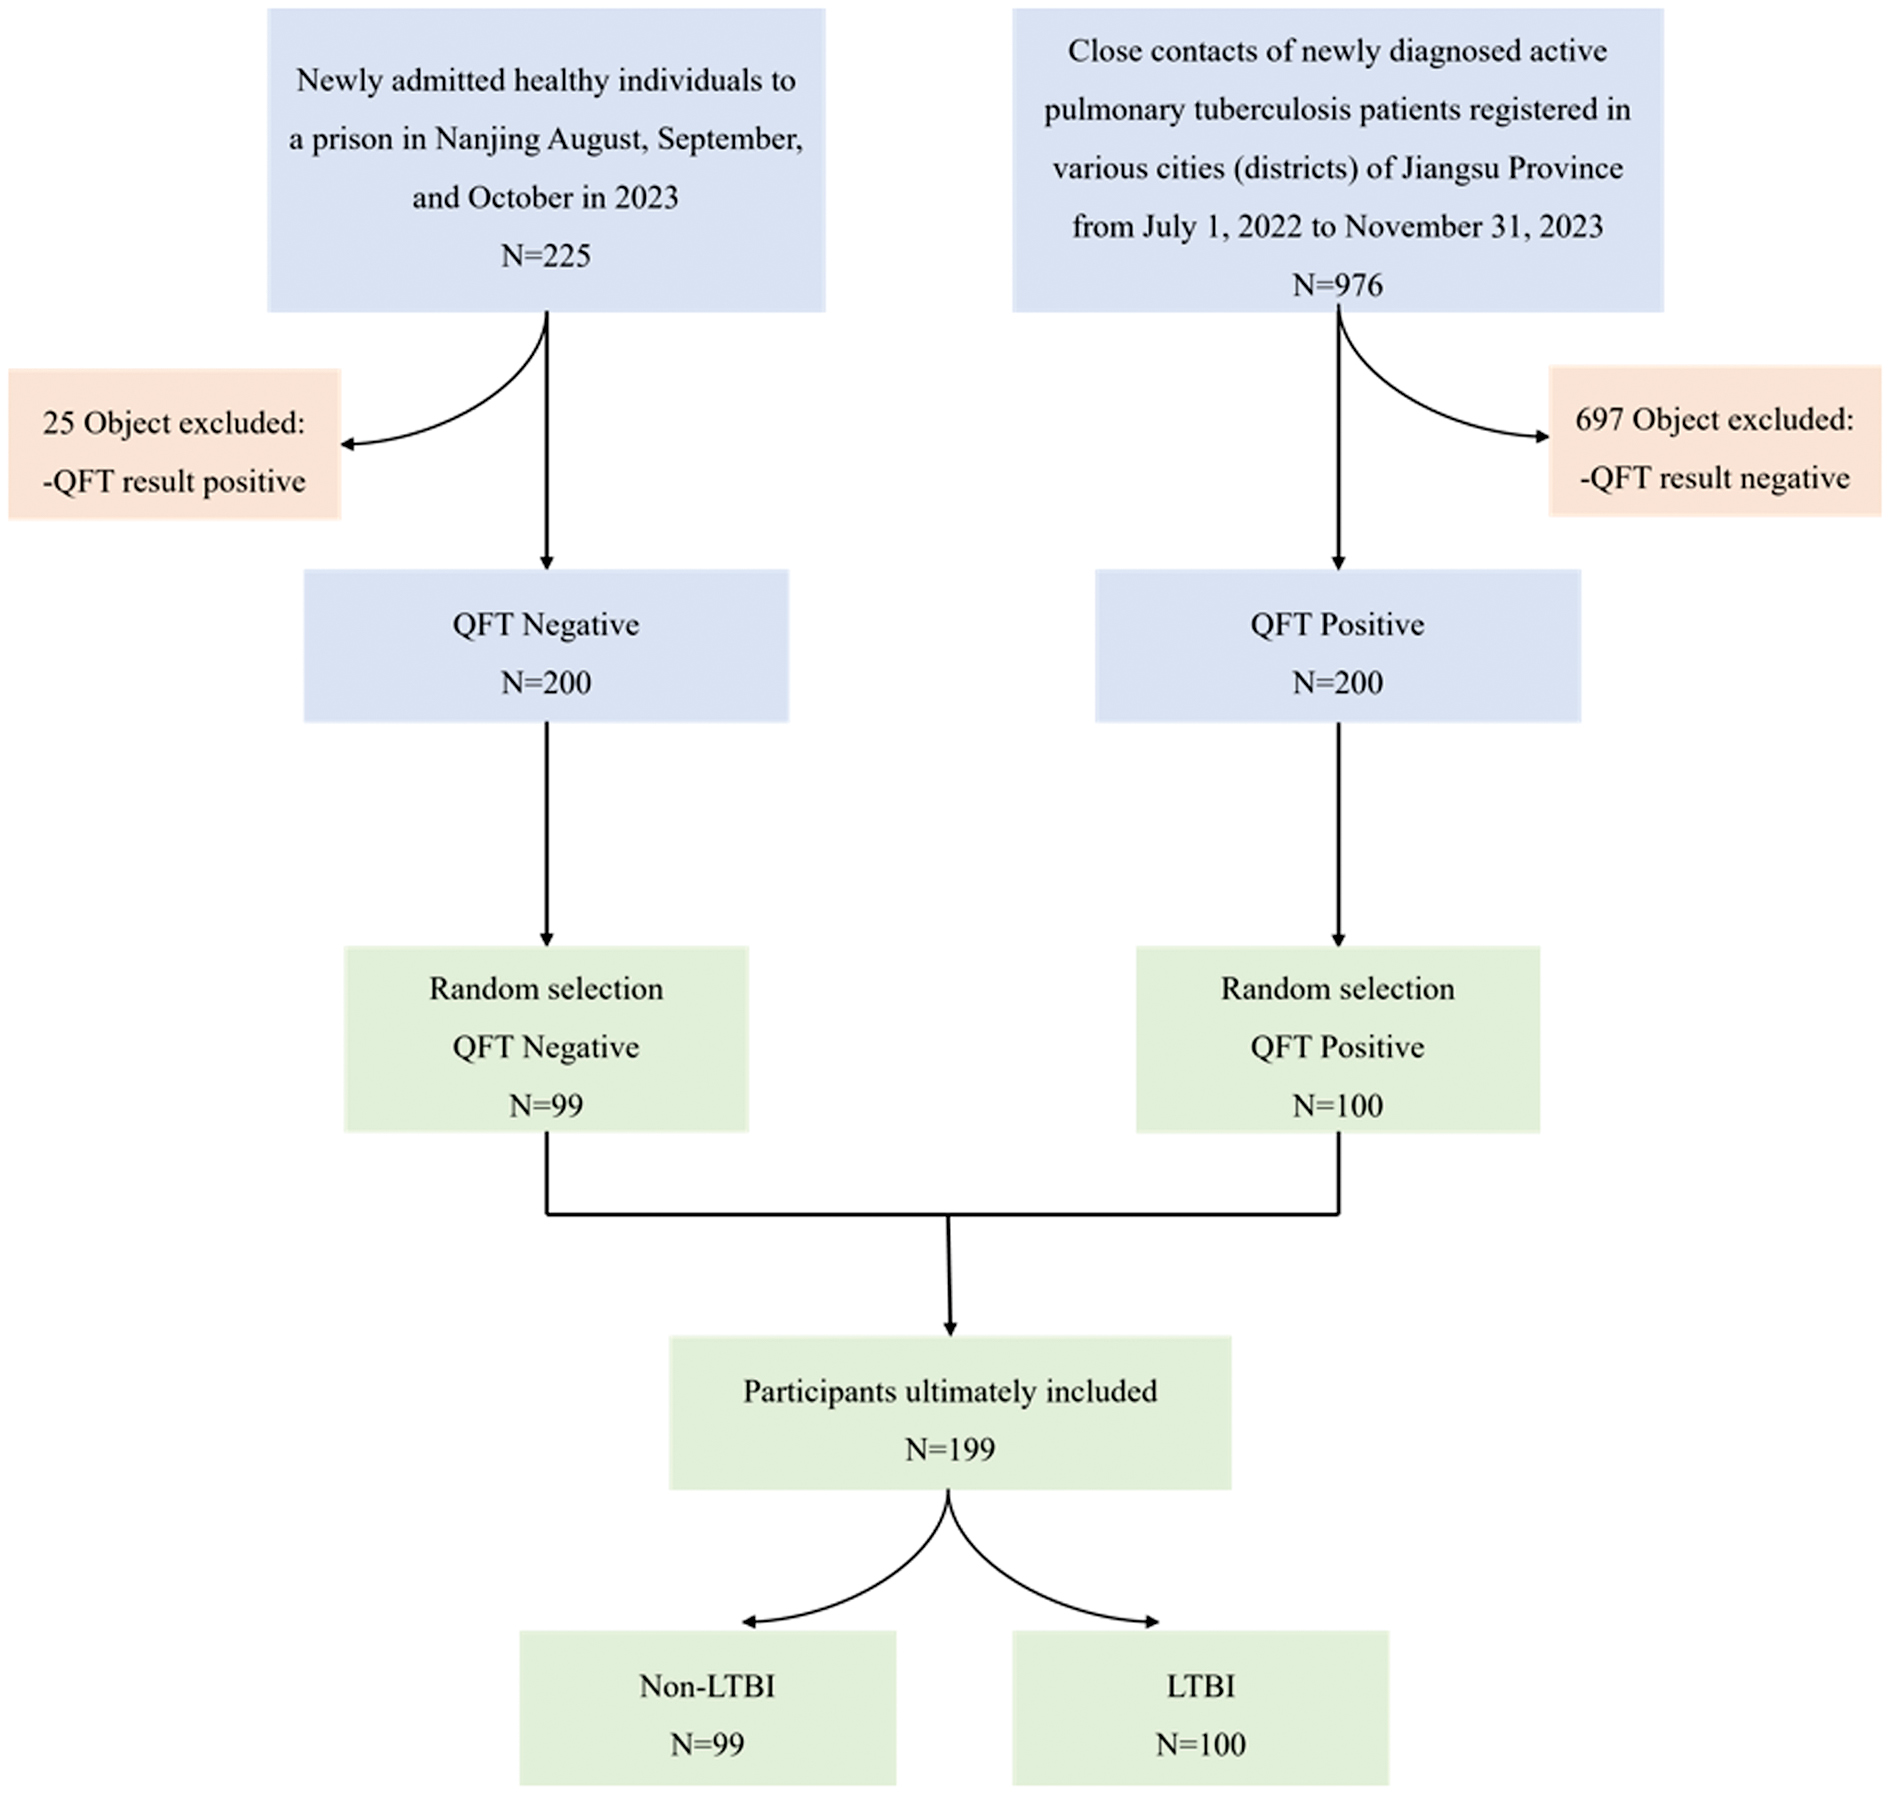
Table 1 Demographic and Baseline Characteristics of the Study Participants
| Characteristics | Non-LTBI (N, %) | LTBI (N, %) | χ2/t | P value |
|---|---|---|---|---|
| N | 99 | 100 | ||
| Age | 42.0 (35.0, 51.5) | 56.0 (37.5, 67.0) | −3.42a | 0.001 |
| BMI | 23.5 (21.1, 25.2) | 23.0 (20.5, 25.0) | 0.89a | 0.375 |
| Residence | 0.39 | 0.532 | ||
| Town | 57 (61.3) | 63 (65.6) | ||
| Country | 36 (38.7) | 33 (34.3) | ||
| Education | 3.24 | 0.519 | ||
| No schooling | 5 (5.2) | 4 (4.2) | ||
| Primary school | 17 (17.7) | 25 (26.3) | ||
| Junior school | 37 (38.5) | 27 (28.4) | ||
| Senior school | 17 (17.7) | 21 (22.1) | ||
| College and above | 20 (20.8) | 18 (18.9) | ||
| Smoking | 12.8 | 0.002 | ||
| Yes | 4 (4.1) | 17 (17.7) | ||
| Quit | 13 (13.3) | 3 (3.1) | ||
| No | 81 (82.7) | 76 (79.2) | ||
| Alcohol consumption | 2.95 | 0.229 | ||
| Yes | 7 (7.1%) | 11 (11.6) | ||
| Quir | 2 (2.0%) | 5 (5.3) | ||
| No | 89 (90.8%) | 79 (83.2) | ||
| Type 2 diabetes | 1.12b | 0.290 | ||
| Yes | 3 (3.2) | 6 (6.3) | ||
| No | 90 (96.8) | 87 (91.6) | ||
| Unspecified | 0 (0.0) | 2 (2.1) | ||
| BCG vaccination | 1.95 | 0.378 | ||
| Yes | 58 (59.8) | 65 (67.7) | ||
| No | 13 (13.4) | 9 (9.4) | ||
| Unspecified | 26 (26.8) | 22 (22.9) |
Data are presented as a median (interquartile range) for continuous variables and N (%) for categorical variables. aMann-Whitney U test; bFisher’s exact test; all other comparisons used Pearson’s χ2 test. LTBI, latent tuberculosis infection; BMI, body mass index; BCG, Bacillus Calmette-Guérin.
Comparative analysis of metabolic profiles
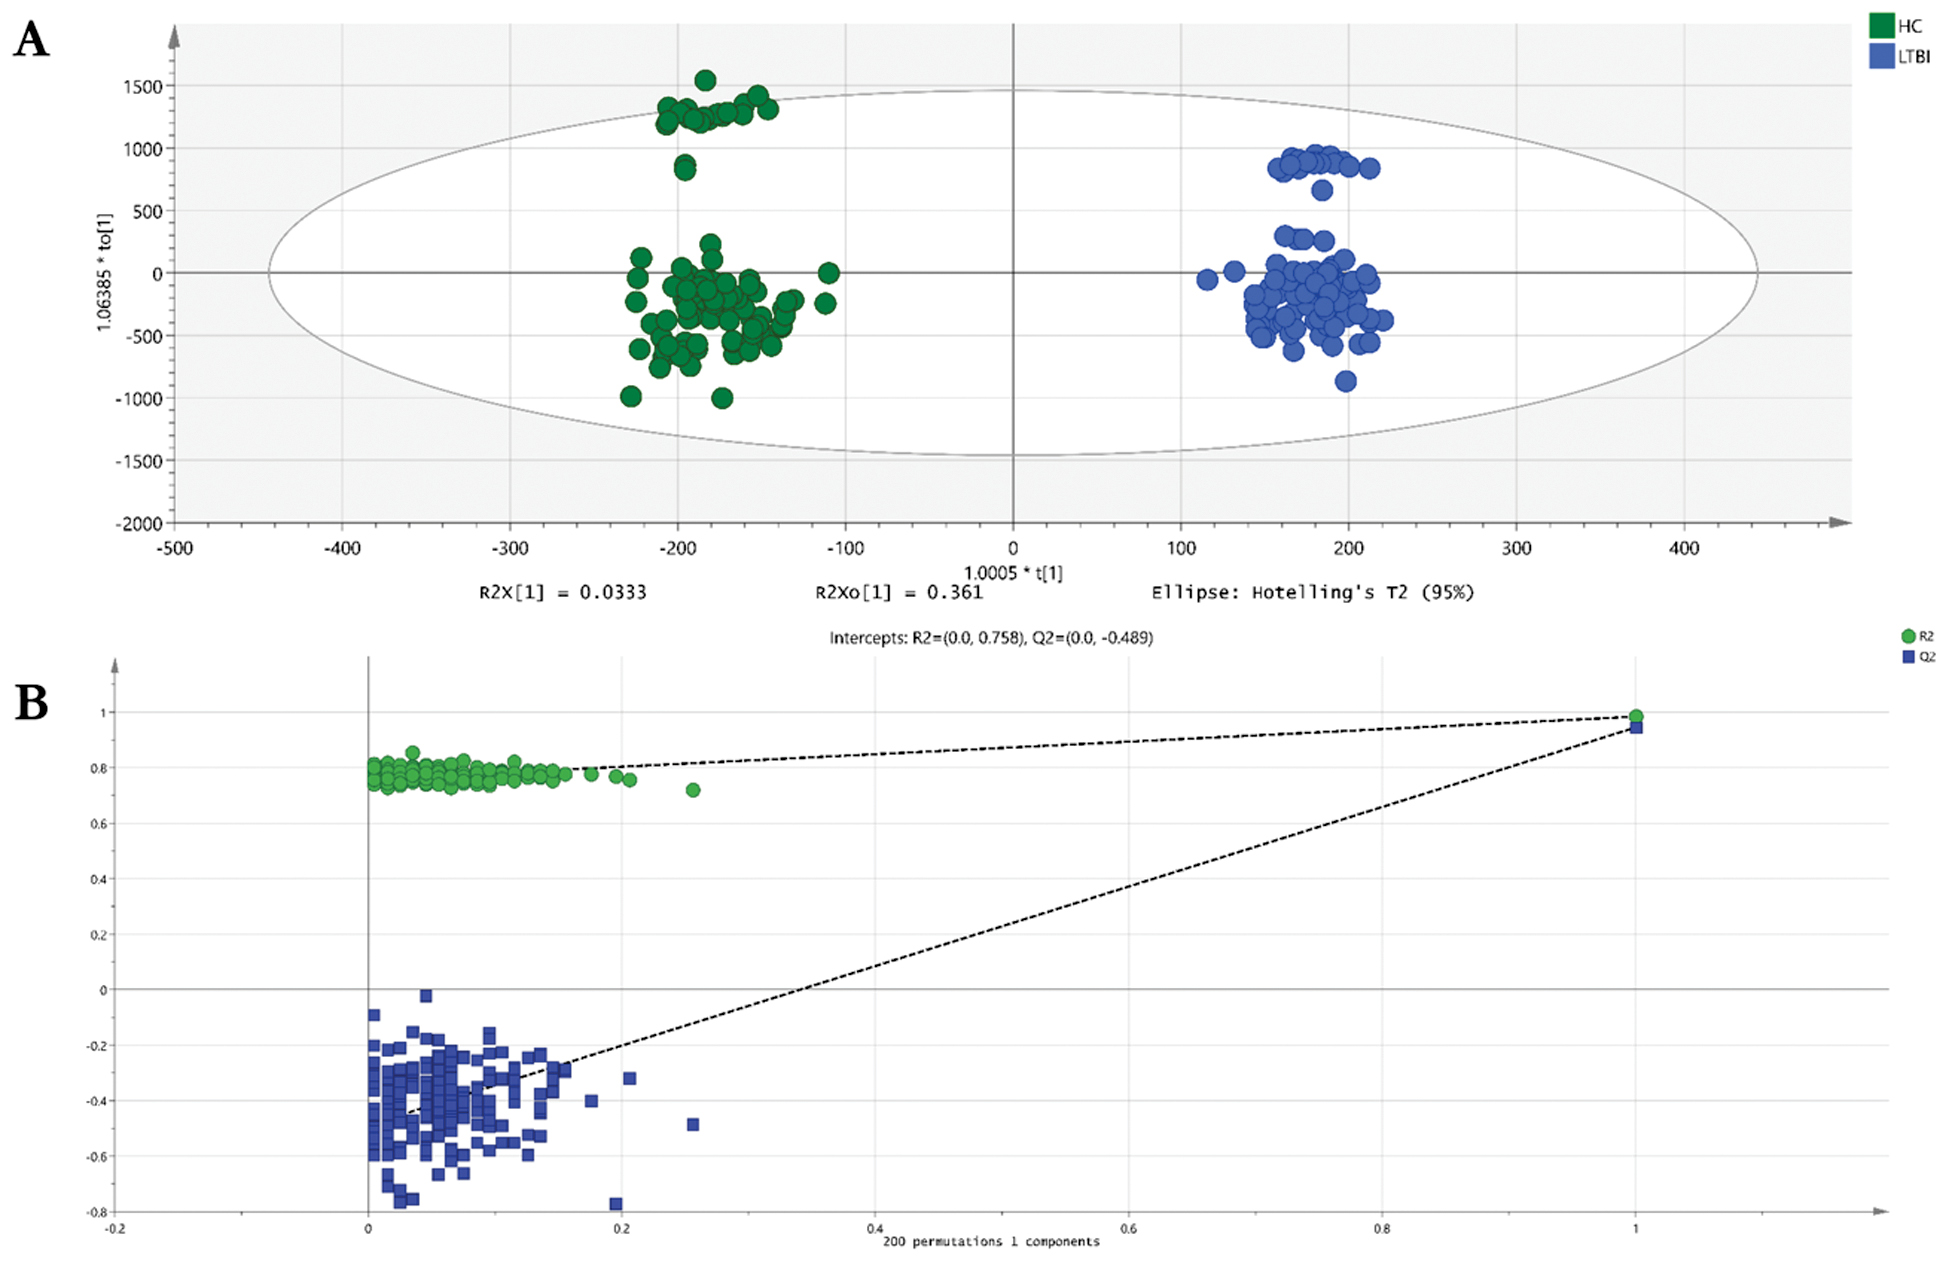
The metabolomes of 199 plasma samples from the 2 groups underwent characterization and comparison, resulting in a total of 5011 molecular signatures identified in the positive ion mode, which were then subjected to statistical analysis using MetaboAnalyst 6.0. The principal component analysis model, as an unsupervised multivariate statistical method, did not show clear differentiation between the LTBI and non-LTBI groups (Supplementary Figure S1). In contrast, the orthogonal partial least squares discriminant analysis model successfully exhibited distinct separation between the LTBI and non-LTBI groups in the positive ion mode. A permutation test was conducted to assess the risk of overfitting and evaluate model robustness with 200 permutations. The permutation test yielded an R2-intercept of 0.758 and a Q2-intercept of −0.489 (Figure 2B), confirming that the model was not overfitted and ensuring the reliability of subsequent biomarker screening (Figure 2).
Figure 2 Scatter plot of OPLS-DA model (A) and permutation test plot (B) of the LTBI and non-LTBI groups. (A) Scatter plot of the OPLS-DA model. The horizontal axis represents the score of the sample on the first principal component (t[1]) and the vertical axis represents the score of the sample on the second principal component (t[2]). The model showed clear separation between LTBI (red) and non-LTBI (blue) groups. (B) Permutation test plot with 200 permutations. The green circle represents the original model’s R2Y value and the blue square represents the original model’s Q2Y value. The permutation test yielded an R2-intercept of 0.758 and a Q2-intercept of −0.489, indicating that the model was not overfitted and had good predictive ability. Abbreviations: OPLS-DA, orthogonal partial least squares-discriminant analysis; LTBI, latent tuberculosis infection; R2Y, explanatory power of the model; Q2Y, predictive ability of the model.
Screening out differential metabolites
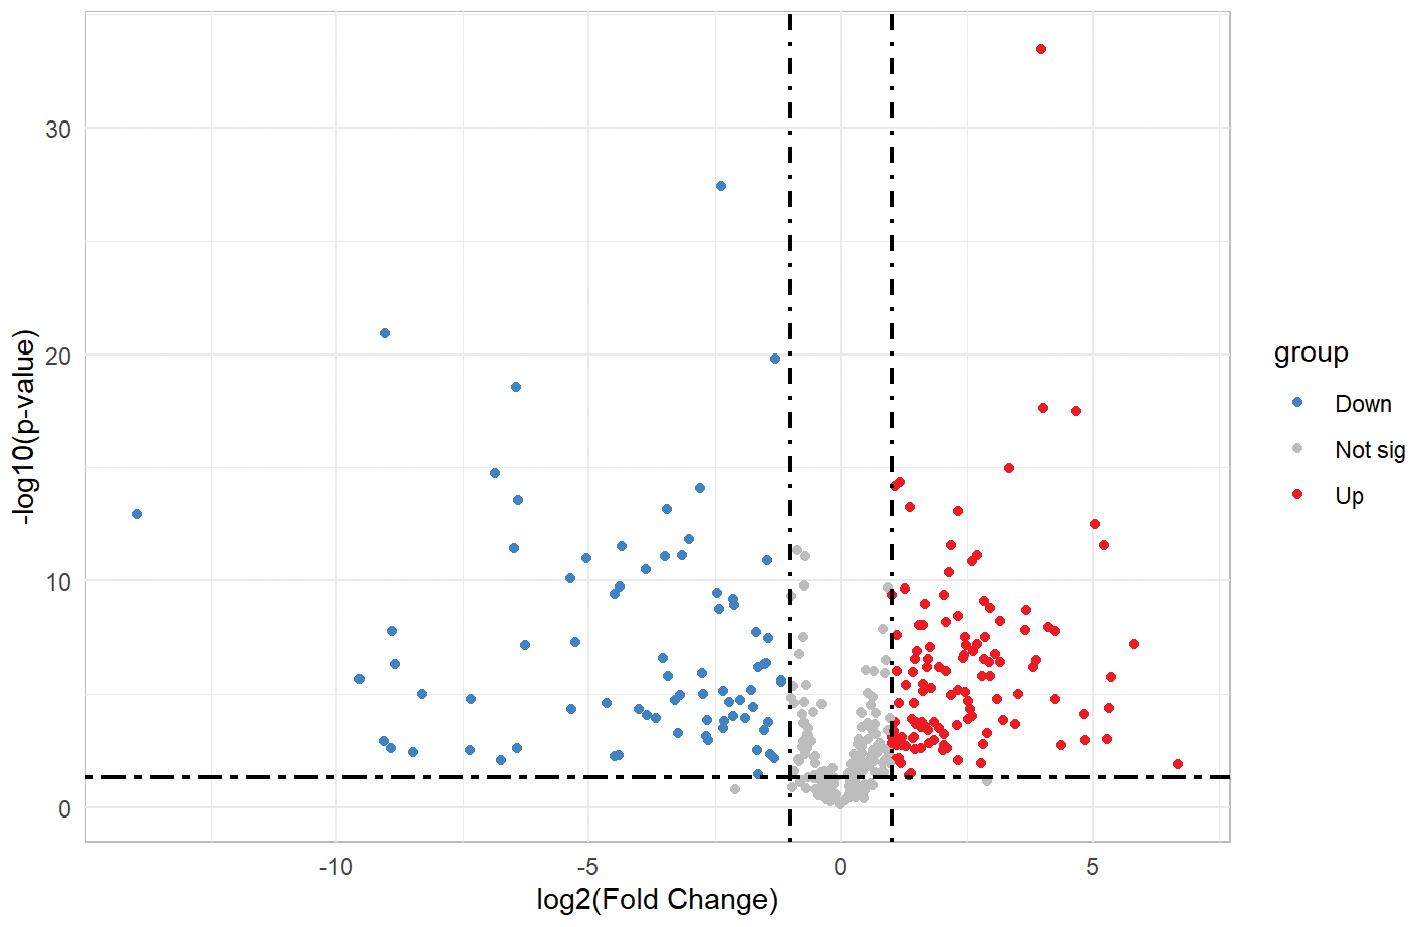
The orthogonal partial least squares discriminant analysis model was used to identify differential metabolites between the two groups based on the following filtering criteria: P < 0.05; FC > 2 or FC < 0.5; and variable importance in projection >1.0 in the positive ion mode. A total of 198 differentially expressed metabolites (76 downregulated and 122 upregulated) were revealed with expression discrepancies more pronounced towards the edges and peaks in a volcano plot visualization (Figure 3). A detailed description of the sequential metabolite selection process, including the number of metabolites retained at each stage, is provided in the Supplementary Materials.
Figure 3 Volcano plot of the metabolites derived from the LTBI and non-LTBI groups. The horizontal axis represents the multiple variation of differences in metabolites among different groups (log2fold change) and the vertical axis represents the level of significance of differences (−log10 (P-value)). Each point in the volcanic map represents a metabolite. Metabolites up-regulated were labeled red.
Functional enrichment analysis of differential metabolites
Table 2 presents the results of metabolic pathway enrichment analysis comparing the LTBI and non-LTBI groups. Eight metabolic pathways demonstrated significant enrichment (FDR < 0.05) after multiple testing correction. The most significantly enriched pathway was arginine biosynthesis (FDR = 1.49 × 10⁻²⁵; impact = 0.08), followed by porphyrin metabolism (FDR = 3.82 × 10⁻²²; impact = 0.13), and lysine degradation (FDR = 5.34 × 10⁻²⁰; impact = 0.00). Additional significantly enriched pathways included biotin metabolism, primary bile acid biosynthesis, caffeine metabolism, arginine and proline metabolism, and purine metabolism. The pathway impact scores ranged from 0.00–0.13 with porphyrin metabolism, and arginine and proline metabolism showing the highest impact values (0.13 and 0.12, respectively), suggesting that these pathways may have particularly important roles in distinguishing metabolic profiles between LTBI and non-LTBI individuals. These findings suggest potential associations with disease pathogenesis (Figure 4).
Figure 4 Enriched metabolic pathways between the LTBI and non-LTBI groups. The vertical axis of the enriched metabolic pathways plot represents the significance level of metabolic differences, expressed as −log10 (P). Each dot represents a metabolic pathway, where the color intensity indicates the significance level (darker color = higher significance), and the dot size reflects the impact factor (larger dot = greater impact).
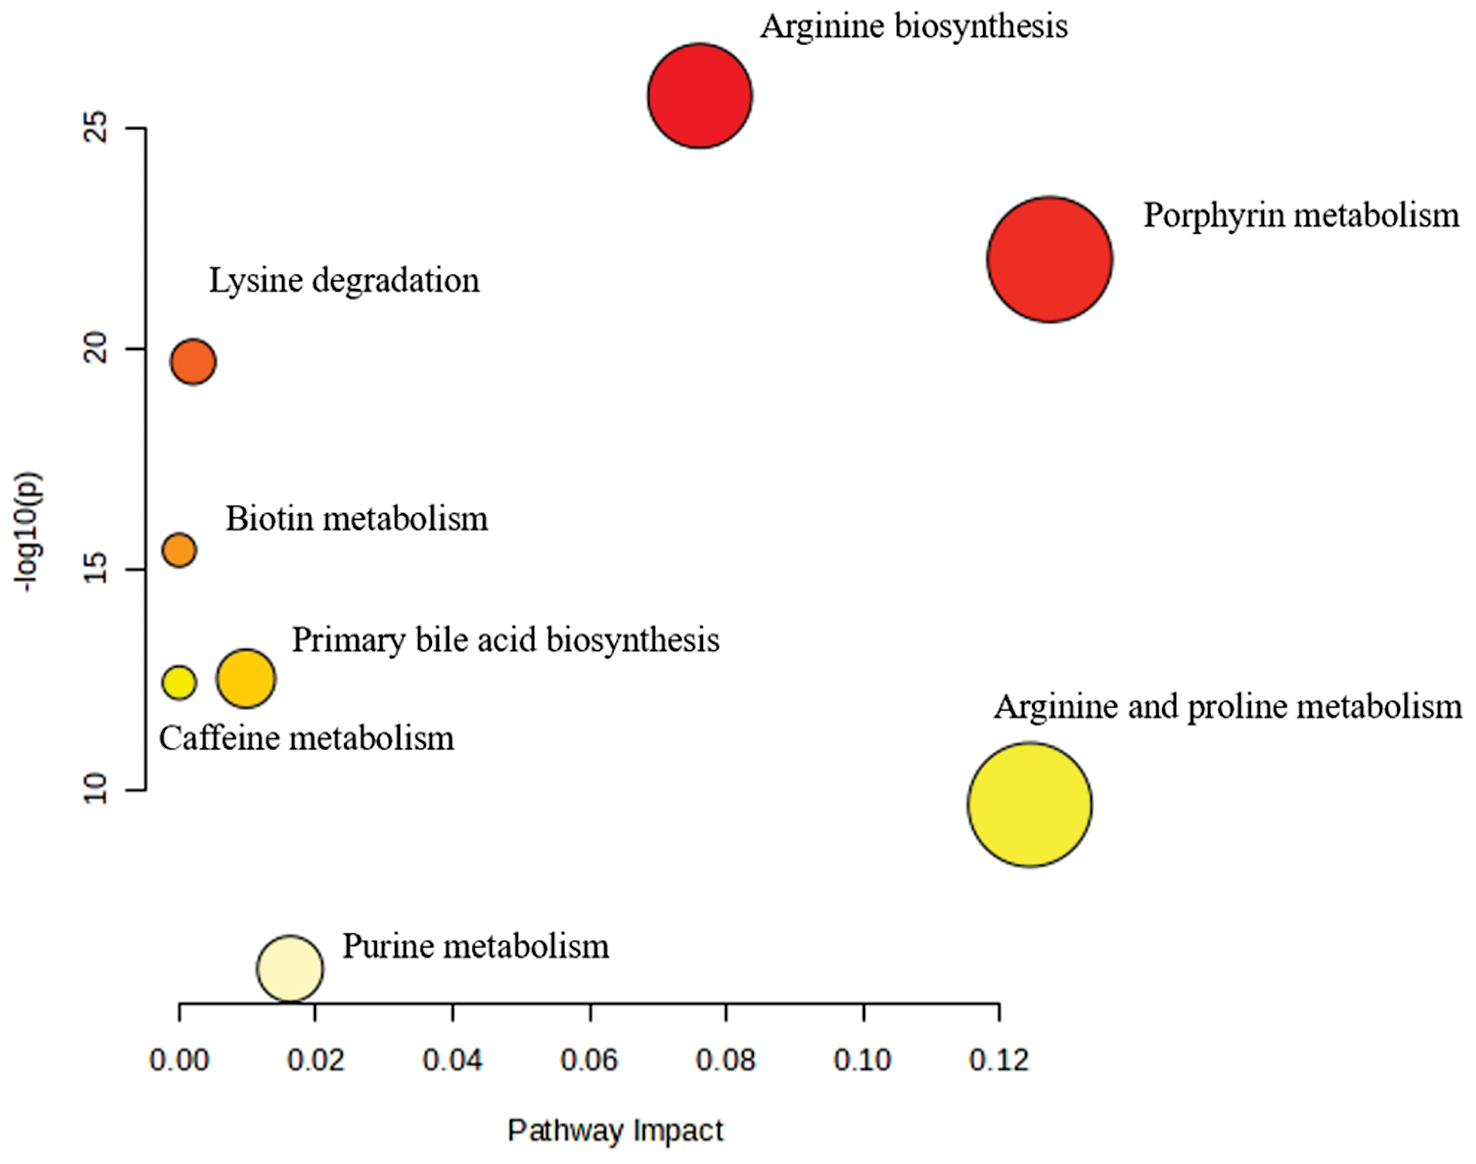
Table 2 Enriched Metabolic Pathways between LTBI and non-LTBI Groups
| Pathway Name | Total Compounds | Hits | Raw P-value | log10P | Holm adjust | FDR | Impact |
|---|---|---|---|---|---|---|---|
| Arginine biosynthesis | 14 | 2 | 1.86E-26 | 25.73 | 1.49E-25 | 1.49E-25 | 0.08 |
| Porphyrin metabolism | 31 | 2 | 9.55E-23 | 22.02 | 6.69E-22 | 3.82E-22 | 0.13 |
| Lysine degradation | 30 | 2 | 2.00E-20 | 19.70 | 1.20E-19 | 5.34E-20 | 0.00 |
| Biotin metabolism | 10 | 1 | 3.75E-16 | 15.43 | 1.88E-15 | 7.51E-16 | 0.00 |
| Primary bile acid biosynthesis | 46 | 1 | 3.07E-13 | 12.51 | 1.23E-12 | 4.91E-13 | 0.01 |
| Caffeine metabolism | 10 | 1 | 3.80E-13 | 12.42 | 1.23E-12 | 5.07E-13 | 0.00 |
| Arginine and proline metabolism | 36 | 1 | 2.23E-10 | 9.65 | 4.45E-10 | 2.54E-10 | 0.12 |
| Purine metabolism | 70 | 1 | 1.18E-6 | 5.93 | 1.18E-6 | 1.18E-6 | 0.02 |
Abbreviations: Holm adjust, Holm-adjusted P-value; FDR, false discovery rate.
Diagnostic performance of metabolites
Among the 198 significant differential metabolites screened, 43 candidate biomarkers were putatively identified (Metabolomics Standards Initiative [MSI] level 2) for distinguishing between the LTBI and non-LTBI groups (Supplementary Table 1). Univariate ROC analysis was performed to evaluate the discriminatory performance. Among the 43 candidate biomarkers, 4 putatively identified metabolites [leucylleucine, tryptophyl-phenylalanine, biliverdin, and lysoPE(18:1(11Z)/0:0)] showed relatively high AUC values (AUC > 0.8) in this discovery cohort (Figure 5, Supplementary Table 2). Specifically, leucylleucine had a notable AUC of 0.981 with 96% sensitivity and 94.9% specificity, demonstrating an FC of 32.95 compared to the non-LTBI group. Moreover, tryptophyl-phenylalanine had an AUC of 0.975 with a sensitivity of 96% and specificity of 97%.
Figure 5 Individual ROC curve and combined ROC curve diagnostic model of multiple metabolites for differentiation between LTBI and non-LTBI.
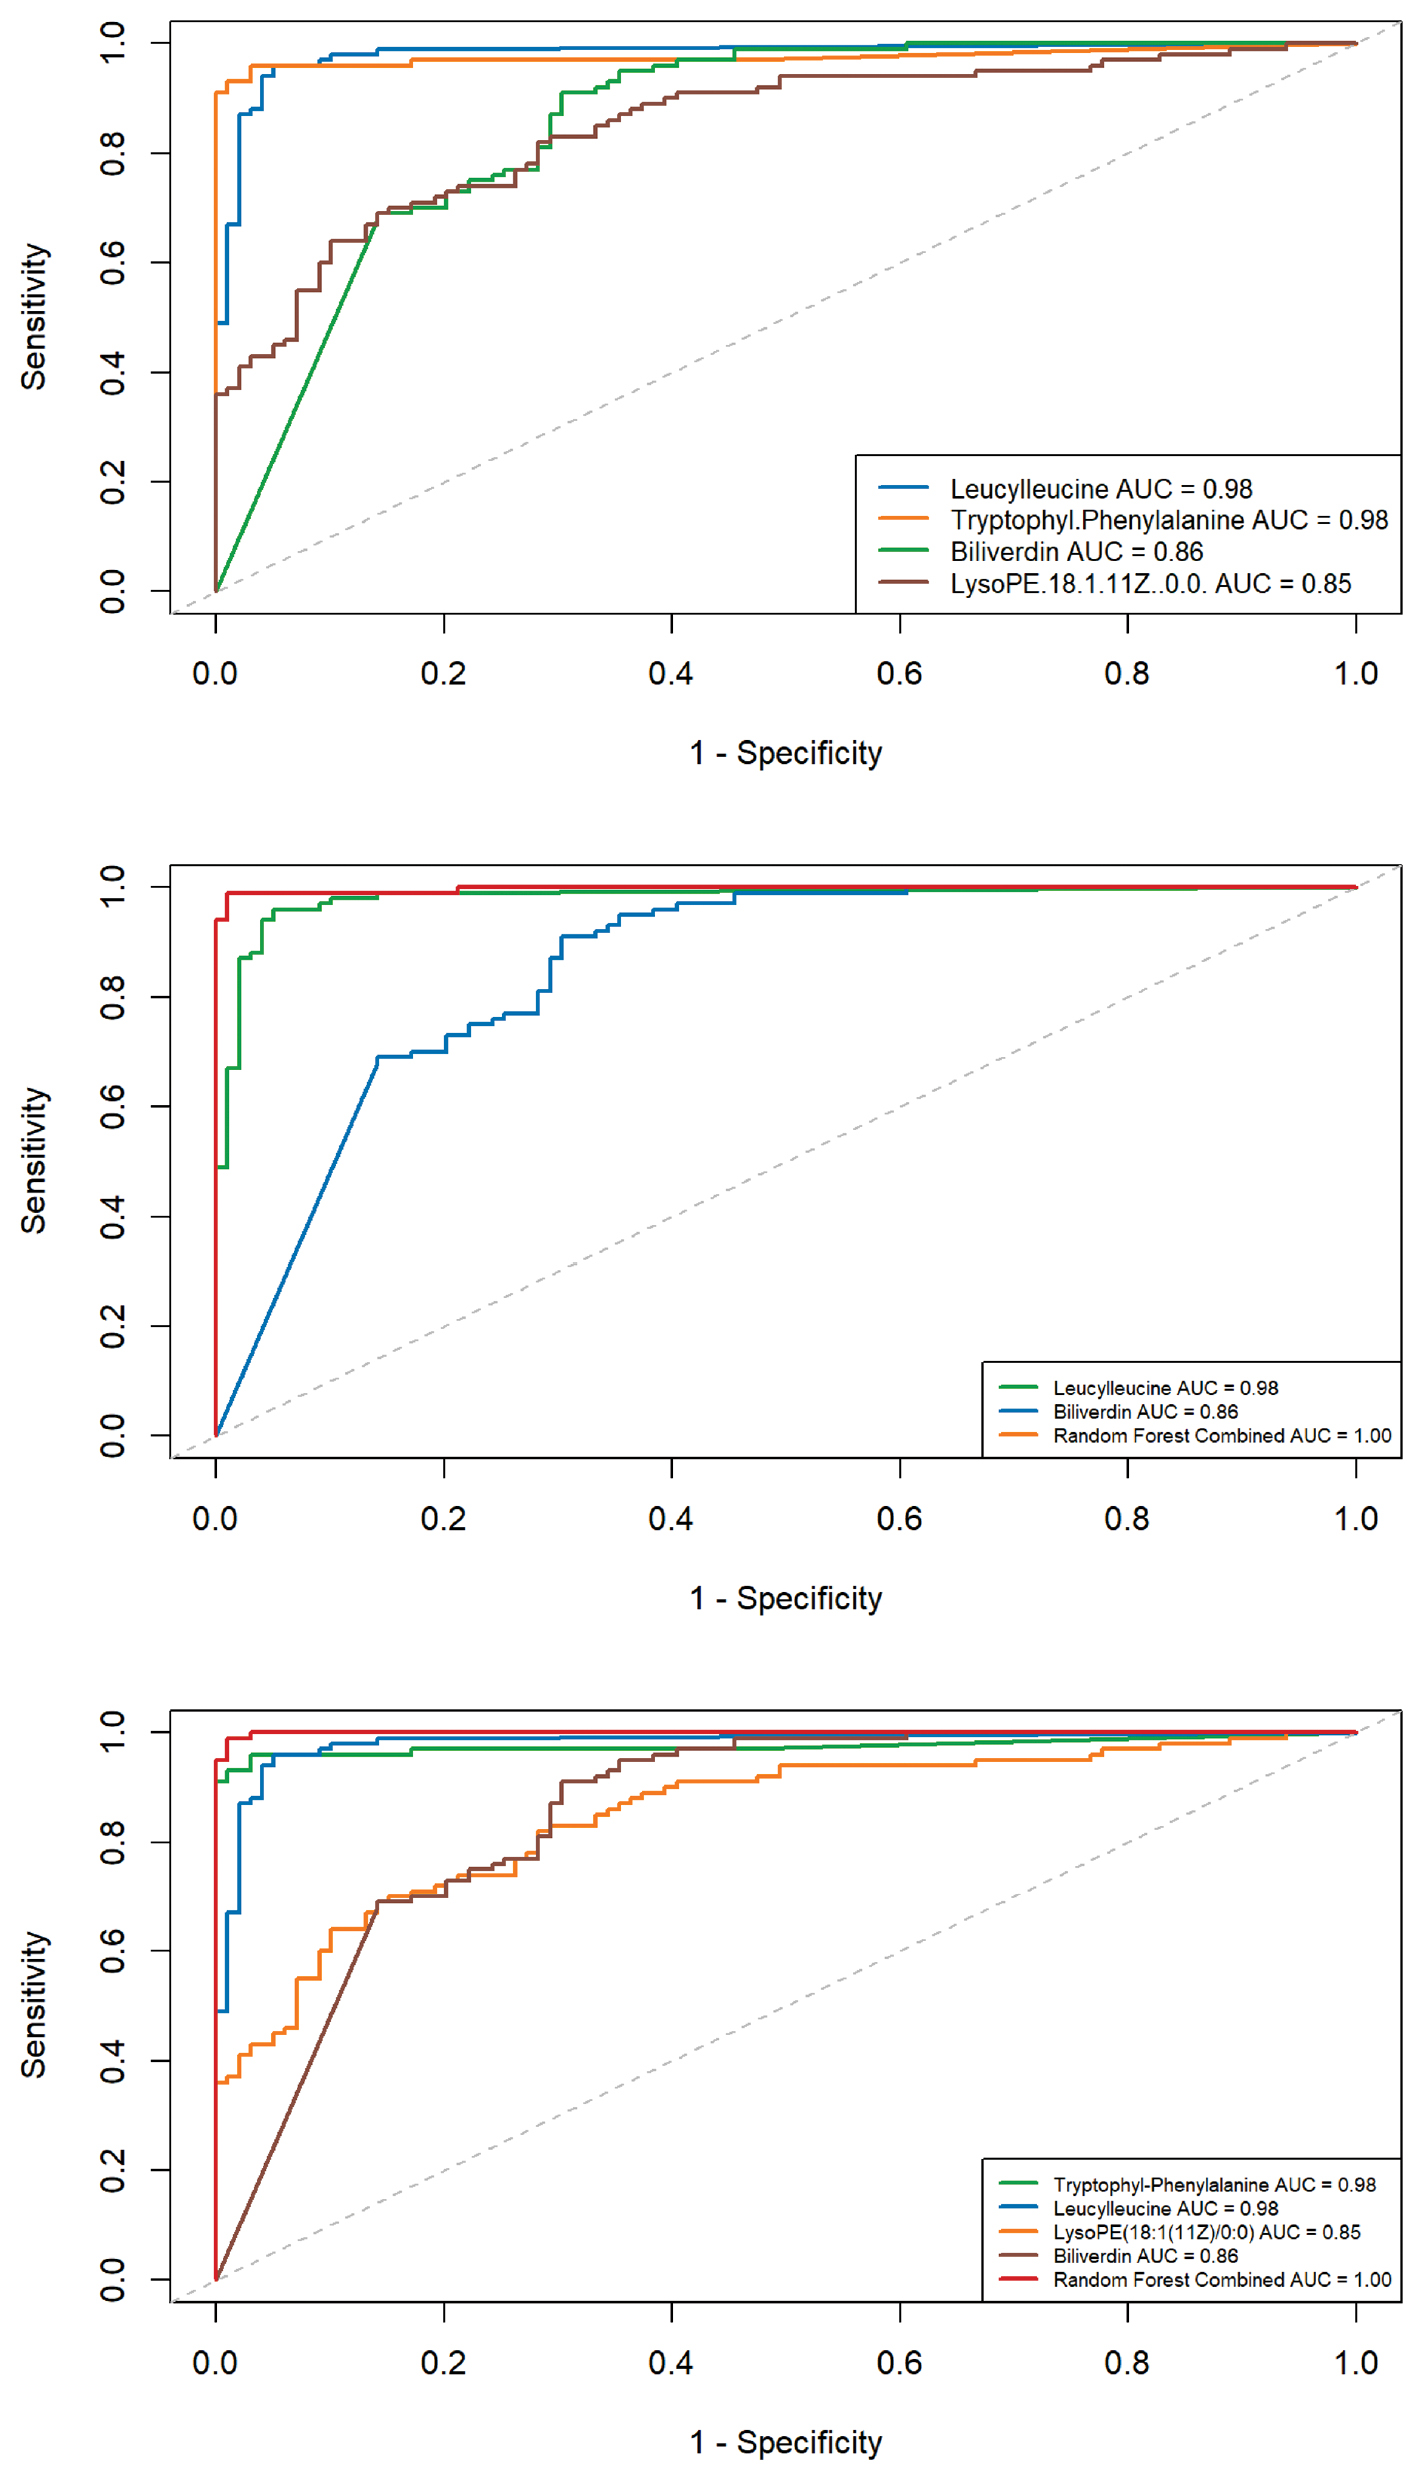
Furthermore, a random forest model was applied to determine whether combining multiple metabolites could improve discriminatory performance. The combined AUCs were generally higher than the individual metabolites. For example, the combination of leucylleucine and tryptophyl-phenylalanine yielded an AUC of 0.995 with a sensitivity of 94% and specificity of 97% (Supplementary Figure 2). The pairwise combination of leucylleucine and biliverdin had an AUC of 1.00 with 100% sensitivity and specificity (Figure 5). Combinations of three or four metabolites also resulted in AUC values approaching 1. However, it should be noted that feature selection and model evaluation were performed within the same discovery cohort. Therefore, these high AUC values, particularly the AUC values approaching 1.0, are likely optimistic due to overfitting and should be interpreted with caution. Notably, all four metabolites were identified at MSI level 2 without authentic standards. Definitive structural confirmation, especially for isomeric compounds, such as lysoPE species, requires targeted quantitative validation.
Five-fold cross-validation was repeated 5 times to assess the robustness of the random forest model. The cross-validated model achieved an AUC of 0.9998 (95% CI, 0.9996–1.0000) with a sensitivity of 0.998 and specificity of 0.986 (Supplementary Table 3).
Multivariable linear regression was used to adjust for these factors when analyzing the four key metabolites because age and smoking status differed between the LTBI and non-LTBI groups at baseline (median age, 56.0 vs. 42.0 years; P = 0.001 and current smokers, 17.7% vs. 4.1%; P = 0.002). Age, gender, and smoking status were included as covariates in the models. After adjustment, all four metabolites remained significantly associated with LTBI status (all FDR < 0.001). Specifically, leucylleucine (adjusted P = 7.20 × 10−50), tryptophyl-phenylalanine (adjusted P = 2.51 × 10⁻²⁴), biliverdin (adjusted P = 2.66 × 10⁻¹⁵), and lysoPE(18:1(11Z)/0:0) [adjusted P = 8.58 × 10⁻⁸] continued to differ between the LTBI and non-LTBI groups after adjustment (Table 3, Supplementary Table 4). These results suggested that the observed associations are not fully explained by age, gender, or smoking, although residual confounding cannot be excluded.
Table 3 Multivariable Linear Regression Analysis of Four Key Metabolites Adjusting for Age and Smoking
| Metabolite | Raw P-value | Adjusted P-valuea | FDR-adjusted P-value | β (95% CI)b |
|---|---|---|---|---|
| Leucylleucine | 2.49 × 10−67 | 7.20 × 10−50 | 2.88 × 10−49 | 4.15 (3.75, 4.55) |
| Tryptophyl-phenylalanine | 4.99 × 10−38 | 2.51 × 10⁻²⁴ | 5.03 × 10⁻²⁴ | 3.45 (2.88, 4.02) |
| Biliverdin | 1.25 × 10⁻²⁰ | 2.66 × 10⁻¹⁵ | 3.55 × 10⁻¹⁵ | −3.41 (−4.19, −2.63) |
| LysoPE(18:1(11Z)/0:0) | 3.72 × 10⁻¹³ | 8.58 × 10⁻⁸ | 8.58 × 10⁻⁸ | 0.65 (0.42, 0.88) |
aAdjusted for age (continuous) and smoking status (categorical [never, former, or current]); bβ coefficient represents the log-transformed fold change between LTBI and non-LTBI groups after adjustment; 95% confidence intervals are shown in parentheses.
Discussion
Metabolomics-based approaches have become indispensable for screening candidate biomarkers and optimizing clinical intervention strategies for TB. Identification of optimal metabolic biomarkers could facilitate early recognition of an LTBI and provide mechanistic insights into how MTB evades host immune defense and establishes persistent latency. In the present untargeted metabolomics study, four plasma metabolites exhibited significant differential expression between LTBI and non-LTBI individuals. Specifically, leucylleucine, tryptophyl-phenylalanine, and lysoPE(18:1(11Z)/0:0) were significantly upregulated in the LTBI group, whereas biliverdin was markedly downregulated. Among these molecules, tryptophyl-phenylalanine and leucylleucine represent novel TB-associated metabolites that have not been reported in previous studies and both showed excellent diagnostic performance in our cohort. However, because feature selection and model evaluation were performed within the same discovery cohort without external validation, these performance estimates should be interpreted cautiously. Notably, the associations of the four key metabolites with LTBI remained statistically significant after adjustment for age and smoking status, indicating that the diagnostic potential is robust against these common confounding factors.
Tryptophyl-phenylalanine is a dipeptide formed from tryptophan and phenylalanine. Some dipeptides exert physiologic regulatory effects and participate in cell signaling, while most dipeptides act as intermediate metabolites in amino acid catabolism following protein hydrolysis [14]. The exact physiologic function of tryptophyl-phenylalanine is poorly defined and requires further investigation. Previous studies have demonstrated gradually decreased peripheral tryptophan levels during the progression from LTBI to active TB, which is largely attributed to the upregulation of indoleamine 2,3-dioxygenase (IDO). As a rate-limiting enzyme, IDO catalyzes tryptophan degradation into kynurenine. MTB can independently synthesize tryptophan to evade persistent IDO-mediated tryptophan depletion, thereby maintaining intracellular survival and proliferation [15]. In addition, elevated phenylalanine abundance has been observed in active TB compared to LTBI, implying progressive metabolic reprogramming along TB disease progression [16]. The current study revealed increased plasma tryptophyl-phenylalanine in LTBI individuals. Nevertheless, the biological role of this dipeptide in MTB infection is unclear. Thus, the observed increase in this dipeptide is an association that should not be mistaken for a proven mechanism. The increased plasma tryptophyl-phenylalanine may merely serve as a metabolic signature of the host–pathogen interaction but this interpretation remains hypothetical.
Plasma leucylleucine was significantly elevated in LTBI patients. MTB relies on a tightly regulated Clp protease system to maintain cellular homeostasis and achieve long-term latent survival in the host [17]. The Clp system is critical for MTB growth and virulence, in which ClpP1 and ClpP2 assemble into the ClpP1P2 tetradecamer, which is dependent on the activating peptide, benzyloxycarbonyl-leucyl-leucine [18]. However, direct in vivo evidence linking circulating leucylleucine to the activity of the MTB Clp system is lacking. The current mechanistic interpretation remains speculative and warrants further experimental validation.
LysoPE(18:1(11Z)/0:0) belongs to lysophospholipids (LPLs), which are key intermediates in phospholipid biosynthesis and essential components of biological membranes. LPLs also act as important signaling molecules and mediate a wide range of biological processes [19]. Accumulating evidence indicates that specific LPLs support bacterial adaptation and proliferation under stress conditions and participate in the regulation of bacterial pathogenicity [20]. Lysophosphatidylethanolamine (LysoPE) is the second most abundant lysoglycerophospholipid in human blood with physiologic concentrations ranging from 10–50 μM and accounting for approximately 1% of total serum phospholipids [21]. LysoPE serves as an important growth factor and extracellular regulator for eukaryotic cells and bacterial-derived LysoPE can be released into the microenvironment following bacterial lysis [22]. In this study plasma lysoPE(18:1(11Z)/0:0) was upregulated in LTBI, which is inconsistent with previous findings of decreased LysoPE in pulmonary [23] and spinal TB [24]. Such a discrepancy may be attributed to distinct host metabolic responses between latent and active TB states. Given that current evidence is indirect, the exact biological function of LysoPE in LTBI pathogenesis remains to be clarified.
In contrast to the three upregulated metabolites, biliverdin was significantly reduced in LTBI individuals. Biliverdin is a central intermediate in heme metabolism and generated via heme degradation catalyzed by heme oxygenase-1 (HO-1), which is commonly induced under inflammation and pathogen infection. HO-1 upregulation has been well-documented during MTB infection, modulating host immune responses and oxidative stress homeostasis [25]. Moreover, MTB encodes a biliverdin reductase-like enzyme that converts biliverdin to bilirubin, suggesting that MTB may actively interfere with host heme metabolism during infection [26]. These mechanisms provide a plausible explanation for the decreased biliverdin levels observed in our LTBI cohort. Even so, the causal relationship between biliverdin metabolism and MTB latency has not been clarified. Downregulation of biliverdin may primarily reflect host metabolic adaptation to MTB infection rather than a direct pathogenic mechanism [27] and further experimental studies are warranted to validate the biological implication.
Mounting evidence suggests that MTB infection is associated with immunometabolic reprogramming in host immune cells, which may influence infection outcomes that range from bacterial control to persistent latency [28–31]. In this context, the metabolic alterations observed in the current study represent associations between host metabolic profiles and LTBI status, rather than mechanistic evidence. The IDO-mediated tryptophan–kynurenine pathway is widely recognized as an important immunoregulatory cascade that suppresses T-cell responses during LTBI [29]. Based on this background, the increased tryptophyl-phenylalanine observed in the LTBI cohort may be associated with alterations in host tryptophan metabolism linked to immune regulation. Lipid metabolic remodeling, particularly alterations in lysophospholipid species, such as LysoPE, has been implicated in host immune regulation and bacterial adaptation under stress conditions [30]. The elevated LysoPE observed in LTBI is consistent with reported lipid metabolic perturbations during infection. Heme metabolism is another pathway known to be affected during MTB infection with HO-1–mediated catabolism influencing oxidative stress responses and immune regulation [25–27]. The decreased biliverdin observed in LTBI may reflect alterations in host heme metabolism associated with infection status. Pathway enrichment analysis further identified arginine biosynthesis as significantly altered, which is consistent with the known role in macrophage immunometabolic regulation and nitric oxide–mediated antimicrobial activity [31]. Overall, these findings suggest that LTBI is associated with coordinated metabolic differences in the host, which may reflect underlying biological processes that warrant further investigation.
Several limitations of this exploratory study should be explicitly acknowledged. First, all participants were recruited from a single geographic region in China and no independent external validation cohort was included, which inevitably limits the generalizability of the findings. The present results should therefore be regarded as preliminary and hypothesis-generating, and clinical application is premature before rigorous validation in independent cohorts. Second, LTBI and non-LTBI individuals were enrolled from different source populations (close contacts of active TB patients versus prison detainees). Differences in socioeconomic status, lifestyle, and environmental exposures may independently affect metabolomic profiles, thereby introducing potential selection bias and residual confounding. The intergroup metabolic differences should thus be interpreted cautiously and future studies are recommended to recruit both groups from the same source population to minimize selection bias. Third, although 5-fold repeated cross-validation was applied to mitigate overfitting, feature selection and diagnostic model evaluation were both performed within the same discovery cohort. Such internal modeling tends to generate overly optimistic diagnostic performance and the true accuracy of these biomarkers can only be validated in external independent cohorts. Fourth, dedicated functional experiments were not conducted to elucidate the mechanistic roles of the four identified metabolites. In addition, this study adopted an untargeted metabolomics strategy, which may compromise quantitative precision and definitive structural identification, especially for low-abundance metabolites and isomeric compounds. Systematic methodologic validation, including precision, extraction recovery, matrix effect and metabolite stability, according to bioanalytical guidelines was not performed at this discovery stage. The four key metabolites were annotated at MSI level 2 based on accurate mass matching (< 5 ppm mass error), MS/MS fragmentation alignment with public databases (HMDB and METLIN), and literature-consistent retention time. This level of identification is insufficient for definitive structural confirmation, especially for low-abundance or isomeric compounds, such as LysoPE species. No authentic standards were used for definitive confirmation, which remains an inherent limitation of the current work. Therefore, targeted quantitative validation with authentic standards in multicenter independent cohorts is indispensable before the clinical translation of these candidate biomarkers. Furthermore, the absence of pooled quality control samples, a standard requirement for untargeted metabolomics, limits our ability to assess batch-to-batch variation and feature stability. While internal standards showed acceptable consistency, internal standards do not replace pooled QC for comprehensive technical variability assessment.
Despite the above limitations, this exploratory study first characterized the plasma metabolic profiling of LTBI and screened four promising biomarker candidates. To advance clinical translation, future research should focus on the following: (1) validating the diagnostic efficacy of the four metabolites in multicenter independent cohorts using targeted quantitative metabolomics with authentic chemical standards; (2) enrolling LTBI and non-LTBI subjects from identical source populations to reduce selection bias; and (3) performing functional experiments, such as in vitro MTB-macrophage infection models to clarify the biological mechanisms underlying these metabolic perturbations. These efforts will help establish the clinical utility of the identified biomarkers and deepen our mechanistic understanding of LTBI pathophysiology.
Conclusion
This exploratory untargeted metabolomics study observed differences in plasma metabolic profiles between LTBI and non-LTBI individuals and highlighted four metabolites [leucylleucine, tryptophyl-phenylalanine, biliverdin, and lysoPE(18:1(11Z)/0:0)] as potentially relevant to LTBI status. However, several important limitations need to be emphasized. The LTBI and non-LTBI groups were recruited from different populations, which introduces potential selection bias and confounding from unmeasured environmental and socioeconomic factors. Moreover, diagnostic performance was evaluated within a single discovery cohort without independent external validation. Although cross-validation was performed, the risk of overfitting remains, and the reported AUC values should not be interpreted as true estimates of clinical accuracy. In addition, metabolite identification was based on MSI level 2 annotation without validation using authentic standards and no targeted quantitative analysis was conducted. These factors limit the robustness and reproducibility of the reported biomarkers.
Data availability statement
Please contact the first author for data requests.
Ethics statement
This study was reviewed and approved by the Ethics Committee of the Jiangsu Provincial Center for Disease Control and Prevention (Ethical approval number: JSJK2023-B029-02).
Author contributions
Qiao Liu and Wenliang Ji conceived the study; Xinnan Wang and Yuchen Pan analyzed the data and drafted the manuscript; Deye Liu and Cheng Chen participated in the study design; Xinnan Wang, Yuchen Pan, Zheng Sun and Hao Zhang implemented the laboratory testing; Leonardo Martinez participated in the study design and helped draft the manuscript. All authors contributed to the study and have read and approved the final manuscript.
Funding
This study was supported by the Jiangsu Provincial Medical Key Discipline (ZDXK202250), the National Natural Science Foundation of China (82003516), and the Medical Scientific Research General Project of the Jiangsu Health Commission (M2020020).
Acknowledgments
We thank the faculty and staff at the study sites for their support. The graphical abstract was created using R software (version 4.3.2; R Foundation for Statistical Computing, Vienna, Austria).
Conflicts of interest
The authors declare that there are no conflicts of interest.
Patient and public involvement
Patients and/or the public were not involved in the design, conduct, reporting or dissemination plans of this research. Refer to the Methods section for further details.
Patient consent for publication
All eligible participants signed written informed consent.
Supplementary materials
Supplementary Material can be downloaded from https://bio-integration.org/wp-content/uploads/2026/06/bioi20260003_Supplemental.pdf.
Graphical abstract
Highlights
- Plasma metabolic profiles differed between the LTBI and non-LTBI individuals.
- Four metabolites were identified as associated with LTBI status.
- Combined models showed high apparent performance under internal validation.
- Findings are limited by population differences and lack of external validation.
- Further validation using targeted metabolomics is required.
In brief
This exploratory study identified plasma metabolic differences associated with latent tuberculosis infection but the findings remain preliminary and require further validation.
References
- WHO. Latent tuberculosis infection: updated and consolidated guidelines for programmatic management. Geneva: World Health Organization; 2018.
- Cui X, Gao L, Cao B. Management of latent tuberculosis infection in China: Exploring solutions suitable for high-burden countries. Int J Infect Dis 2020;92S:S37-40. [PMID: 32114201 DOI: 10.1016/j.ijid.2020.02.034]
- WHO. Global tuberculosis report 2023. Geneva: World Health Organization; 2023.
- Zellweger JP, Sotgiu G, Corradi M, Durando P. The diagnosis of latent tuberculosis infection (LTBI): currently available tests, future developments, and perspectives to eliminate tuberculosis (TB). Med Lav 2020;111(3):170-83. [PMID: 32624559 DOI: 10.23749/mdl.v111i3.9983]
- Cho Y, Park Y, Sim B, Kim J, Lee H, et al. Identification of serum biomarkers for active pulmonary tuberculosis using a targeted metabolomics approach. Sci Rep 2020;10(1):3825. [DOI: 10.1038/s41598-020-60669-0]
- Luo D, Yang BY, Qin K, Shi CY, Wei NS, et al. Untargeted metabolomics of feces reveals diagnostic and prognostic biomarkers for active tuberculosis and latent tuberculosis infection: potential application for precise and non-invasive identification. Infect Drug Resist 2023;16:6121-38. [PMID: 37719654 DOI: 10.2147/IDR.S422363]
- Deng J, Liu L, Yang Q, Wei C, Zhang H, et al. Urinary metabolomic analysis to identify potential markers for the diagnosis of tuberculosis and latent tuberculosis. Arch Biochem Biophys 2021;704:108876. [PMID: 33864753 DOI: 10.1016/j.abb.2021.108876]
- Zheng F, Zhao X, Zeng Z, Wang L, Lv W, et al. Development of a plasma pseudotargeted metabolomics method based on ultra-high-performance liquid chromatography-mass spectrometry. Nat Protoc 2020;15(8):2519-37. [PMID: 32581297 DOI: 10.1038/s41596-020-0341-5]
- Yu Y, Jiang XX, Li JC. Biomarker discovery for tuberculosis using metabolomics. Front Mol Biosci 2023;10:1099654. [PMID: 36891238 DOI: 10.3389/fmolb.2023.1099654]
- Pai M, Zwerling A, Menzies D. Systematic review: T-cell-based assays for the diagnosis of latent tuberculosis infection: an update. Ann Intern Med 2008;149(3):177-84. [PMID: 18593687 DOI: 10.7326/0003-4819-149-3-200808050-00241]
- Wishart DS, Guo A, Oler E, Wang F, Anjum A, et al. HMDB 5.0: the Human Metabolome Database for 2022. Nucleic Acids Res 2022;50(D1):D622-31. [PMID: 34986597 DOI: 10.1093/nar/gkab1062]
- Brown M, Dunn WB, Dobson P, Patel Y, Winder CL, et al. Mass spectrometry tools and metabolite-specific databases for molecular identification in metabolomics. Analyst 2009;134(7):1322-32. [PMID: 19562197 DOI: 10.1039/b901179j]
- Xia J, Psychogios N, Young N, Wishart DS. MetaboAnalyst: a web server for metabolomic data analysis and interpretation. Nucleic Acids Res 2009;37(Web Server issue):W652-60. [PMID: 19429898 DOI: 10.1093/nar/gkp356]
- Wang LJ, Chou WJ, Tsai CS, Lee MJ, Lee SY, et al. Novel plasma metabolite markers of attention-deficit/hyperactivity disorder identified using high-performance chemical isotope labelling-based liquid chromatography-mass spectrometry. World J Biol Psychiatry 2021;22(2):139-48. [PMID: 32351159 DOI: 10.1080/15622975.2020.1762930]
- Collins JM, Siddiqa A, Jones DP, Liu K, Kempker RR, et al. Tryptophan catabolism reflects disease activity in human tuberculosis. JCI Insight 2020;5(10):e137131. [PMID: 32369456 DOI: 10.1172/jci.insight.137131]
- Weiner J 3rd, Parida SK, Maertzdorf J, Black GF, Repsilber D, et al. Biomarkers of inflammation, immunosuppression and stress with active disease are revealed by metabolomic profiling of tuberculosis patients. PLoS One 2012;7(7):e40221. [PMID: 22844400 DOI: 10.1371/journal.pone.0040221]
- Vahidi S, Ripstein ZA, Juravsky JB, Rennella E, Goldberg AL, et al. An allosteric switch regulates Mycobacterium tuberculosis ClpP1P2 protease function as established by cryo-EM and methyl-TROSY NMR. Proc Natl Acad Sci USA 2020;117(11):5895-906. [PMID: 32123115 DOI: 10.1073/pnas.1921630117]
- Famulla K, Sass P, Malik I, Akopian T, Kandror O, et al. Acyldepsipeptide antibiotics kill mycobacteria by preventing the physiological functions of the ClpP1P2 protease. Mol Microbiol 2016;101(2):194-209. [PMID: 26919556 DOI: 10.1111/mmi.13362]
- Grzelczyk A, Gendaszewska-Darmach E. Novel bioactive glycerol-based lysophospholipids: new data – new insight into their function. Biochimie 2013;95(4):667-79. [PMID: 23089136 DOI: 10.1016/j.biochi.2012.10.009]
- Cao X, van Putten JPM, Wösten MMSM. Chapter Two – Biological functions of bacterial lysophospholipids. In: Poole RK, Kelly DJ, editors. Advances in microbial physiology. Volume 82. Academic Press; 2023. pp. 129-54.
- Tan ST, Ramesh T, Toh XR, Nguyen LN. Emerging roles of lysophospholipids in health and disease. Prog Lipid Res 2020;80:101068. [PMID: 33068601 DOI: 10.1016/j.plipres.2020.101068]
- Zou D, Pei J, Lan J, Sang H, Chen H, et al. A SNP of bacterial blc disturbs gut lysophospholipid homeostasis and induces inflammation through epithelial barrier disruption. Ebiomedicine 2020;52:102652. [PMID: 32058942 DOI: 10.1016/j.ebiom.2020.102652]
- Chen JX, Han YS, Zhang SQ, Li ZB, Chen J, et al. Novel therapeutic evaluation biomarkers of lipid metabolism targets in uncomplicated pulmonary tuberculosis patients. Signal Transduct Target Ther 2021;6(1):22. [PMID: 33462176 DOI: 10.1038/s41392-020-00427-w]
- Wang C, Lou C, Yang Z, Shi J, Niu N. Plasma metabolomic analysis reveals the metabolic characteristics and potential diagnostic biomarkers of spinal tuberculosis. Heliyon 2024;10(7):e27940. [PMID: 38571585 DOI: 10.1016/j.heliyon.2024.e27940]
- Scharn CR, Collins AC, Nair VR, Stamm CE, Marciano DK, et al. Heme oxygenase-1 regulates inflammation and mycobacterial survival in human macrophages during Mycobacterium tuberculosis infection. J Immunol 2016;196(11):4641-9. [PMID: 27183573 DOI: 10.4049/jimmunol.1500434]
- Ahmed FH, Mohamed AE, Carr PD, Lee BM, Condic-Jurkic K, et al. Rv2074 is a novel F420H2-dependent biliverdin reductase in Mycobacterium tuberculosis. Protein Sci 2016;25(9):1692-709. [PMID: 27364382 DOI: 10.1002/pro.2975]
- Yi WJ, Han YS, Wei LL, Shi LY, Huang H, et al. L-Histidine, arachidonic acid, biliverdin, and L-cysteine-glutathione disulfide as potential biomarkers for cured pulmonary tuberculosis. Biomed Pharmacother 2019;116:108980. [PMID: 31125821 DOI: 10.1016/j.biopha.2019.108980]
- Sun Y, Cui A, Dong H, Nie L, Yue Z, et al. Intermittent hyperglycaemia induces macrophage dysfunction by extracellular regulated protein kinase-dependent PKM2 translocation in periodontitis. Cell Prolif 2024;57(10):e13651. [PMID: 38790140 DOI: 10.1111/cpr.13651]
- Yang G, Dong C, Wu Z, Wu P, Yang C, et al. Single-cell RNA sequencing-guided engineering of mitochondrial therapies for intervertebral disc degeneration by regulating mtDNA/SPARC-STING signaling. Bioact Mater 2025;48:564-82. [PMID: 40104024 DOI: 10.1016/j.bioactmat.2025.02.036]
- Li M, Sun X, Zeng L, Sun A, Ge J. Metabolic homeostasis of immune cells modulates cardiovascular diseases. Research (Wash D C) 2025;8:0679. [PMID: 40270694 DOI: 10.34133/research.0679]
- Gong W, Fu H, Yang K, Zheng T, Guo K, et al. 4-Octyl itaconate blocks GSDMB-mediated pyroptosis and restricts inflammation by inactivating granzyme A. Cell Prolif 2024;57(12):e13711. [PMID: 38982510 DOI: 10.1111/cpr.13711]