Finite Element Analysis of Orthodontic Relapse in Different Maxillary Arch Form
1Department of Stomatology, Sun Yat-sen Memorial Hospital, Sun Yat-sen University, 107 West Yanjiang Road, Guangzhou 510120, China
2Guanghua School of Stomatology, Sun Yat-sen University, No. 42, Lingyuan West Road, Guangzhou, China
*Correspondence to: Shaohai Chang, MD: associate professor, E-mail: changshaoh@126.com
Yuanyuan Li, MD: resident, E-mail: wsbnoooo@hotmail.com; Yiting Shao, MD: resident, E-mail: 1065431098@qq.com; Yansong Yu, MD: attending doctor, E-mail: dryuys@163.com; Yushan Ye, MD: attending doctor, E-mail: yeyushan2000@163.com; Yingjuan Lu, PhD: attending doctor, E-mail: Ruky1026@163.com
Received: April 15 2021; Revised: May 20 2021; Accepted: August 13 2021; Published Online: November 11 2021
Cite this paper:
Yuanyuan Li, Yiting Shao, Yansong Yu, Yushan Ye, Yingjuan Lu and Shaohai Chang. Finite Element Analysis of Orthodontic Relapse in Different Maxillary Arch Form. BIO Integration 2021; 2(4): 152–160.
DOI: 10.15212/bioi-2021-0012. Available at: https://bio-integration.org/
Download citation 
© 2021 The Authors. This is an open access article distributed under the terms of the Creative Commons Attribution License (https://creativecommons.org/licenses/by/4.0/). See https://bio-integration.org/copyright-and-permissions/
Abstract
Background: Orthodontic relapse is fairly common; however, the mechanisms between relapse and the dental arch form remain unclear. The purpose of our study was to establish three-dimensional (3D) finite element models of different dental arch forms after orthodontic treatment and to analyze the states of different arches applied with various sagittal forces.
Methods: By calculating the equations of different dental arch forms and combining them with a full maxillary arch (14 teeth), 3D finite element models of square, oval, and tapered dental arches were established; they were designed to be subjected to anterior lingual, posterior mesial, and combined forces, respectively.
Results: The von Mises stress and displacement of teeth under different forces were calculated for each loading scenario. Under the different forcing scenarios, all incisors had irregularity trends, and the inclination and intrusion of the canines were increased, and the premolars had a tendency to buccal or lingual crown tipping or even intrusion in our study. The tapered arch was the most stable and had the smallest displacement and von Mises stress, followed by the ovoid arch; the most unstable arch was the square arch.
Conclusions: To achieve a stable orthodontic effect, a tapered or ovoid arch, rather than a square arch, should be chosen as the final outcome of treatment.
Keywords
Dental arch form, finite element analysis, oral biomechanics, orthodontic relapse.
Introduction
Stability after orthodontic treatment has always been a key problem for orthodontists, as the teeth and jaws have a tendency to return to their former positions, which is called orthodontic relapse [1]. Relapse mostly manifests as crowded anterior teeth or individual tooth rotation, dental spaces, recurrence of maxillary protrusion, and overbite in class II patients or deepening crossbite in class III patients [2]. These recurrent problems can be difficult for orthodontics to solve and lead to confidence issues in patients. The best way to improve performance is to maintain the correct treatment effect [3].
Historically, relapses are related to the following factors: periodontal and gingival tissues, occlusion, maxillofacial soft tissue, growth and development, third molar, or temporal mandibular joint [4–7]. Human maxillofacial soft and hard tissue structures as well as dental arch shapes vary by racial group and affect arch stability after orthodontic treatment [8–10]. The shape of the dental arch changes in width and length during treatment, and a subsequent problem is the retention of the dental arch shape [11, 12]. In addition, clinicians pay more attention to the extra force loaded in the arches, which breaks the balance between the internal and external dental arches, causing relapse [13–16].
Many clinicians use a classification based on the arrangement of the six anterior teeth: square, ovoid, and tapered [17]. With the continuous development and innovation of technology, the dental arch shape can be analyzed and classified more accurately by computed tomography scanning and computerized three-dimensional (3D) simulation technology [18]. Some research classifies the dental arch by the characteristics of the lingual side, which might be more practical for clinical choice of lingual super-elastic wires [19].
At present, there are many studies on the digital model of dental arch morphology, mostly to determine the tapered, square, and ovoid shapes from the width and length of the dental arch, and many scholars have explored the mathematical description method of dental arch morphology [20–23]. BeGole used the cubic spline function to fit the maxillary dental arch of permanent dentition and proved that this equation can better describe the shape of maxillary dental arch with normal occlusion [24, 25]. Another study showed that the beta function is an accurate representation of the dental arch; the average correlation coefficient of the curve fit of the mandibular arch is 0.98 and that of the maxillary arch is 0.97 [26]. A lateral polynomial function combines a parabolic or hyperbolic cosine function for the anterior arch area to fit a mathematical curve for the crowded mixed dentition posterior arch [27].
The 3D finite element analysis (FEA) is an effective method for predicting tooth displacement and stress distribution. It represents a numeric form of analysis based on the discretization of a model into a number of simpler elements (tetrahedrons and nodes), which are widely used in the field of oral biology [28]. However, to the best of our knowledge, no study has described the stress distribution and displacement trends induced by sagittal recurrence forces. In addition, evidence to describe correlations between the different dental arches and treatment retention is scarce.
Therefore, the aim of the present study was to evaluate the displacement and stress of each tooth as well as the total displacement and stress by calculating the fourth-order polynomial function and FEA. The more concentrated the stress in the dental arch, the greater the tendency of the tooth to move and, consequently, the greater the chance of recurrence. By comparing the recurrence trends of the three types of arches, we can guide our clinical treatment plan by selecting the most stable arch as the target of orthodontic correction.
Methods
Establishment of the maxillary model
A healthy adult patient after orthodontic treatment was selected as the subject of this study. The selection criteria were as follows: permanent and full dentition; completed alignment and leveling; normal tooth morphology and symmetric arch; without dental caries, periodontal disease, or tooth loss; without maxillofacial surgery systemic disease. Cone-beam computed tomography was used to obtain the patient’s maxillary scanning image, which was stored in the standard digital imaging and communications in medicine (DICOM) format and then imported into Mimics 20.0 software (Materialise, Leuven, Belgium). The mandible and soft tissues were removed by threshold segmentation using the command of ERASE. The model was imported into reverse computer-aided design software (Geomagic Studio 2014; 3D System Inc., Rock Hill, SC, USA) to generate a preliminary 3D model containing the maxilla and maxillary dentition and transformed into a surface model by the command of Calculate 3D. After smoothing, a smooth surface model of maxilla and maxillary dentition was obtained. To form a periodontal ligament structure with a uniform thickness of 0.2 mm, the whole dentition was expanded outward 0.2 mm evenly. The offset command was used to move the alveolar bone inward by 1.5 mm and retain the original alveolar bone. Then, the subtract operation was used to obtain a cortical bone with a thickness of 1.5 mm, and the inside was considered to be cancellous bone [28–30].
Generation of the 3D finite element model
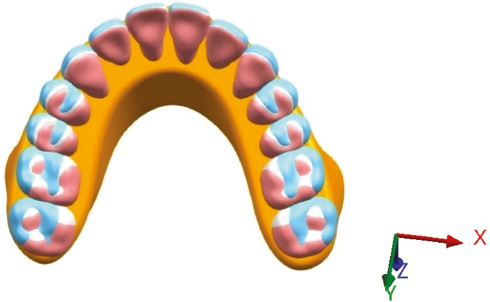
Scholars have collected the full dentition data of the normal population and matched the best-fitting curve of the dentition model to the superimposed clear templates (OrthoForm; 3M Unitek, Monrovia, CA, USA), dividing it into three types of dental arches: tapered, ovoid, and square. There are significant statistical differences in intercanine width and depth and intermolar width; hence, the mean value of each measured distance is considered to be representative of different dental arch shapes [21]. The width and depth of each dental arch shape are presented in Table 1. The contact point between the central incisors is set as the 0 coordinate, the width is the x axis, and the depth is the y axis. The fourth-order polynomial function (f(x) = ax4 + bx3 + cx2 + dx + e) can predict the ideal personalized dental arch and provide a more natural smooth curve, which was therefore selected to depict the curve surrounded by the most prominent points of each labial surface in the maxillary dentition [23, 24, 31, 32]. The width and depth values were brought into the fourth-order polynomial function and then combined with the constructed symmetrical maxilla. Maxillary dentition, periodontal ligament, alveolar bone, cortical bone, and cancellous bone were imported into Ansys Workbench version 18.2 (ANSYS, Canonsburg, PA, USA) to generate 3D finite element models of tapered, ovoid, and square arches and the model fixed in the upper portion (Figure 1). A tetrahedral mesh was used to divide the cortical bone, cancellous bone, dentitions, and ligament and to improve the quality of the grid, thereby increasing the accuracy of the data. The square model had 398,098 nodes and 223,751 elements, the ovoid model had 401,800 nodes and 226,177 units, and the tapered model had 404,434 nodes and 227,430 elements.
Table 1 Width and Depth in Each Arch
| Measurement (mm) | Tapered | Ovoid | Square |
|---|---|---|---|
| Intercanine width | 37.21 | 37.89 | 38.68 |
| Intercanine depth | 9.02 | 8.45 | 8.36 |
| Intermolar width | 56.59 | 57.49 | 59.85 |
| Intermolar depth | 30.17 | 29.28 | 29.90 |
Figure 1 Three-dimensional finite element models with different arches were overlaid on the occlusal view. The blue, white, and pink arches represent the square, ovoid, and tapered dental arches, respectively.
Material biomechanical parameters and mechanical loading
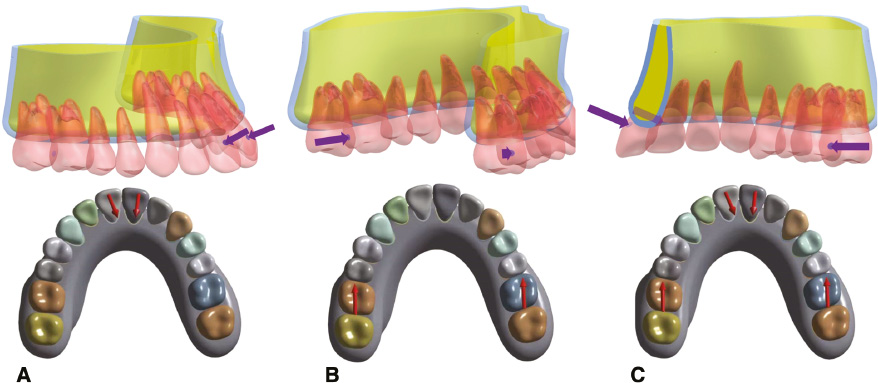
In this study, all materials were assumed to be homogeneous, isotropic, and linearly elastic; the adjacent surface contact area between the teeth was set to 0.1–0.2 mm2 [33–35]. The parameters of the materials are presented in Table 2 [36, 37]. There were bonded relationships between the teeth and the ligament and between the ligament and the bone. The ways of loading were considered, and the first is the lingual force (LF), the second is the mesial force (MF), and the third is the combination of the two forces (CF), which loads to square, ovoid, and tapered arches, respectively. Three forces were used: 1 N LF was loaded to the center of the labial crowns of the maxillary incisors; 1 N MF was loaded to the center of the distal crowns of the maxillary first molars; CF was loaded simultaneously. Although 1 N is very low, the oral growing force or the force due to false use of retainer is low and difficult to measure. Hence 1 N representative to contrast on different arches even though it is small. Each method of loading was applied to the three arch shapes; hence, there were nine loading scenarios (Figure 2).
Table 2 Material Properties
| Material | Young’s Modulus (GPa) | Poisson Ratio |
|---|---|---|
| Tooth | 19,600 | 0.30 |
| Periodontal ligament | 0.667 | 0.45 |
| Cortical bone | 13,700 | 0.26 |
| Cancellous bone | 1370 | 0.30 |
Figure 2 Model with application of relapsed loads: (A) 1 N lingual force (LF) loaded to the center of the labial crowns of the maxillary incisors; (B) 1 N mesial force (MF) loaded to the center of the distal crowns of the maxillary first molars; (C) combined forces (CF) loaded simultaneously.
Evaluation indices
The displacement and von Mises stress of each tooth were expressed in the x, y, and z axes, which were the directions of the horizontal, sagittal, and vertical movements, respectively. The positive values of the x, y, and z axes represent the left, backward, and upward movements, respectively. Since the dental arch models were symmetrical and the loading forces were simultaneously applied to both sides, the right and left side dental arches are theoretically regarded as symmetrical structures with exactly the same force value and opposite direction. In order to simplify the calculation of the right maxillary dentition was selected for analysis according to the visualization FEA results.
Results
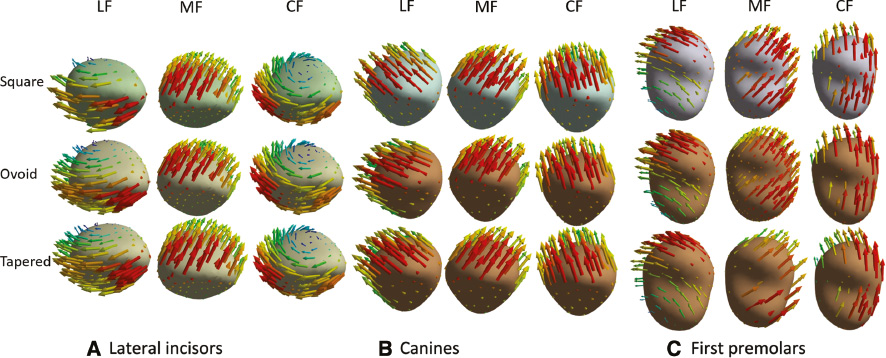
After analyzing the models, the amount of displacement and von Mises stress were calculated for each maxillary tooth in nine scenarios. When 1 N LF, MF, and CF were applied to the three dental arches were applied, the peak values of the total displacement of dentition were the highest in the square arch, followed by the ovoid arch, and the lowest in the tapered arch: 0.09667, 0.09444, 0.08481, 0.03411, 0.03057, 0.02999, 0.07574, 0.07506, and 0.06948 mm, respectively (Figures 3 and 4, Table 3). The crown of the lateral incisor had distal inclination and distobuccal rotation with application of LF, and the tapered arch had the most obvious rotation trends. Application of MF led to mesiobuccal inclination of the crown of the first premolar. When CF was applied, the lateral incisor crown had distal inclination and a more obvious distobuccal rotation, and the crown of the first premolar rotation had distal inclination and distobuccal rotation. Among these scenarios, the teeth of the tapered arch had the most obvious rotation trends, as shown in Figure 5. The arrows represent the tendency and direction of displacement, and different colors represent different displacement trends: red arrows represent the relative maximum displacement, and yellow, green, blue, and purple arrows represent the relative minimum displacements.
Table 3 Displacements Under Each Force
| 16 | 15 | 14 | 13 | 12 | 11 | Total | |
|---|---|---|---|---|---|---|---|
| A1 | 0.01541 | 0.01716 | 0.02609 | 0.03210 | 0.04003 | 0.09316 | 0.09667 |
| B1 | 0.01465 | 0.01663 | 0.02606 | 0.03177 | 0.03869 | 0.09221 | 0.09444 |
| C1 | 0.01120 | 0.01334 | 0.02420 | 0.03156 | 0.03807 | 0.08306 | 0.08481 |
| A2 | 0.03197 | 0.03411 | 0.02897 | 0.02766 | 0.02353 | 0.01896 | 0.03411 |
| B2 | 0.02958 | 0.03057 | 0.02845 | 0.02646 | 0.02217 | 0.01818 | 0.03057 |
| C2 | 0.02959 | 0.02999 | 0.02591 | 0.02433 | 0.02110 | 0.01856 | 0.02999 |
| A3 | 0.02449 | 0.02917 | 0.03700 | 0.04332 | 0.03720 | 0.07291 | 0.07574 |
| B3 | 0.02196 | 0.02671 | 0.03606 | 0.04218 | 0.03668 | 0.07324 | 0.07506 |
| C3 | 0.02283 | 0.02420 | 0.03201 | 0.04000 | 0.03504 | 0.06781 | 0.06948 |
Figure 3 Total displacement with lingual force (LF), mesial force (MF), and combined forces (CF) in the three dental arches.
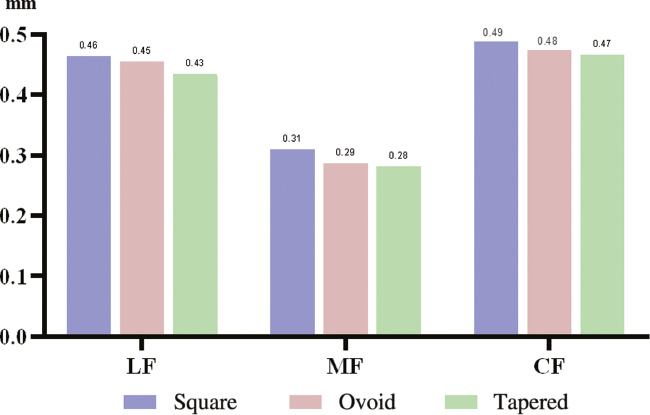
Figure 4 Displacement for each tooth with (A) lingual force (LF), (B) mesial force (MF), and (C) combined forces (CF) in the three dental arches.
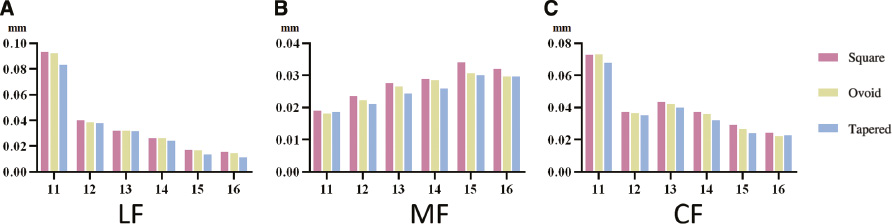
Figure 5 Displacement trends of the right maxillary (A) lateral incisors, (B) canines, and (C) first premolars with lingual force (LF), mesial force (MF), and combined forces (CF) applied in different arches (occlusal view).
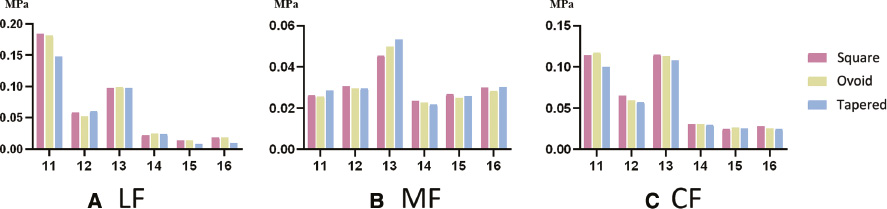
The maximum von Mises stress of different arches showed similar sequences. When LF was applied, the central incisors had the highest stress (0.183976691, 0.181922143, and 0.150524914 MPa, respectively), followed by the canines, lateral incisors, first premolars, second premolars, and first molars. When the MF was applied, the canines had the highest stress (0.04922527157, 0.04626197966, and 0.04231465346, respectively); meanwhile, the other teeth vary slightly. The central incisors and canines had highest stress with CF application (central incisors: 0.11671358, 0.120290491, and 0.102934085 MPa, respectively; canines: 0.109576242, 0.107547501, and 0.103179219 MPa, respectively), followed by the lateral incisors, premolars, and first molars. The square arch had the highest stress, then the ovoid arch, followed by the tapered arch, regardless of the force loaded (Figure 6).
Figure 6 von Mises stress of each tooth with (A) lingual force-LF, (B) mesial force-MF, and (C) combined forces-CF in three dental arches. 11–16 represent for central incisor, lateral incisor, canine, first premolar, second premolar and first molar in right maxillary (FDI).
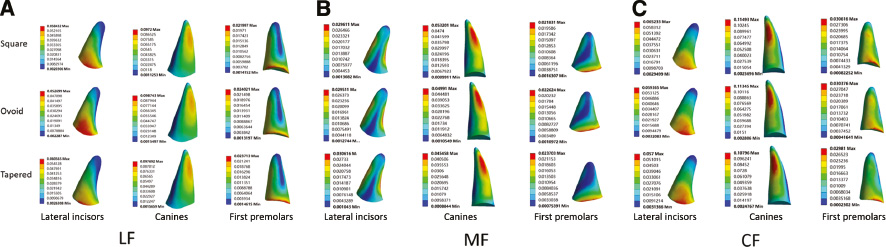
The maximum von Mises stress distribution of the right maxillary tooth in different arches showed the concentration areas in the lateral incisors, canines, and premolars. When LF was applied on the arches, the stress was concentrated on the palatal neck region of the lateral incisors, the distal root middle and apical regions of the canines, and the labial neck region of the first premolars, while the stress of the second premolars and first molars was extremely low. When the MF was applied on the arches, the stress was concentrated on the labial root middle and apical regions of the central incisors, the distal root middle and apical regions of the lateral incisors, the labial and middle apical regions of the canines, the mesial root middle of the first premolars, and on the distal and lingual root middle regions of the second premolars. When two types of forces were applied simultaneously (CF), the stress was concentrated on the palatal root middle region of the lateral incisors, the distal root middle and apical regions of the canines, the labial root middle region of the first premolars, and the mesial and lingual root middle regions of the second premolars (Figure 7). The colormap of stress shows that the maximum von Mises stress distribution of the maxillary teeth was more lightly and comparatively centralized in the tapered arch, followed by ovoid; the square one being the most sporadic.
Figure 7 Maximum von Mises stress distribution in the right maxillary tooth in different arches: (A) lateral incisors (palatal surface), canines (distal surface), and first premolars (buccal surface) with lingual force (LF); (B) lateral incisors (palatal surface), canines (labial surface), and first premolars (mesial surface) with mesial force (MF); (C) lateral incisors (palatal surface), canines (labial surface), and first premolars (buccal surface) with combined forces (CF).
Discussion
This study generated finite element models of square, ovoid, and tapered dental arches and calculated the displacement trends and von Mises stress in the three different arches induced by three types of horizontal recurrent forces.
Usually, orthodontists divide dental arches into three types: square, ovoid, and tapered [17]. Over the years, there have been many studies and debates on the classification of dental arches. Traditional classification has provided some guidelines for clinical use; however, there is no mathematically standardized definition. Scholars have done much research on the mathematical description method of arch shape. Cubic spline function can describe the ideal maxillary dental arch shape but causes a certain deviation point away from the arch, and there is no guarantee of arch symmetry [24, 25]. Beta function can better use the mandibular arch shape to predict the maxillary arch shape, but its application is merely based on the depth of the dental arch and the width of the molar; this does not take other measurement marks of the dental arch into account, nor can it consider the possible arch asymmetry [23, 26]. Some scholars used polynomial functions, polynomial functions combined with parabolic equations, hyperbolic cosine functions, and other functions to fit the mathematical curve of the arch. This could more accurately reflect the changes of the curvature of the anterior and posterior dental arches, but the complex calculation method is more difficult, and there are possible errors in its application [27, 31]. The single use of polynomial functions, especially fourth-order polynomial functions, is not only closer to the clinical measured value than other functions in terms of data values, but also covers asymmetric dental arch shapes [22]. Therefore, this study applied the fourth-order polynomial function, which can most accurately represent the arch form and produce smooth curves without wave properties, to describe the mathematical characteristics of the three different arches. With the width and depth of the dental arch, the finite element model with new dental arch shapes was established. These models include the three dental shapes, periodontal ligament thickness, alveolar bone shape and density, etc., which have a high concordance except for the arch shape. In previous studies, the comparison of dental arch shapes was mostly observed in people who did not undergo orthodontic treatment, and there was little research on the relationship between dental arch shape and the biomechanical effects of orthodontic relapse [31, 38, 39]. The finite element models of the three different arches had configuration characteristics and biomechanical material properties of the teeth and alveolar bones that can be used to simulate force scenarios.
Orthodontic relapse is a significant challenge for clinicians, and the teeth and dental arches have the potential to return to their pretreatment state, especially the widths between the lateral incisors, canines, and first premolars [40, 41]. Among the common causes of relapse, the periodontal ligament and gingiva, pressure and limitation of oral soft tissue, growth and development, and third molar eruption are closely related to variation in dental arch shape [4–7]. Hawley retainers are frequently used in clinic. If used in the wrong condition (such as labial wire deformation), the crown of the anterior teeth is often subjected to LF. This could cause incisor lingual inclination, labial tipping of the canine teeth, and unevenness in the first and the second premolars [15]. This result is similar to the scenario in which LF was applied in the study. The growth and development and eruption of the third molar make the dentition protracted, and some common manifestations of which are the following: crowded and uneven anterior teeth; labial tipping of the incisors; tendency of the canines towards labial tipping and intrusion; tendency of the premolars towards labial or lingual tipping; the molars have mesial movement or extension, even causing open bite [5]. These displacement trends of the MF groups correspond to the clinical situation. As for the CF applied, i.e., two factors are applied simultaneously, the consequences are largely the same as the before scenarios. In practice, factors that affect the deformation of dentition are more complicated.
In any of the arch FE models, the displacement of the canines is relatively small, but they bear a high amount of stress. This is closely related to the anatomy of a strong root and large periodontal membrane area, which not only provides a large cushion for adjacent teeth but also plays an important role in maintaining the dentition stability [36].
The von Mises stress of a tooth is a comprehensive stress that reflects a certain point inside the tooth and is the key in the analysis of tooth movement and alveolar bone reconstruction. Therefore, the von Mises stress can be analyzed to study the stress distribution of the teeth. In the case of LF and CF application, the von Mises stress and displacement trends of most teeth in the tapered arch had the lowest value, followed by the ovoid arch, and the square arch had the highest value. The weakened areas of each tooth are represented by stress distribution; meanwhile, tooth movement is estimated by the displacement trends according to the analysis. Therefore, the dental arch after orthodontic treatment is considered to be most stable in the tapered form, and the square arch is the most unstable.
The width of the posterior teeth of the tapered arch is narrow, and the width of the buccal corridor is large. Orthodontists must take these aesthetic issues into account before formulating treatment or after treatment. The buccal corridor plays an important role in treatment outcome and affects the attractiveness of smiles for people of different genders and facial shapes [1, 42, 43]. After treatment, there is a certain increase in the width of the dental arch compared with before. The width of the dental arch, especially the width between the posterior teeth, can affect the existence of the buccal corridor; meanwhile, in clinics, commercial archwire is mainly available in ovoid form, and orthodontists tend to correct the patient’s arch to a normal or larger shape [44, 45]. Orthodontic treatment can increase the width of the maxillary and mandible dental arch by a small amount and obtain a good occlusal effect. However, in the 22-year follow-up study of Valladares-Neto et al., the transversal width of the dental arch gradually decreases, except to permanently retain the mandibular canine width, and this change is considered to be a superimposed effect of arcuate contraction and orthodontic relapse caused by natural aging [13]. In the normal population, some scholars reported that class III patients are more prone to square arches, whereas class II patients are more prone to tapered arches; in addition, class III patients have much higher predictability in arch form than class I patients [39, 40]. In some populations, such as Iranians, generally healthy people are most commonly seen with a tapered dental arch [39, 46]. Bourzgui et al. believe that allowing orthodontic patients to maintain the original width of the dental arch from the beginning to the end of the treatment can better achieve good arch stability, occlusal function, and aesthetic results [47]. For those who have not undergone orthodontic treatment, some scholars believe that the dental arch has a tendency to gradually widen and round during the period of growth from teenager to adult; other scholars disagree, believing that the shape of the dental arch remains stable with age and that the original arch shape should be maintained after orthodontic treatment [38]. In this study, the tapered dental arch has the lowest stress and displacement trend, which indicates best stability [48, 49]. However, considering the aesthetic effect, it is necessary to balance the relationship between aesthetics and stability in order to formulate an accurate plan.
There is a connection between the soft and hard tissues inside and outside the oral cavity. The abnormal movement mode affects the normal development of the teeth and alveolar bone, and an abnormal hard tissue position causes changes to the soft tissue posture position. Lingual movement and growth also have significant effects on the dental arch. The tongue exerts continuous pressure on the hard palate during rest; the pressure on the hard palate increases more significantly when swallowing, and the greater the width of the dental arch is, the greater the reducibility of the swallowing pressure [50]. Changes in perioral muscle function, especially the tongue muscles, endanger the long-term stability of orthodontics and are likely to cause relapse, as observed during myoelectric activity of swallowing in patients with class II/1 malformation [51]. In this study, which excluded the effects of the lips and tongue, the tapered arch performed better on the stability of the transversal forces.
However, we acknowledge the limitations of this study. The relationship between the stability of the narrow dental arch and tongue movement still needs further investigation. The transmission of force between the teeth needs to pass through the interdental contact surface between adjacent teeth. Different races, ages, genders, and periodontal conditions can affect the contact area position and size and even the degree of close contact. These models were strictly symmetrical, despite normal dentition being highly, albeit not absolutely, symmetrical in reality, and thus, there will be some unavoidable small deviation. Hence, the actual transmission effect of the force in the dental arch is complicated and needs to be further demonstrated in future clinical research.
Conclusion
Based on the study of the fourth-order polynomial function of different dental arches, combined with the finite element method, the representative 3D models of square, ovoid, and tapered arch shapes can be established effectively. By introducing precise calculation methods of different arch shapes into the FEA method, it provides a new method for studying the biomechanics of the FEA method in dental arch as well as guidance for clinical work.
In this study, the tapered arch had the least displacement trend and the most stable stress, whereas the square arch was the most unstable. It is suggested that, in clinical practice, on the premise of satisfying the occlusal function and aesthetic appearance, orthodontist could choose the most stable arch shape, namely the sharp round shape, to better maintain the effect after orthodontic treatment.
Acknowledgment
This work was supported by a grant from the Guangdong Science and Technology Program Project (A002014004).
Conflict of interest
The authors declare that they have no conflict of interest.
References
- Graber LW, Vanarsdall RL Jr, Vig KWL. Orthodontics: current principles and techniques. 5th ed. Amsterdam: Elsevier; 2011. pp. 991-1019.
- Sadowsky C, Sakols EI. Long-term assessment of orthodontic relapse. Am J Orthod 1982;82(6):456-63. [PMID: 6961816 DOI: 10.1016/0002-9416(82)90312-8]
- Andriekute A, Vasiliauskas A, Sidlauskas A. A survey of protocols and trends in orthodontic retention. Progress Orthod 2017;18(1):31. [PMID: 28990138 DOI: 10.1186/s40510-017-0185-x]
- Littlewood SJ, Kandasamy S, Huang G. Retention and relapse in clinical practice. Aust Dent J 2017;62(Suppl 1):51-7. [PMID: 28297088 DOI: 10.1111/adj.12475]
- Cheng H-C, Peng B-Y, Hsieh H-Y, Tam K-W. Impact of third molars on mandibular relapse in post-orthodontic patients: a meta-analysis. J Dent Sci 2018;13(1):1-7. [PMID: 30895087 DOI: 10.1016/j.jds.2017.10.005]
- Yu Y, Sun J, Lai W, Wu T, Koshy S, et al. Interventions for managing relapse of the lower front teeth after orthodontic treatment. Cochrane Database Syst Rev 2013(9):CD008734. [PMID: 24014170 DOI: 10.1002/14651858.CD008734.pub2]
- Rongo R, D’Antò V, Bucci R, Polito I, Martina R, et al. Skeletal and dental effects of Class III orthopaedic treatment: a systematic review and meta-analysis. J Oral Rehabil 2017;44(7):545-62. [PMID: 28214379 DOI: 10.1111/joor.12495]
- Andrews LF. The six keys to normal occlusion. Am J Orthod 1972;62(3):296-309. [PMID: 4505873 DOI: 10.1016/s0002-9416(72)90268-0]
- Kageyama T, Domínguez-Rodríguez GC, Vigorito JW, Deguchi T. A morphological study of the relationship between arch dimensions and craniofacial structures in adolescents with Class II Division 1 malocclusions and various facial types. Am J Orthod Dentofacial Orthop 2006;129(3):368-75. [PMID: 16527632 DOI: 10.1016/j.ajodo.2005.12.005]
- Paranhos LR, Zaroni M, Carli JPd, Okamoto R, Zogheib LV, et al. Association between the facial type and morphology of the upper central incisor in normal occlusion subjects. J Contemp Dent Pract 2014;15(1):29-33. [PMID: 24939261 DOI: 10.5005/jp-journals-10024-1183]
- Zigante M, Pavlic A, Vandevska Radunovic V, Mathewson A, Kotarac Knezevic A, et al. Changes of mandibular dental arch shape during adolescence and its influence on late mandibular incisor crowding. Homo 2019;70(3):185-92. [PMID: 31486821 DOI: 10.1127/homo/2019/1070]
- Trefný P, Tauferová E, Bálková S. Three-dimensional visualisation and analysis of post-operative changes in the size and shape of the dental arch and palate. Acta Chirurg Plast 2005;47(4):124-8. [PMID: 16265949]
- Valladares-Neto J, Evangelista K, Miranda de Torres H, Melo Pithon M, Alves Garcia Santos Silva M. A 22-year follow-up of the nonsurgical expansion of maxillary and mandibular arches in a young adult: are the outcomes stable, relapsed, or unstable with aging? Am J Orthod Dentofacial Orthop 2016;150(3):521-32. [PMID: 27585782 DOI: 10.1016/j.ajodo.2015.10.030]
- Heiser W, Niederwanger A, Bancher B, Bittermann G, Neunteufel N, et al. Three-dimensional dental arch and palatal form changes after extraction and nonextraction treatment. Part 1. Arch length and area. Am J Orthod Dentofacial Orthop 2004;126(1):71-81. [PMID: 15224062 DOI: 10.1016/j.ajodo.2003.05.015]
- Outhaisavanh S, Liu Y, Song J. The origin and evolution of the Hawley retainer for the effectiveness to maintain tooth position after fixed orthodontic treatment compare to vacuum-formed retainer: a systematic review of RCTs. Int Orthod 2020;18(2):225-36. [PMID: 32201168 DOI: 10.1016/j.ortho.2020.02.008]
- Przygoński A, Arkuszewski P. Evaluation of tongue pressure on the inferior dental arch in patients with mandibular prognathism. Ann Acad Med Stetin 2006;52(Suppl 3):131-3. [PMID: 17937026]
- Mclaughlin R. Systemized orthodontic treatment mechanics. Maryland Heights, MO: Mosby; 2001. pp. 71-91.
- Lee K-J, Trang VTT, Bayome M, Park JH, Kim Y, et al. Comparison of mandibular arch forms of Korean and Vietnamese patients by using facial axis points on three-dimensional models. Korean J Orthod 2013;43(6):288-93. [PMID: 24396738 DOI: 10.4041/kjod.2013.43.6.288]
- Park KH, Bayome M, Park JH, Lee JW, Baek S-H, et al. New classification of lingual arch form in normal occlusion using three dimensional virtual models. Korean J Orthod 2015;45(2):74-81. [PMID: 25798413 DOI: 10.4041/kjod.2015.45.2.74]
- Sghaireen MG, Albhiran HM, Alzoubi IA, Lynch E, Al-Omiri MK. Intraoral versus extraoral measurement of the height of the interproximal contact area in maxillary anterior teeth. Med Princ Pract 2015;24(2):136-41. [PMID: 25573146 DOI: 10.1159/000369903]
- Kim B-I, Bayome M, Kim Y, Baek S-H, Han SH, et al. Comparison of overjet among 3 arch types in normal occlusion. Am J Orthod Dentofacial Orthop 2011;139(3):e253-60. [PMID: 21392669 DOI: 10.1016/j.ajodo.2010.11.004]
- AlHarbi S, Alkofide EA, AlMadi A. Mathematical analyses of dental arch curvature in normal occlusion. Angle Orthod 2008;78(2):281-7. [PMID: 18251619 DOI: 10.2319/121806-516.1]
- Mina M, Borzabadi-Farahani A, Tehranchi A, Nouri M, Younessian F. Mathematical beta function formulation for maxillary arch form prediction in normal occlusion population. Odontology 2017;105(2):229-36. [PMID: 27167385 DOI: 10.1007/s10266-016-0244-7]
- BeGole EA. Application of the cubic spline function in the description of dental arch form. J Dent Res 1980;59(9):1549-56. [PMID: 6931142 DOI: 10.1177/00220345800590092901]
- BeGole EA, Lyew RC. A new method for analyzing change in dental arch form. Am J Orthod Dentofacial Orthop 1998;113(4):394-401. [PMID: 9563354]
- Braun S, Hnat WP, Fender DE, Legan HL. The form of the human dental arch. Angle Orthod 1998;68(1):29-36. [PMID: 9503132 DOI: 10.1043/0003-3219(1998)068[[0029:TFOTHD]]2.3.CO;2]
- Wellens H. Applicability of mathematical curve-fitting procedures to late mixed dentition patients with crowding: a clinical-experimental evaluation. Am J Orthod Dentofacial Orthop 2007;131(2):160.e17-e25. [PMID: 17276854 DOI: 10.1016/j.ajodo.2006.06.015]
- Singh JR, Kambalyal P, Jain M, Khandelwal P. Revolution in orthodontics: finite element analysis. J Int Soc Prev Commun Dent 2016;6(2):110-4. [PMID: 27114948 DOI: 10.4103/2231-0762.178743]
- Feng Y, Kong WD, Cen WJ, Zhou XZ, Zhang W, et al. Finite element analysis of the effect of power arm locations on tooth movement in extraction space closure with miniscrew anchorage in customized lingual orthodontic treatment. Am J Orthod Dentofacial Orthop 2019;156(2):210-9. [PMID: 31375231 DOI: 10.1016/j.ajodo.2018.08.025]
- Lu Y-j, Chang S-h, Ye J-t, Ye Y-s, Yu Y-s. Finite element analysis of bone stress around micro-implants of different diameters and lengths with application of a single or composite torque force. PLoS One 2015;10(12):e0144744. [PMID: 26659581 DOI: 10.1371/journal.pone.0144744]
- Ferrario VF, Sforza C, Miani A, Tartaglia G. Mathematical definition of the shape of dental arches in human permanent healthy dentitions. Eur J Orthod 1994;16(4):287-94. [PMID: 7957653 DOI: 10.1093/ejo/16.4.287]
- Jaklová L, Borský J, Jurovčík M, Hoffmannová E, Černý M, et al. Three-dimensional development of the palate in bilateral orofacial cleft newborns 1 year after early neonatal cheiloplasty: classic and geometric morphometric evaluation. J Craniomaxillofac Surg 2020;48(4):383-90. [PMID: 32184075 DOI: 10.1016/j.jcms.2020.02.019]
- Sghaireen MG, Al-Zarea BK, Al-Shorman HM, Al-Omiri MK. Clinical measurement of the height of the interproximal contact area in maxillary anterior teeth. Int J Health Sci (Qassim) 2013;7(3):325-30. [PMID: 24533026 DOI: 10.12816/0006061]
- Shimomura N, Tanaka R, Shibata Y, Zhang Z, Li Q, et al. Exceptional contact elasticity of human enamel in nanoindentation test. Dent Mater 2019;35(1):87-97. [PMID: 30502962 DOI: 10.1016/j.dental.2018.11.005]
- Sarig R, Vardimon AD, Sussan C, Benny L, Sarne O, et al. Pattern of maxillary and mandibular proximal enamel thickness at the contact area of the permanent dentition from first molar to first molar. Am J Orthod Dentofacial Orthop 2015;147(4):435-44. [PMID: 25836003 DOI: 10.1016/j.ajodo.2014.11.026]
- Thresher RW, Saito GE. The stress analysis of human teeth. J Biomech 1973;6(5):443-9. [PMID: 4748494 DOI: 10.1016/0021-9290(73)90003-1]
- Tominaga J-Y, Tanaka M, Koga Y, Gonzales C, Kobayashi M, et al. Optimal loading conditions for controlled movement of anterior teeth in sliding mechanics. Angle Orthod 2009;79(6):1102-7. [PMID: 19852600 DOI: 10.2319/111608-587R.1]
- Henrikson J, Persson M, Thilander B. Long-term stability of dental arch form in normal occlusion from 13 to 31 years of age. Eur J Orthod 2001;23(1):51-61. [PMID: 11296510 DOI: 10.1093/ejo/23.1.51]
- Hedayati Z, Fakhri F, Moshkel Gosha V. Comparison of commercially available arch wires with normal dental arch in a group of Iranian population. J Dent (Shiraz) 2015;16(2):106-12. [PMID: 26046106]
- de la Cruz A, Sampson P, Little RM, Artun J, Shapiro PA. Long-term changes in arch form after orthodontic treatment and retention. Am J Orthod Dentofacial Orthop 1995;107(5):518-30. [PMID: 7733061 DOI: 10.1016/s0889-5406(95)70119-2]
- Taner TU, Ciger S, El H, Germec D, Es A. Evaluation of dental arch width and form changes after orthodontic treatment and retention with a new computerized method. Am J Orthod Dentofacial Orthop 2004;126(4):464-75; discussion 75-6. [PMID: 15470349 DOI: 10.1016/j.ajodo.2003.08.033]
- Moore T, Southard KA, Casko JS, Qian F, Southard TE. Buccal corridors and smile esthetics. Am J Orthod Dentofacial Orthop 2005;127(2):208-13; quiz 61. [PMID: 15750540 DOI: 10.1016/j.ajodo.2003.11.027]
- Parrini S, Rossini G, Castroflorio T, Fortini A, Deregibus A, et al. Laypeople’s perceptions of frontal smile esthetics: a systematic review. Am J Orthod Dentofacial Orthop 2016;150(5):740-50. [PMID: 27871700 DOI: 10.1016/j.ajodo.2016.06.022]
- Shook C, Kim SM, Burnheimer J. Maxillary arch width and buccal corridor changes with Damon and conventional brackets: a retrospective analysis. Angle Orthod 2016;86(4):655-60. [PMID: 26390140 DOI: 10.2319/050515-304.1]
- Roden-Johnson D, Gallerano R, English J. The effects of buccal corridor spaces and arch form on smile esthetics. Am J Orthod Dentofacial Orthop 2005;127(3):343-50. [PMID: 15775949 DOI: 10.1016/j.ajodo.2004.02.013]
- Slaj M, Spalj S, Jelusic D, Slaj M. Discriminant factor analysis of dental arch dimensions with 3-dimensional virtual models. Am J Orthod Dentofacial Orthop 2011;140(5):680-7. [PMID: 22051488 DOI: 10.1016/j.ajodo.2010.12.022]
- Bourzgui F, Khribchi A, Rachdy Z, Housbane S, Othmani MB. Evaluation of arch forms depending on the angle classification. Int Orthod 2016;14(4):528-36. [PMID: 27867068 DOI: 10.1016/j.ortho.2016.10.017]
- Melsen B. Tissue reaction to orthodontic tooth movement—a new paradigm. Eur J Orthod 2001;23(6):671-81. [PMID: 11890063 DOI: 10.1093/ejo/23.6.671]
- Cattaneo PM, Dalstra M, Melsen B. The finite element method: a tool to study orthodontic tooth movement. J Dent Res 2005;84(5):428-33. [PMID: 15840778 DOI: 10.1177/154405910508400506]
- Yu M, Gao X. Tongue pressure distribution of individual normal occlusions and exploration of related factors. J Oral Rehabil 2019;46(3):249-56. [PMID: 30375017 DOI: 10.1111/joor.12741]
- de Souza DR, Semechini TA, Kröll LB, Berzin F. Oral myofunctional and electromyographic evaluation of the anterior suprahyoid muscles and tongue thrust in patients with Class II/1 malocclusion submitted to first premolar extraction. J Appl Oral Sci 2007;15(1):24-8. [PMID: 19089095 DOI: 10.1590/s1678-77572007000100006]