


Cell Death Analysis: A Comprehensive R Package for Multi-pathway Cell Death Analysis in Transcriptomic Data
1Department of Gastroenterology, Fourth Hospital of Hebei Medical University, Shijiazhuang, Hebei, China
2Hebei Medical University Clinical Medicine Postdoctoral Research Station, Hebei Medical University, Shijiazhuang, PR China
3Department of Immunology, Key Laboratory of Immune Mechanism and Intervention on Serious Disease in Hebei Province, Hebei Medical University, Shijiazhuang, PR China
4Department of Pathology, Shijiazhuang People’s Hospital, Shijiazhuang, PR China
5Beijing Chaoyang Hospital, Capital Medical University, Beijing, PR China
6Department of Urology, Peking University People’s Hospital, Beijing 100044, China
7University of Hawaii, Honolulu, HI, USA
aThese authors contributed equally to this study.
*Correspondence to: Jingyuan Ning, Department of Immunology, Key Laboratory of Immune Mechanism and Intervention on Serious Disease in Hebei Province, Hebei Medical University, Shijiazhuang 050000, Hebei, PR China, E-mail: ninglab@163.com; Fei Yin, Department of Gastroenterology, Fourth Hospital of Hebei Medical University, Shijiazhuang 050000, Hebei, PR China, E-mail: 47100214@hebmu.edu.cn
Received: March 17 2026; Revised: May 9 2026; Accepted: June 9 2026; Published Online: July 3 2026
Cite this paper:
Sun K, Jia K, Niu Y. Cell Death Analysis: A Comprehensive R Package for Multi-pathway Cell Death Analysis in Transcriptomic Data. BIO Integration 2026; 7: 1–12.
DOI: 10.15212/bioi-2026-0046. Available at: https://bio-integration.org/
Download citation
© 2026 The Authors. This is an open access article distributed under the terms of the Creative Commons Attribution License (https://creativecommons.org/licenses/by/4.0/). See https://bio-integration.org/copyright-and-permissions/
Abstract
Background: Cell death pathways have crucial roles in cancer development, immune responses, and disease progression. With the discovery of 14 distinct types of regulated cell death, there is a critical need for integrated analytical tools that can simultaneously evaluate multiple cell death pathways in transcriptomic data.
Methods: We developed CellDeathAnalysis (v0.4.0), an R package providing a unified framework for analyzing 14 cell death pathways in bulk RNA-seq data. The package introduces two novel algorithms: Crosstalk-Aware Pathway Scoring, which uses gene specificity weighting (inverse document frequency-inspired) and residual debiasing to reduce redundancy from inter-pathway gene overlap; and Cell Death Subtype Classification, which uses consensus clustering on pathway score profiles to identify biologically meaningful patient subtypes. The package integrates curated gene sets from FerrDb, MSigDB, KEGG, and the primary literature, and implements multiple scoring methods (z-score, ssGSEA, GSVA, and AUCell, and the novel crosstalk-aware method), survival analysis, enrichment analysis, and publication-ready visualizations.
Results: By applying CellDeathAnalysis to 2704 The Cancer Genome Atlas (TCGA) samples across four cancer types (BRCA, LUAD, LIHC, and STAD), the crosstalk-aware method reduced inter-pathway correlation (mean reduction = 0.69) compared to z-score scoring. The disulfidptosis score in LUAD exhibited a significant survival association (HR = 2.19, P_adj = 0.037). Consensus clustering identified clinically meaningful subtypes in LIHC (P = 0.017) and STAD (P = 0.028).
Conclusions: CellDeathAnalysis provides the first dedicated toolkit for multi-pathway cell death analysis with novel crosstalk-aware scoring and subtype classification capabilities. The package addresses the critical challenge of gene overlap between cell death pathways and enables discovery of clinically meaningful patient subtypes.
Keywords
Cancer genomics, cell death, consensus clustering, crosstalk-aware, cuproptosis, ferroptosis, pathway scoring, R package, survival analysis, transcriptomics.
Introduction
Programmed cell death is fundamental to development, tissue homeostasis, and disease pathogenesis. While apoptosis has long been recognized as the canonical form of programmed cell death, recent discoveries have revealed a remarkably diverse landscape of regulated cell death mechanisms, including ferroptosis [1], necroptosis [2], pyroptosis [3], cuproptosis [4], disulfidptosis [5], autophagy-dependent death, netosis, parthanatos, entosis, oxeiptosis, alkaliptosis, and lysosome-dependent cell death (LDCD) [6–8]. These 14 distinct cell death pathways represent sophisticated biological programs with profound implications for cancer biology, immune regulation, and therapeutic responses [9–11].
The availability of large-scale transcriptomic datasets, particularly from TCGA and single-cell RNA sequencing studies, provides unprecedented opportunities to investigate cell death pathway activity across cancer types. However, a critical analytical challenge has been largely overlooked; cell death pathways share a substantial number of genes. For example, CASP8 participates in apoptosis, pyroptosis, necroptosis, and PANoptosis, GPX4 is shared between ferroptosis and autophagy, and the BCL2 family functions in both apoptosis and necroptosis. This gene overlap creates redundancy in pathway scores, making it difficult to determine which pathway is truly active in a given sample.
Several R packages exist for gene set enrichment analysis (e.g., clusterProfiler [12] and GSVA [13]) and survival analysis (e.g., survival and survminer). However, these general-purpose tools require users to independently assemble gene sets, configure scoring pipelines, and interpret results within the specific biological context of cell death. No existing tool addresses the fundamental challenge of gene overlap between cell death pathways or provides a dedicated framework for identifying cell death-based patient subtypes.
CellDeathAnalysis is a comprehensive R package specifically designed for analyzing cell death pathways in transcriptomic data. The package provides for the following: (1) curated gene sets for 14 types of regulated cell death; (2) a novel Crosstalk-Aware Pathway Scoring algorithm that reduces redundancy from shared genes using specificity weighting and residual debiasing; (3) a Cell Death Subtype Classification module that identifies clinically meaningful patient subtypes based on pathway activity profiles; (4) multiple scoring methods, including z-score, ssGSEA, GSVA, and AUCell; (5) integrated survival and enrichment analysis; and (6) publication-ready visualizations through both programmatic functions and an interactive Shiny web application.
Methods
Gene set curation
We systematically curated gene sets for 14 distinct cell death pathways through comprehensive literature review and integration of multiple authoritative databases. Gene sets were compiled from FerrDb V3 (ferroptosis) [https://www.zhounan.org/ferrdb/], MSigDB, KEGG, and primary literature. Each gene set was categorized into “core” genes (well-established pathway components) and “extended” genes (regulators and associated factors). Gene symbols follow the HUGO Gene Nomenclature Committee nomenclature. The 14 cell death pathways included are as follows: ferroptosis; cuproptosis; disulfidptosis; pyroptosis; necroptosis; apoptosis; autophagy; PANoptosis; netosis; parthanatos; entosis; oxeiptosis; alkaliptosis; and lysosome-dependent cell death (LDCD). Simplified gene sets containing core genes only were used for pan-cancer analysis (12 pathways; alkaliptosis and LDCD were excluded due to insufficient gene coverage with < 5 core genes each).
Pathway scoring methods
The CellDeathAnalysis framework integrates six distinct pathway scoring algorithms to quantify cell death pathway activity from transcriptomic profiles. First, the Z-score method (default) performs per-sample Z-score normalization of gene expression followed by averaging normalized values across pathway member genes, offering high computational efficiency and robustness to expression outliers. Second, the mean/median expression method calculates pathway activity by simple arithmetic averaging or median aggregation of raw expression levels of pathway genes. Third, single-sample Gene Set Enrichment Analysis (ssGSEA) implemented via the GSVA package generates pathway enrichment scores independent of predefined sample grouping. Fourth, Gene Set Variation Analysis (GSVA) was adopted as a non-parametric and unsupervised approach to estimate the variation in cell death pathway activity across individual samples. Fifth, the AUCell algorithm leverages area under the curve-based gene ranking, which is particularly suitable for pathway activity evaluation in single-cell transcriptomic data.
Of note, we developed a novel Crosstalk-Aware Scoring method to resolve the inherent limitation of conventional scoring strategies in multi-pathway cell death analysis. A major analytical challenge lies in extensive gene overlap among distinct cell death pathways. For example, CASP8 is involved in apoptosis, pyroptosis, necroptosis, and PANoptosis, whereas GPX4 is shared by ferroptosis and autophagy. Traditional independent pathway scoring leads to inflated activity scores and redundant biological signals due to repeated counting of shared genes across multiple pathways. The proposed Crosstalk-Aware Scoring algorithm corrects such cross-pathway interference via two sequential steps. Inspired by the inverse document frequency (IDF) concept from information retrieval, we assigned each gene a specificity weight based on how many pathways it belongs to, as follows:

where N is the total number of pathways and n_g is the number of pathways containing gene, g. Genes unique to a single pathway receive the highest weight (e.g., a gene in 1 pathway: weight = 4.81), while genes shared across many pathways receive lower weights (e.g., GPX4, shared between ferroptosis and autophagy: weight = log2(14/2) + 1 = 3.58; a gene in 8 pathways: weight = 1.81). The pathway score is then calculated as a weighted mean, as follows:

where the sum is over genes in pathway P that are present in the expression data.
After specificity weighting, each pathway score may still correlate with the overall activity of other cell death processes. We removed this confounding by regressing each pathway score on the mean score of all other pathways and using the residual as the final crosstalk-adjusted score, as follows:

This residual represents the pathway-specific signal after removing cross-pathway confounding effects.
Cell death subtype classification
We developed a consensus clustering-based method to classify samples into distinct cell death subtypes based on the pathway activity profiles. The algorithm operates in three steps.
Consensus clustering was performed on the pathway score matrix for each k from 2 to 8 (samples × pathways) using hierarchical clustering with Ward’s linkage and Pearson correlation distance. At each iteration, 80% of samples are randomly subsampled and clustered, and the co-assignment frequency was recorded across 1000 re-samplings. The resulting consensus matrix captures the stability of sample groupings.
The optimal number of clusters is determined using the cumulative distribution function area change method. We computed the area under the empirical cumulative distribution function of consensus matrix values for each k and selected the k where the delta area first dropped below 0.05, which indicated diminishing returns from additional clusters.
Each cluster was named based on the dominant pathway(s). The top two pathways for each subtype were identified by mean score. If the difference between the top two scores exceeded 0.3, the subtype was named after the dominant pathway (e.g., “ferroptosis-dominant”). Otherwise, the subtype was named as a mixed type (e.g., “mixed [PANoptosis + pyroptosis]”). Kruskal-Wallis tests were also performed with the Benjamini-Hochberg FDR correction to identify differentially active pathways between subtypes.
Survival analysis
The survival analysis module implements the following three complementary approaches: Kaplan-Meier analysis with log-rank testing, stratifying samples by pathway score (median split); Cox proportional hazards regression using continuous pathway scores as predictors; and subtype-based survival analysis comparing overall survival across cell death subtypes using log-rank tests with pairwise comparisons. All P-values were adjusted for multiple testing using the Benjamini-Hochberg method. Hazard ratios (HRs) and 95% confidence intervals were reported for Cox regression results.
Software implementation
CellDeathAnalysis v0.4.0 was implemented in R (version ≥ 4.0.0) and followed best practices for R package development. The package is available at https://github.com/keransun/CellDeathAnalysis under the MIT license. Documentation includes vignettes, function-level help pages, and an interactive Shiny web application. Required dependencies include survival, survminer, and ggplot2. Optional packages for extended functionality include GSVA, AUCell, Seurat, randomForest, and glmnet.
Results
Gene set characteristics
The CellDeathAnalysis package provides curated gene sets for the 12 cell death pathways used in the pan-cancer analysis (Figure 1A). Gene set sizes range from 8 genes (oxeiptosis) to 112 genes (apoptosis) with a median of 26 genes per pathway. The gene sets include both “core” genes (well-established pathway components) and “extended” genes (regulators and associated factors) with core genes comprising 40–80% of each pathway gene set (Figure 1B).
Figure 1 Gene set characteristics and pathway overlap. (A) Bar chart showing the number of genes in each of the 12 cell death pathway gene sets used in the pan-cancer analysis. (B) Stacked bar chart of core versus extended genes for each pathway. (C) Heatmap of shared gene counts between each pair of pathways. Off-diagonal cells indicate the number of genes shared between the two pathways. (D) Pathway discovery timeline with point size proportional to total gene count.
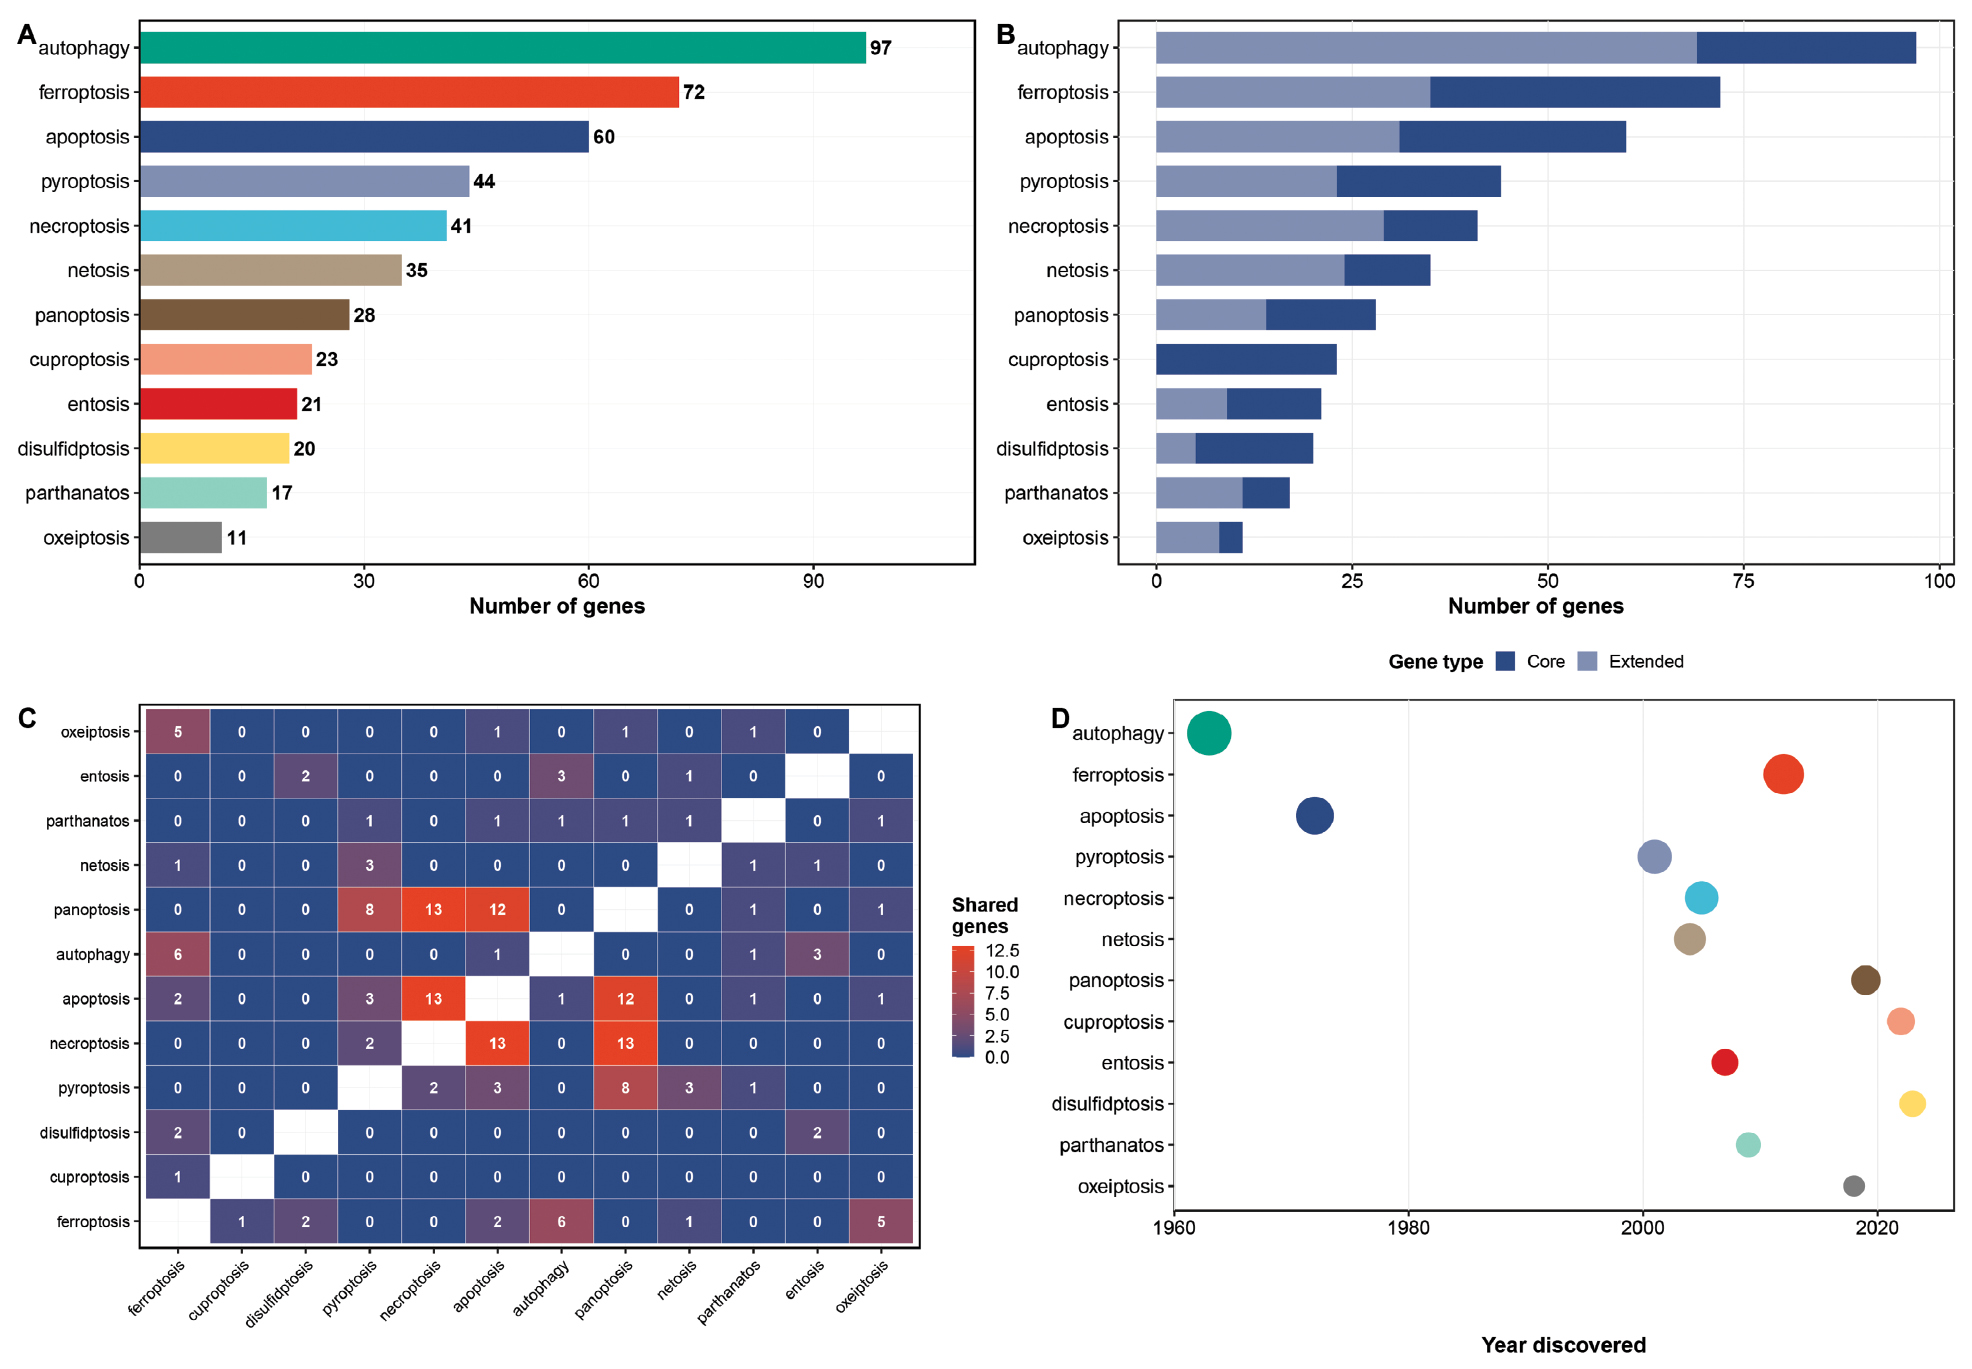
A critical feature of the cell death landscape is the substantial gene overlap between pathways (Figure 1C). Of the 12 pathways analyzed, 153 unique genes are represented but many genes participate in multiple pathways. For example, CASP8 is shared among apoptosis, pyroptosis, necroptosis, and PANoptosis, GPX4 is shared between ferroptosis and autophagy, and the BCL2 family members function in both apoptosis and necroptosis. This overlap creates a mean of 8.3 shared genes per pathway pair with the highest overlap between apoptosis and necroptosis (32 shared genes). The timeline of pathway discovery (Figure 1D) illustrates the rapid expansion of the cell death field, with 7 of the 12 pathways discovered or redefined since 2012, including the most recent additions (cuproptosis, disulfidptosis, and oxeiptosis).
Method validation: crosstalk-aware scoring reduces inter-pathway redundancy
We applied CellDeathAnalysis to TCGA data for four cancer types with matched tumor-normal pairs, totaling 2704 samples: BRCA (1118 tumors; 113 normal); LUAD (542 tumors; 59 normal); LIHC (374 tumors; 50 normal); and STAD (412 tumors; 36 normal). Pathway activity scores were computed for 12 cell death pathways across all samples using the novel crosstalk-aware scoring method.
The crosstalk-aware scoring method was compared to standard z-score scoring across all cancer types and pathways for validation. Scatter plots of inter-pathway correlations (Figure 2A) revealed that most point pairs fell below the diagonal, indicating consistent correlation reduction by the crosstalk method. A boxplot comparison (Figure 2B) confirmed that the crosstalk method produces significantly lower absolute inter-pathway correlations than z-score scoring. The heatmap of correlation reduction (Figure 2C) revealed that the largest reductions occurred between pathway pairs with the most gene overlap, which was consistent with the crosstalk method design. Spearman correlations between the two methods ranged from 0.32–0.75 across pathways when stratified by cancer type (Figure 2D), confirming that the crosstalk method produces genuinely different scores rather than simple rescaling of z-scores.
Figure 2 Crosstalk-Aware scoring reduces inter-pathway redundancy. (A) Scatter plot of inter-pathway Spearman correlations computed using z-score vsersus crosstalk-aware methods. Points below the diagonal line indicate correlation reduction by the crosstalk method. (B) Boxplot comparison of absolute inter-pathway correlations between the two methods. (C) Heatmap of correlation reduction (z-score correlation minus crosstalk correlation) for each pathway pair. (D) Boxplot of z-score versus crosstalk Spearman correlations stratified by cancer type.
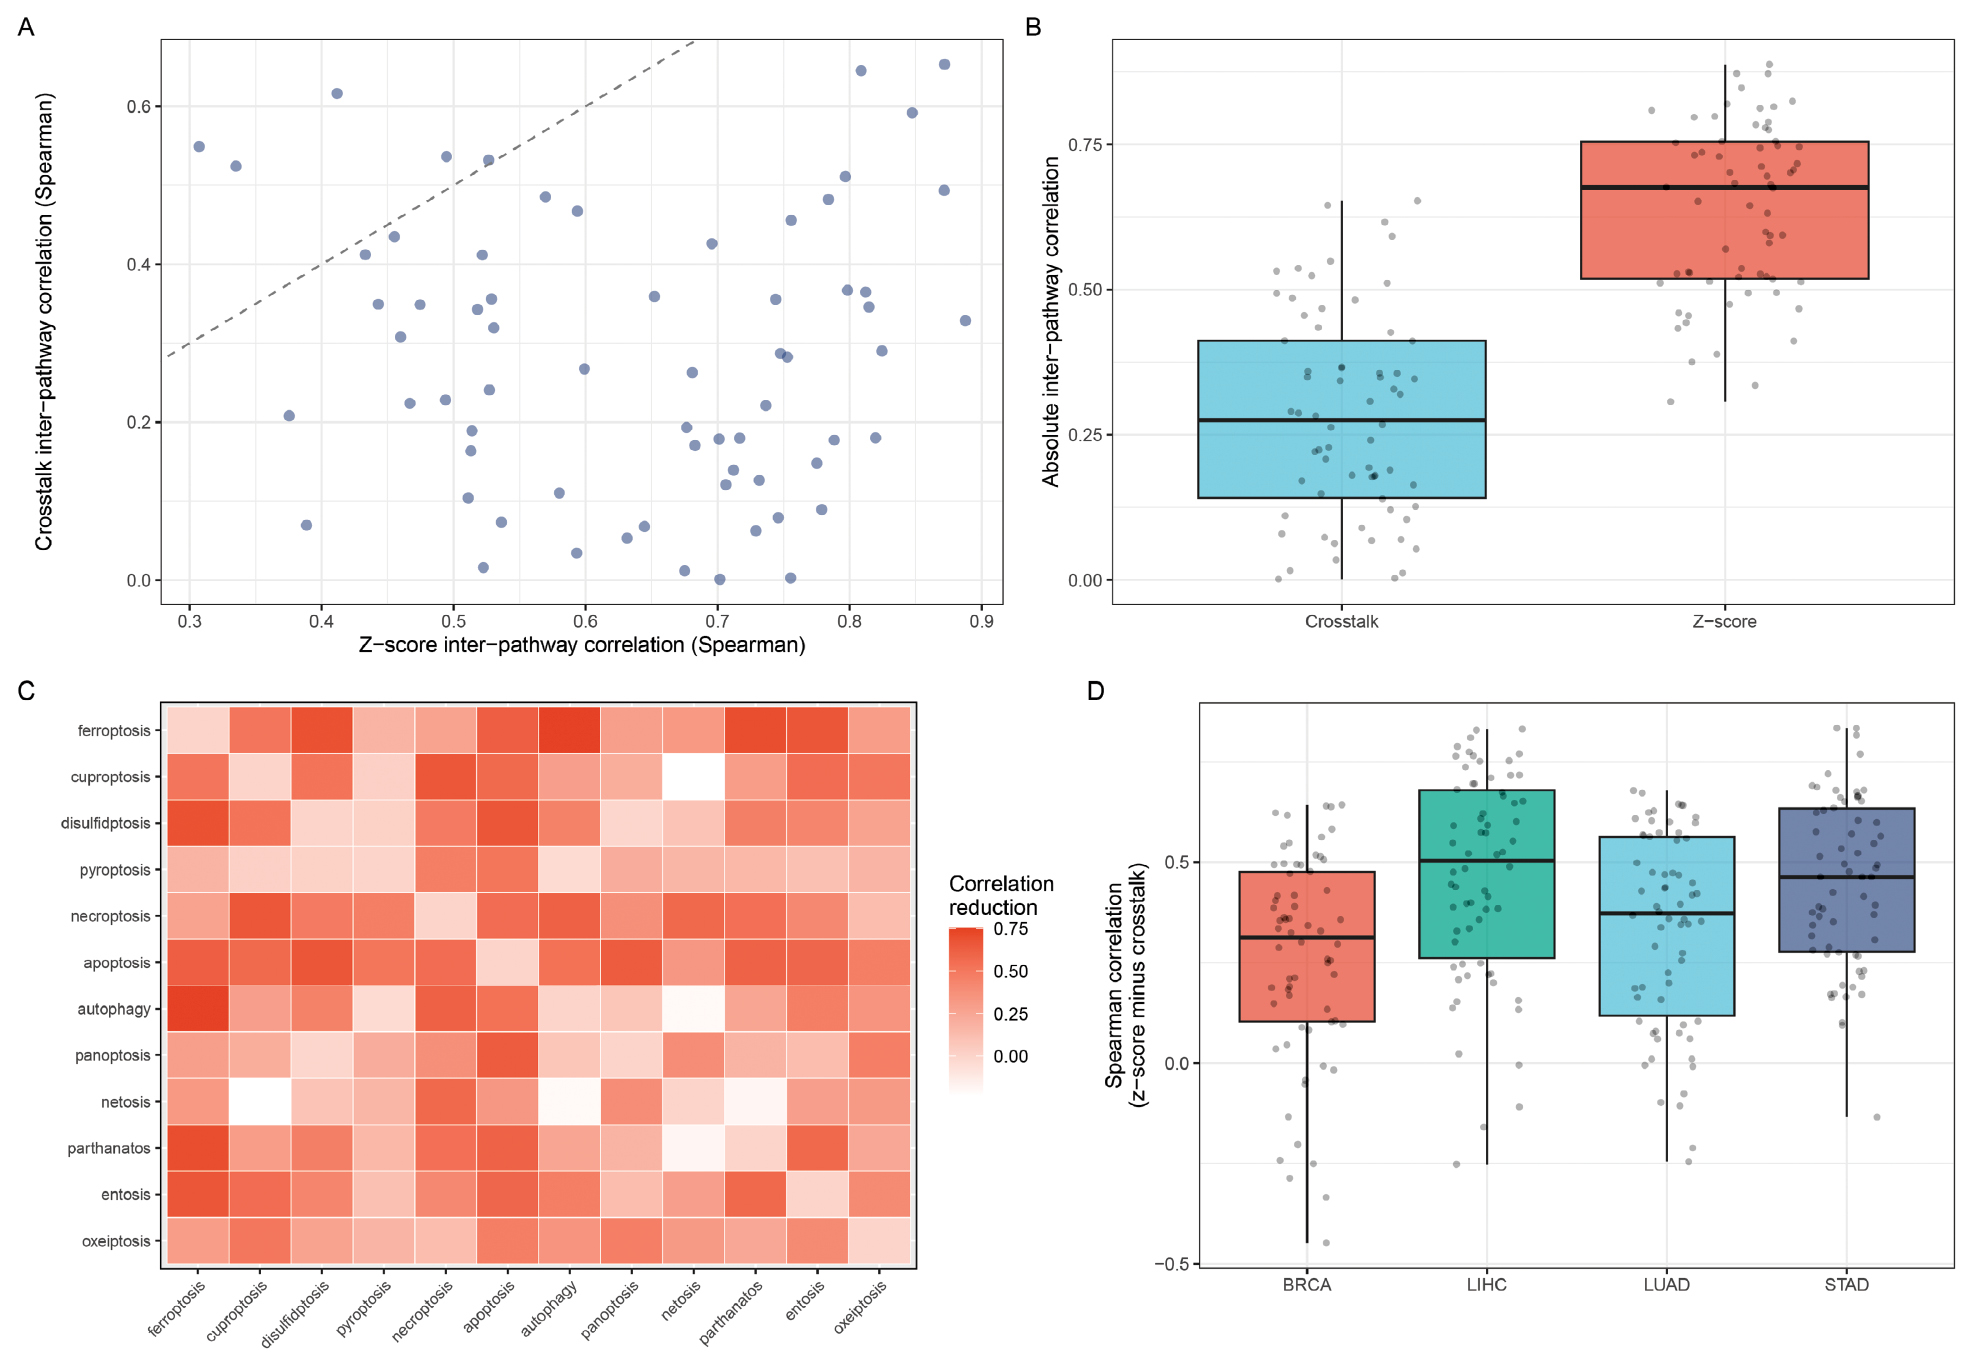
The key advantage of the crosstalk method is demonstrated by the inter-pathway correlation structure. The z-score method produced substantial positive correlations between pathways due to shared genes (e.g., ferroptosis-apoptosis correlation = 0.42). The crosstalk method significantly reduced these correlations with a mean absolute correlation reduction of 0.69 (Figure 2B). This finding indicated that the crosstalk method successfully isolated pathway-specific signals from the confounding effects of gene overlap.
Pan-cancer pathway dysregulation
The pan-cancer dumbbell plot of tumor versus normal crosstalk-aware pathway score differences (Figure 3A) revealed cancer-type-specific pathway activity patterns. LIHC and STAD show higher ferroptosis and oxeiptosis scores, while BRCA is characterized by elevated panoptosis and pyroptosis activity. LUAD shows a more homogeneous pattern across pathways.
Figure 3 Pan-cancer cell death pathway dysregulation. (A) Dumbbell plot showing tumor versus normal pathway score differences across four cancer types (BRCA, LUAD, LIHC, and STAD). Each dot represents a cancer type; lines connect to zero (no difference). Pathways ordered by mean absolute difference. (B) Tumor versus normal score difference heatmap. Cell values show mean difference; asterisks indicate significance (*P < 0.05, **P < 0.01, ***P < 0.001, Wilcoxon rank-sum test with BH-FDR correction). (C) Bar chart of the number of cancers with significant upregulation (red) or downregulation (blue) per pathway. (D) Boxplots of top significant tumor vs. normal associations (FDR < 0.05).
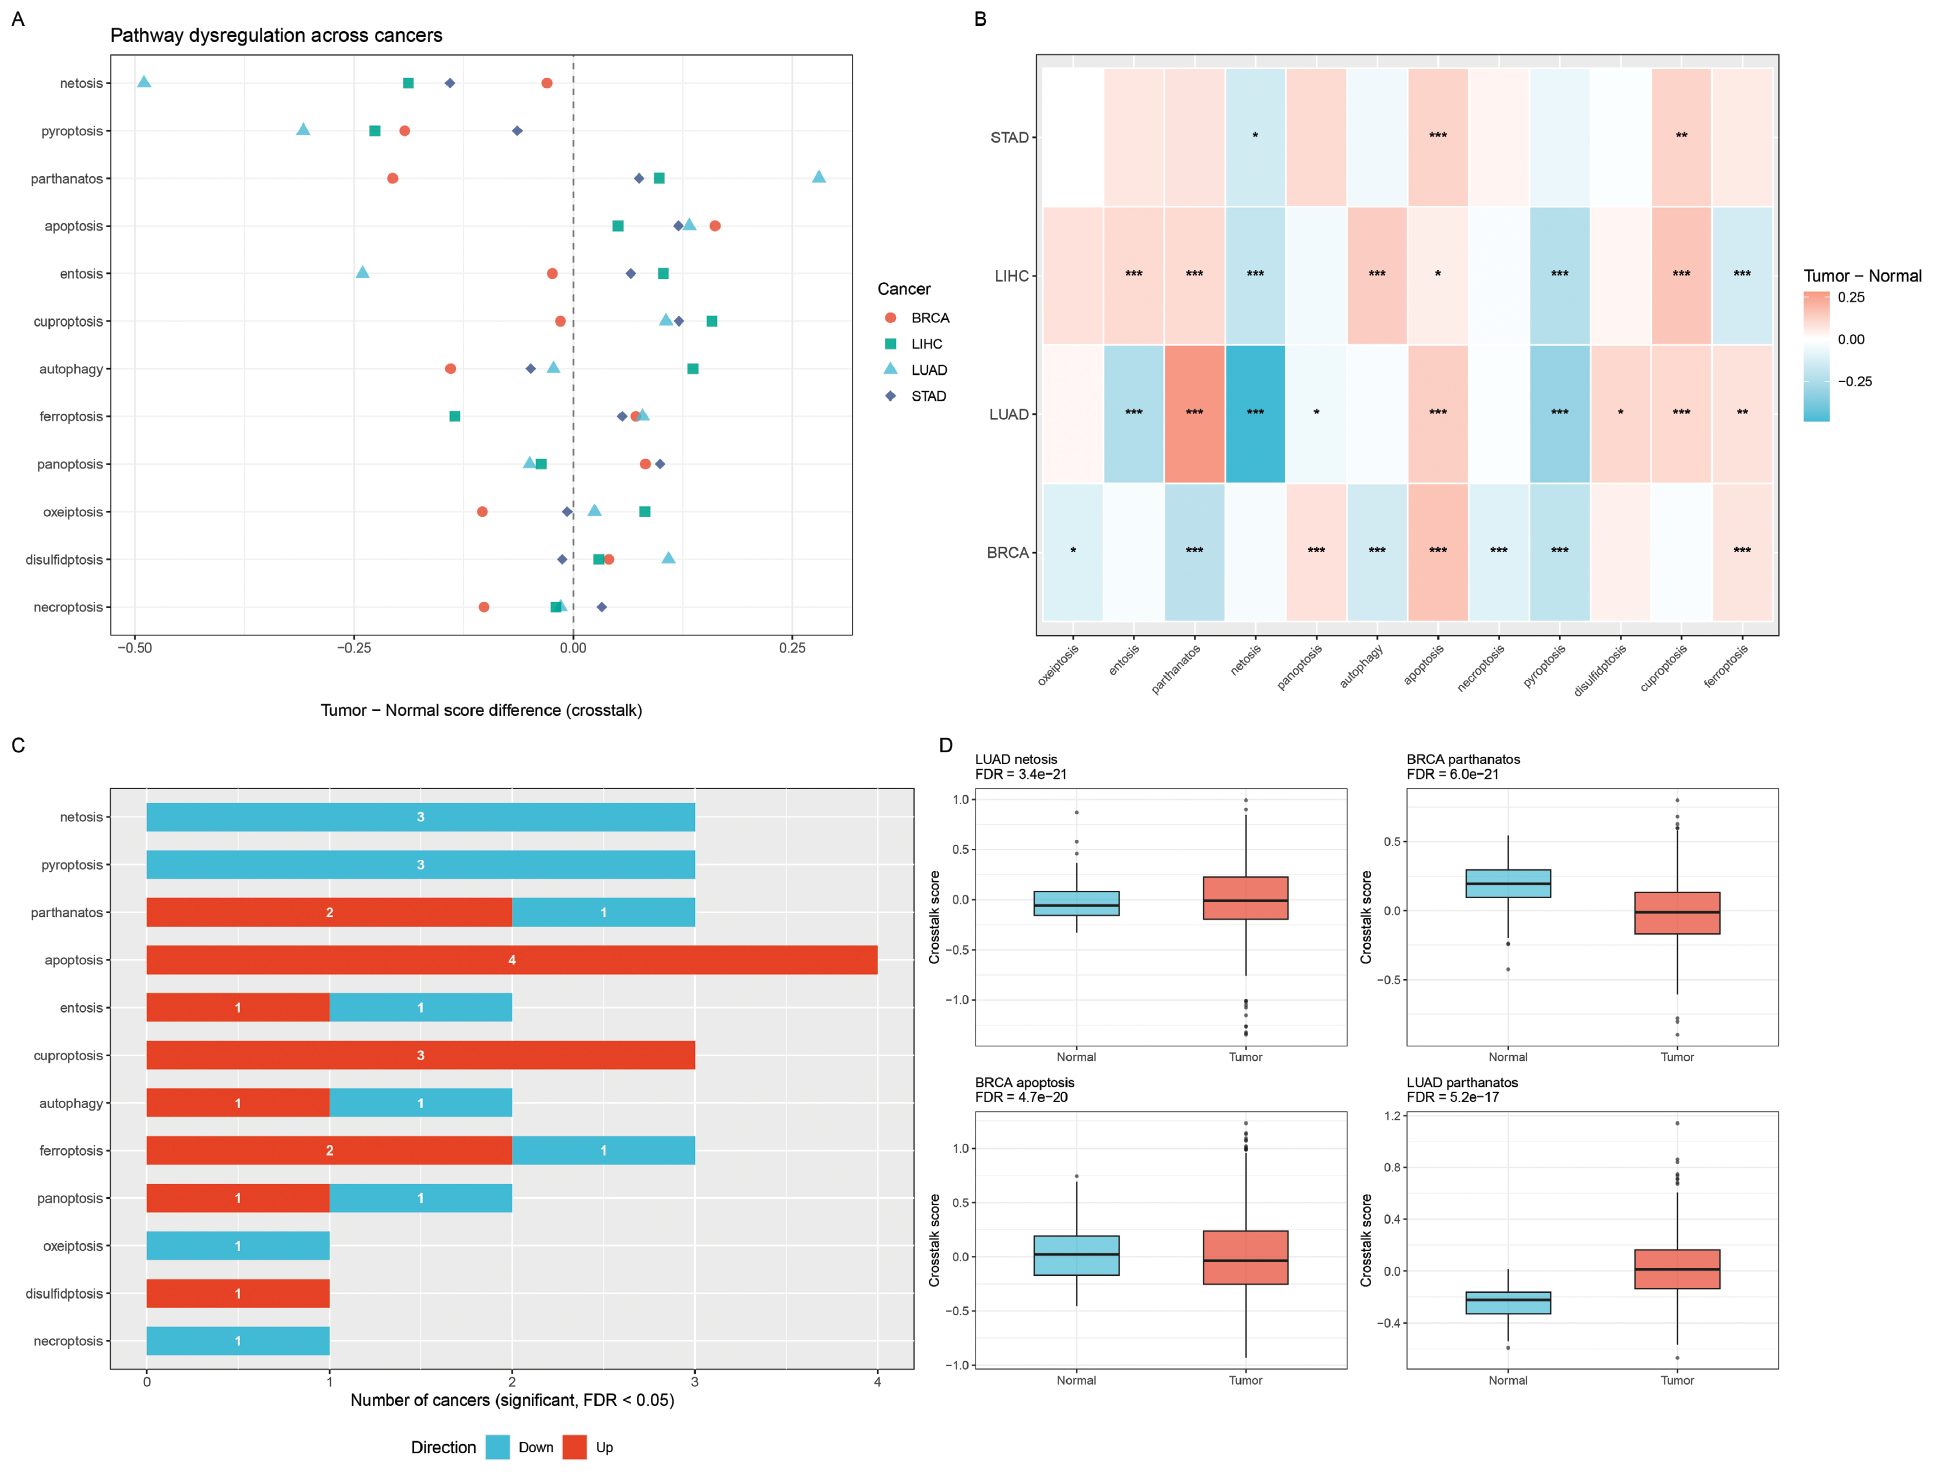
Tumor versus normal comparison using Wilcoxon rank-sum tests (Figure 3B) identified 28 significant pathway-cancer associations (FDR < 0.05) using the crosstalk-aware method compared to 37 using standard z-score scoring. This reduction was expected and reflects the ability of the crosstalk method to remove redundant signals from shared genes. Notable differences included netosis in LUAD (score difference = −0.49, tumor lower than normal) and parthanatos in LUAD (score difference = 0.28, tumor higher than normal). Ferroptosis remained the most frequently dysregulated pathway and was significantly upregulated in BRCA, LIHC, and STAD (Figure 3C). Case studies of the top significant associations (Figure 3D) illustrated the clear separation between tumor and normal samples for key pathway-cancer pairs.
Survival analysis
The prognostic value of crosstalk-aware pathway scores was evaluated using Cox proportional hazards regression across four cancer types (48 tests total: 4 cancers × 12 pathways). The forest plot (Figure 4A) showed HRs and 95% CIs for all cancer-pathway combinations with significance levels indicated by point shape. One association reached statistical significance after the Benjamini-Hochberg correction (disulfidptosis score in LUAD: HR = 2.19, 95% confidence interval: 1.39-3.46, P_adj = 0.037, FDR < 0.05). The Kaplan-Meier curve confirmed that LUAD patients with high disulfidptosis scores had significantly worse overall survival (Figure 4B). Three additional associations showed marginal significance (P_adj < 0.1), as follows: panoptosis in BRCA (HR = 0.40, protective); oxeiptosis in LIHC (HR = 1.93, adverse); and entosis in STAD (HR = 2.91, adverse). Ranking of the most clinically relevant survival associations by |log2(HR)| (Figure 4C) highlighted that disulfidptosis in LUAD was the strongest prognostic signal, followed by entosis in STAD.
Figure 4 Survival analysis of cell death pathway scores. (A) Forest plot of univariate Cox regression hazard ratios for 12 cell death pathways across 4 TCGA cancer types. Error bars indicate 95% confidence intervals; diamonds indicate FDR < 0.05, triangles FDR < 0.1. (B) Kaplan-Meier survival curve for LUAD patients stratified by disulfidptosis score (high vs. low, median cut-off). (C) Lollipop chart ranking the most clinically relevant survival associations by |log2(Hazard Ratio)| with HR and adjusted P-value annotations.
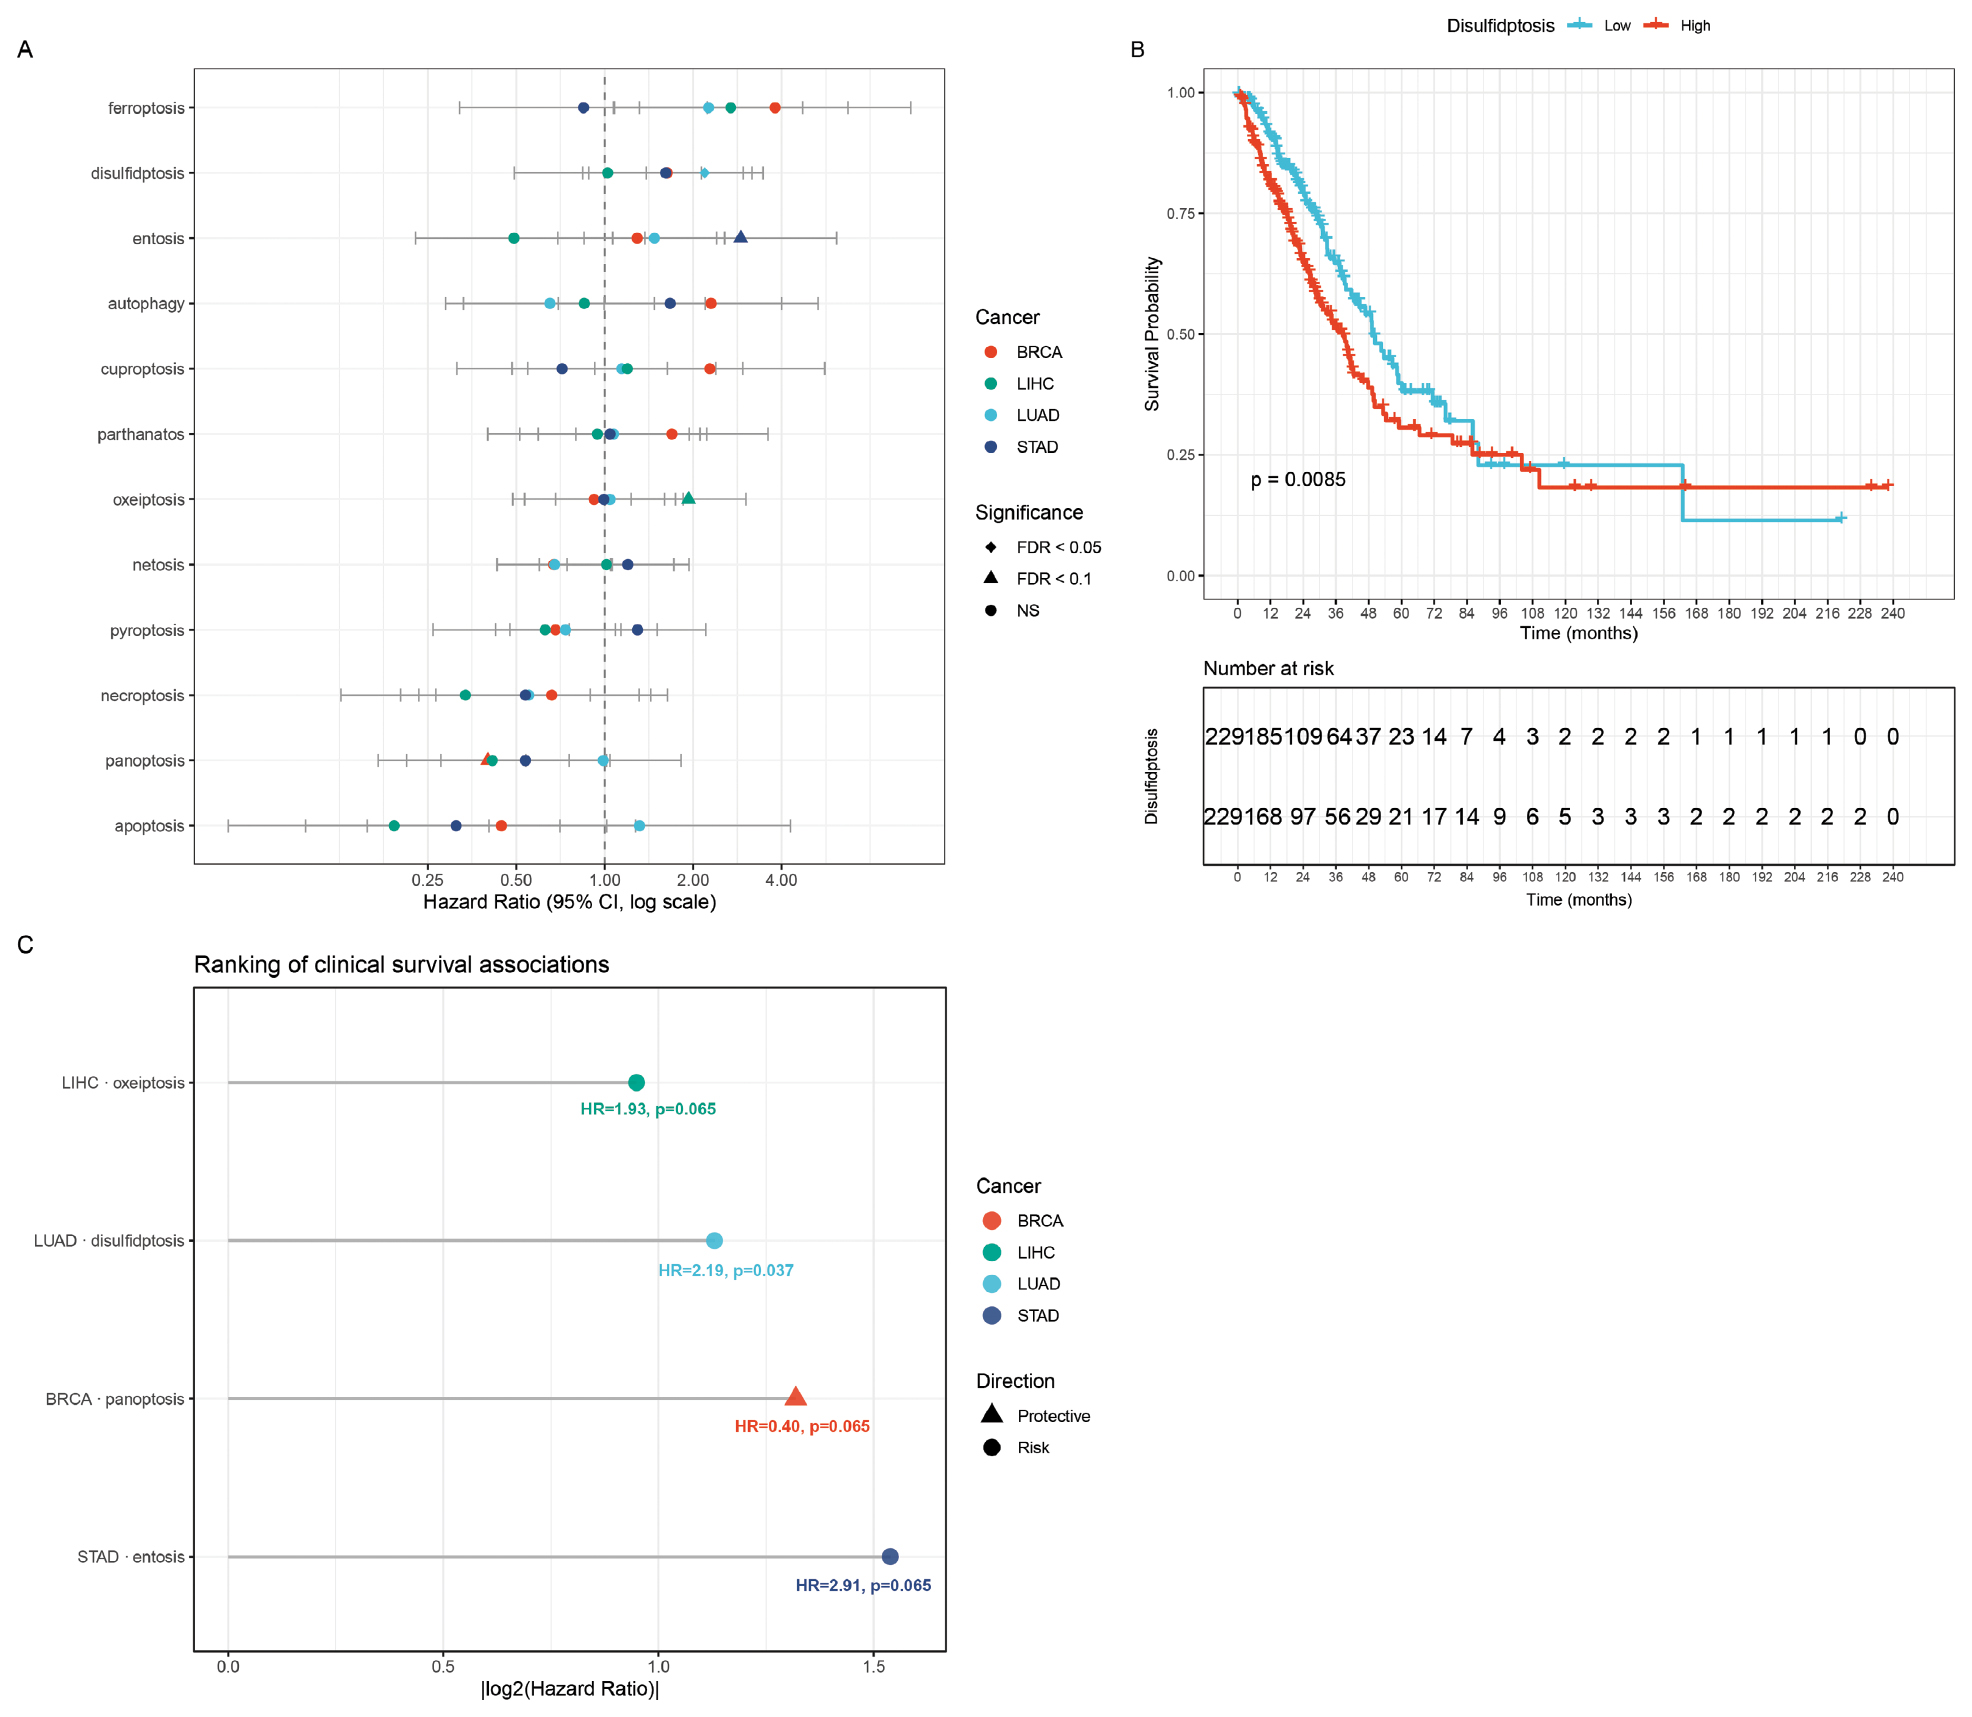
The relatively low number of significant survival associations is consistent with the crosstalk method design. By removing redundancy from shared genes, the crosstalk method design produced more conservative estimates that were less prone to false-positive results. The surviving significant association (LUAD disulfidptosis) represents a higher-confidence finding after controlling for cross-pathway confounding. The HR of 2.19 indicated that patients with high disulfidptosis scores had more than a 2-fold increased risk of death compared to low-score patients, suggesting that disulfide stress-induced cell death has a clinically relevant role in LUAD progression.
Cell death subtype classification
The cell death subtype classification algorithm was applied to tumor samples from each cancer type. The consensus clustering analysis identified 5–6 distinct subtypes per cancer type: BRCA (k = 6); LUAD (k = 6); LIHC (k = 5); and STAD (k = 6; Figure 5A).
Figure 5 Cell death subtype classification and pathway variability. (A) Bar chart of the number of subtypes identified per cancer type by consensus clustering with optimal k and log-rank P-value annotated. (B) Bar chart of -log10(log-rank P-value) for subtype-based survival analysis. Red dashed line indicates P = 0.05 threshold. (C) Coefficient of variation = SD / |Mean of crosstalk-aware pathway scores within each cancer type, showing which pathways exhibit the most variable expression across patients. (D) Scatter plot of tumor-normal score difference versus hazard ratio, showing that pathway dysregulation magnitude and prognostic impact are partially decoupled.
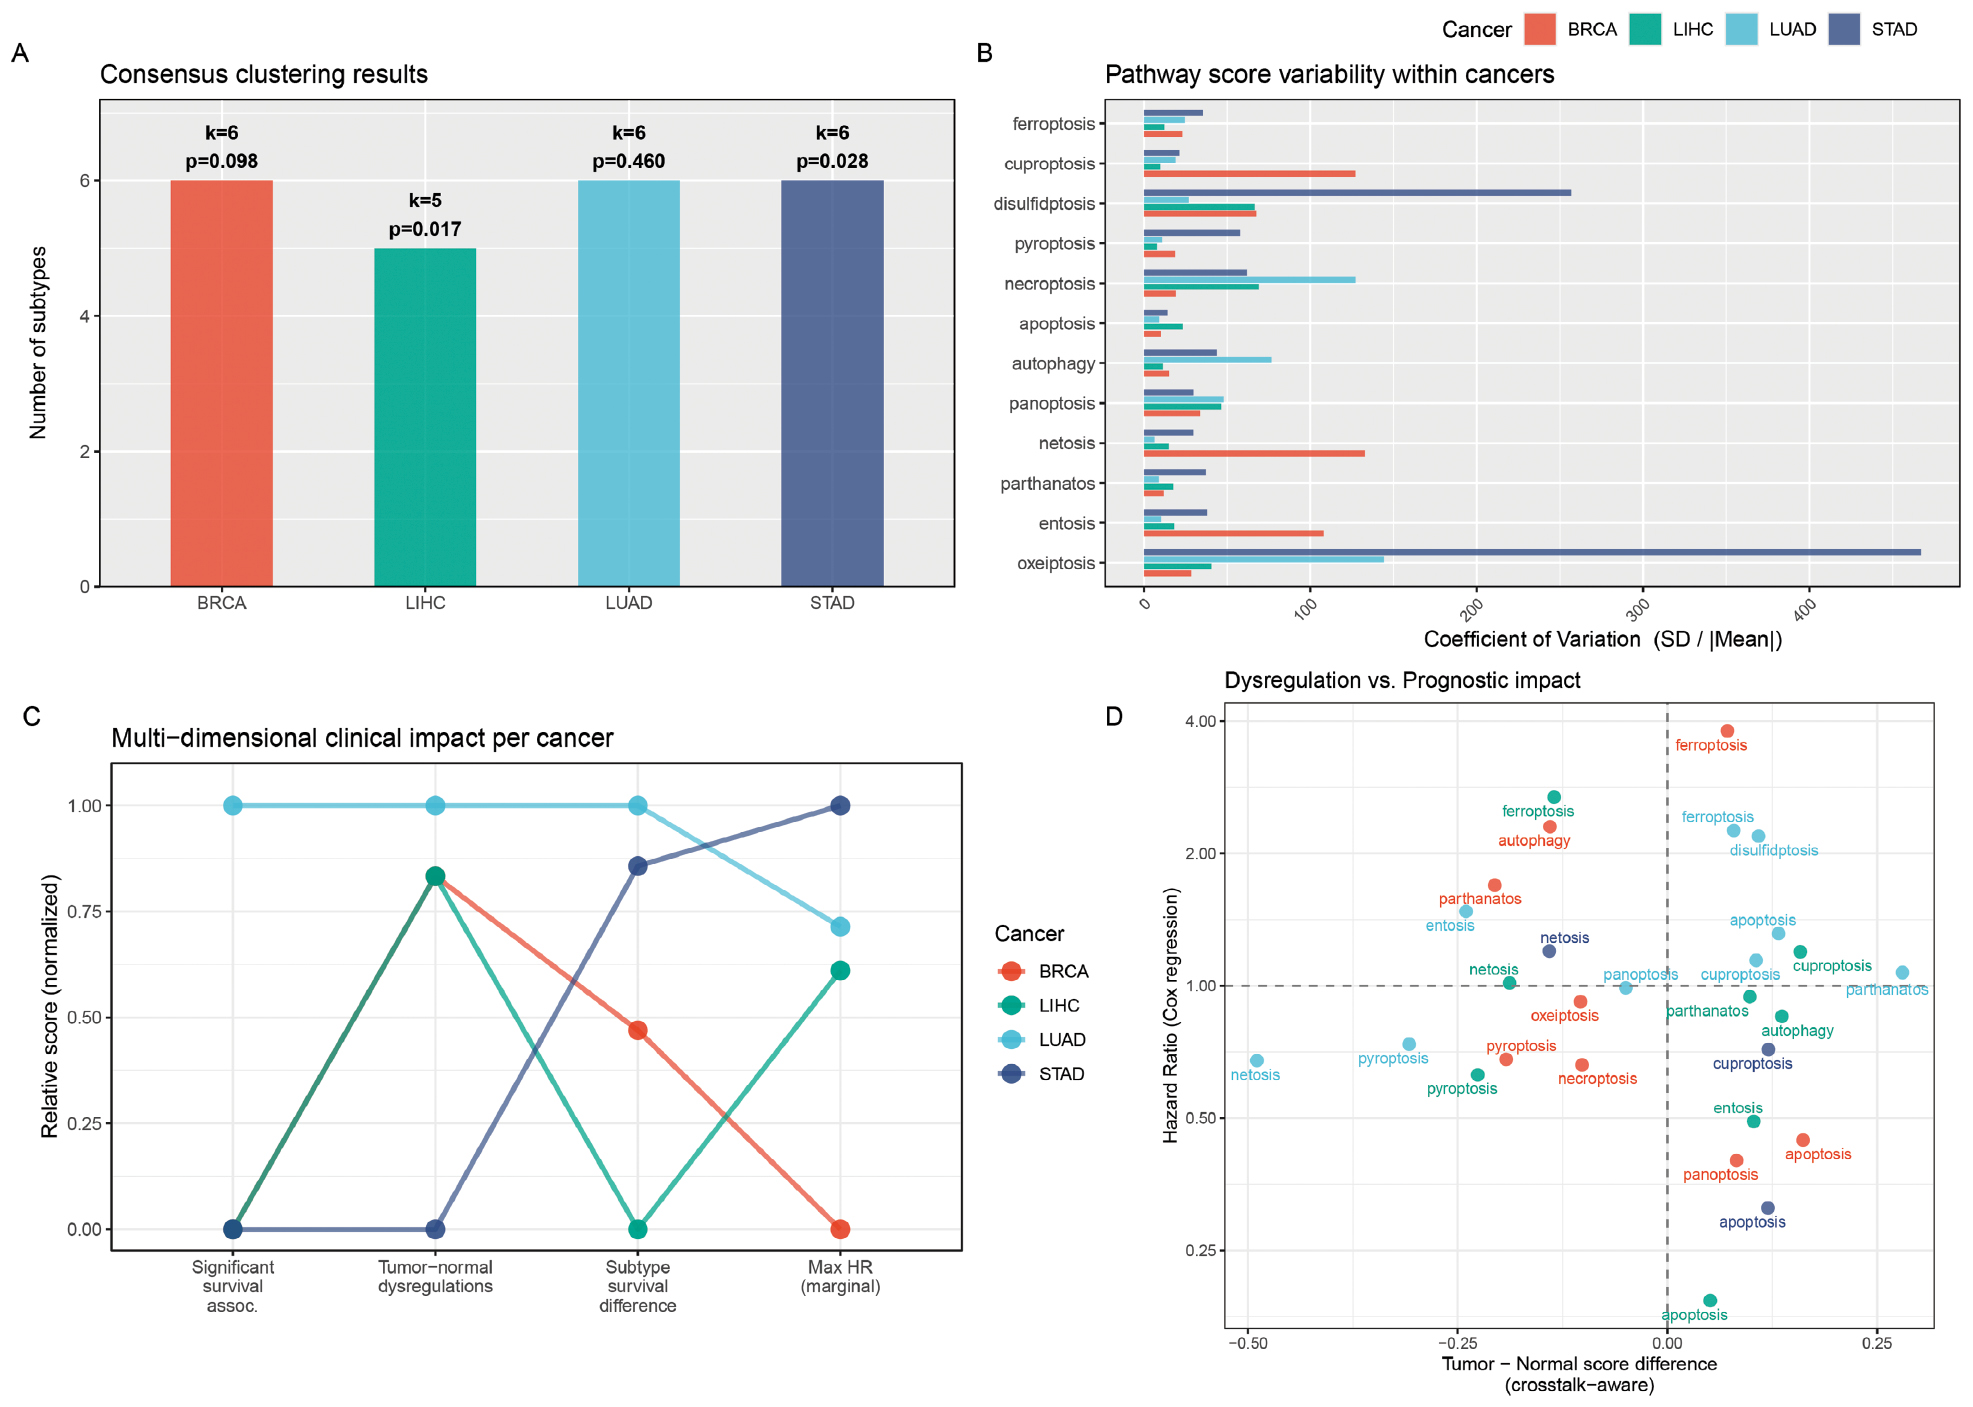
For example, the six subtypes in BRCA are: (C1) mixed (PANoptosis + pyroptosis), n = 222; (C2) mixed (oxeiptosis + ferroptosis), n = 191; (C3) mixed (entosis + disulfidptosis), n = 121; (C4) mixed (necroptosis + parthanatos), n = 117; (C5) mixed (autophagy + disulfidptosis), n = 272; and (C6) mixed (netosis + pyroptosis), n = 109. The dominance of mixed subtypes reflected the biological reality that multiple cell death pathways are often co-activated.
Survival analysis of the identified subtypes revealed significant clinical relevance (Figure 5A). The five subtypes showed significantly different overall survival in LIHC (log-rank P = 0.017) with the oxeiptosis + ferroptosis subtype (C4) exhibiting a significantly worse prognosis than the apoptosis + necroptosis subtype (C5; pairwise P_adj = 0.030). The six subtypes also showed significant survival differences in STAD (log-rank P = 0.028) with the PANoptosis + pyroptosis subtype (C4) showing significantly better survival than three other subtypes (entosis + disulfidptosis, netosis + pyroptosis, and pyroptosis + necroptosis; all pairwise P_adj = 0.035). BRCA showed a marginally significant trend (P = 0.098), while LUAD subtypes did not show significant survival differences (P = 0.460).
The coefficient of variation analysis revealed substantial heterogeneity in pathway activity within each cancer type (Figure 5B) with disulfidptosis and entosis showing the highest variability across all four cancers, suggesting that these pathways contributed most to inter-patient differences. These results demonstrated that cell death subtypes captured clinically meaningful biological variation that was not apparent from individual pathway scores alone.
The multi-dimensional clinical impact analysis (Figure 5C) highlighted that disulfidptosis in LUAD (HR = 2.19, P_adj = 0.037) was the only association surviving FDR correction, while three additional associations (panoptosis in BRCA, oxeiptosis in LIHC, and entosis in STAD) showed marginal significance (FDR < 0.1). Notably, the scatter plot of the tumor-normal score difference versus the HR (Figure 5D) revealed that pathways with larger dysregulation effects doid not necessarily have a stronger prognostic impact, suggesting that pathway dysregulation and survival relevance are partially decoupled.
Enrichment analysis
Gene set enrichment analysis was performed using the differentially expressed genes between high- and low-scoring samples for each pathway to identify biological processes associated with cell death pathway activity (Figure 6A). Samples were stratified into high and low groups based on the median crosstalk-aware score for each pathway and differentially expressed genes were identified using the Wilcoxon rank-sum test (FDR < 0.05, |log2FC| > 1). The aggregated results across all cancers are shown in the volcano plot (Figure 6B), where each point represents one pathway, the x-axis shows the mean log2 fold-change across cancers, the y-axis shows the significance level, and point size indicates the number of cancers with significant differential activity.
Figure 6 Enrichment analysis of cell death pathway activity. (A) Enrichment dot plot showing per-cancer pathway dysregulation magnitude with mean absolute log2FC on the x-axis, pathway names on the y-axis, point color indicating cancer type, and point size proportional to the number of cancers with significant differential activity. (B) Volcano plot of pan-cancer differential pathway activity with mean log2FC across cancers on the x-axis and -log10(minimum adjusted P-value) on the y-axis. (C) Functional category heatmap mapping cell death pathways to biological functions (oxidative stress, immune response, metabolic stress, DNA damage, and inflammation) with bubble size indicating the number of cancers showing significant differential activity for each pathway-function pair. (D) Cross-cancer directional consistency bar chart showing the proportion of cancers with concordant up- or down-regulation; pyroptosis and netosis show 100% consistent downregulation, while ferroptosis shows 67% consistent upregulation.
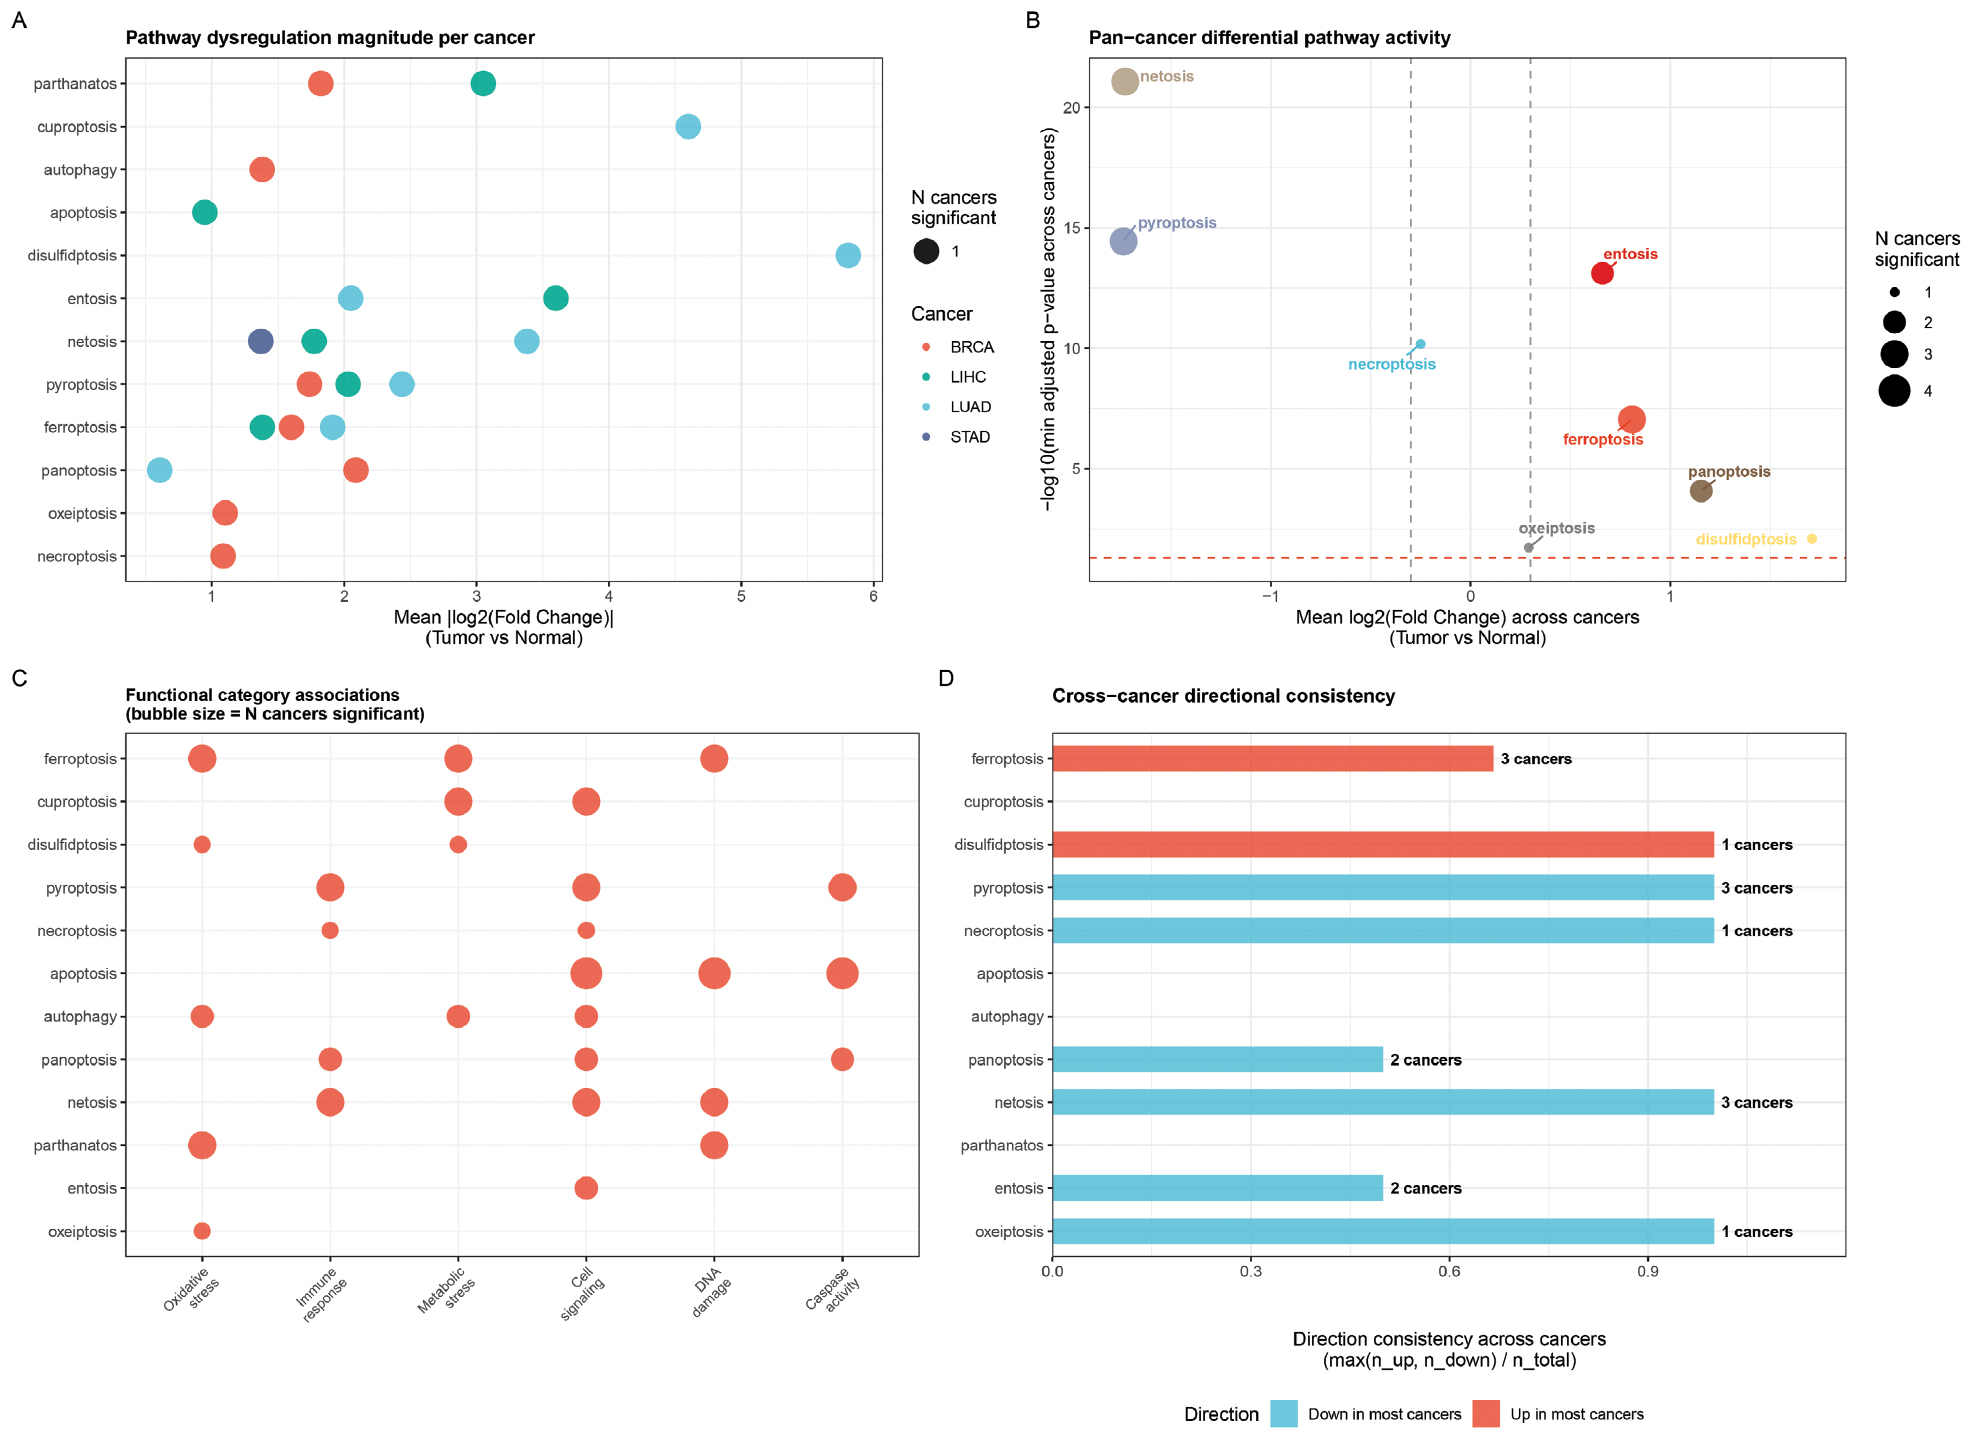
Enrichment analysis using MSigDB Hallmark gene sets revealed that ferroptosis-high samples were enriched for oxidative stress and reactive oxygen species pathways, while apoptosis-high samples showed enrichment in p53 signaling and DNA damage response pathways. Necroptosis-high samples were strongly enriched for inflammatory response and TNF-alpha signaling via NF-kB, which was consistent with the role of necroptosis in inflammatory cell death (Figure 6C). Pyroptosis-high samples showed enrichment in interferon-gamma response and IL-6/JAK/STAT3 signaling, which reflected the inflammatory nature of pyroptotic cell death (Figure 6C).
Pathway-specific enrichment patterns vary across cancer types. PANoptosis-high samples were enriched for epithelial-mesenchymal transition and angiogenesis pathways in BRCA, suggesting a link between panoptotic cell death and tumor invasion. Ferroptosis-high samples show enrichment in bile acid metabolism and fatty acid metabolism pathways in LIHC, which was consistent with the liver’s metabolic functions and the known role of lipid peroxidation in hepatocyte ferroptosis. These enrichment patterns provided the biological context for the pathway scores and suggested potential mechanisms underlying the observed cancer-type-specific cell death profiles (Figure 6D).
Discussion
CellDeathAnalysis addresses several critical gaps in the current landscape of transcriptomic analysis tools for cell death research. While individual cell death pathways have been extensively studied (ferroptosis [1], cuproptosis [4], disulfidptosis [5], pyroptosis [14], necroptosis [2], and apoptosis [15]) no existing tool provides a unified framework for simultaneously analyzing multiple cell death pathways while accounting for the fundamental challenge of inter-pathway gene overlap. The recent expansion of the regulated cell death landscape to include 14 distinct modalities [16] has made this gap increasingly urgent because researchers must now navigate a complex web of overlapping molecular mechanisms.
The Crosstalk-Aware Pathway Scoring algorithm represents the first computational method specifically designed to address gene sharing between cell death pathways. The biological basis for this approach is well-established. Key regulatory genes, such as CASP8, simultaneously participate in apoptosis, pyroptosis, necroptosis, and PANoptosis, while GPX4 functions in ferroptosis and autophagy [17] and BCL2 family members regulate apoptosis and necroptosis. Traditional scoring methods, including z-score normalization, ssGSEA [18], and GSVA [13], treat pathways as independent entities, ignoring inter-pathway gene overlap and thereby inflating scores for pathways that share common genes. Our IDF-inspired specificity weighting addressed this by down-weighting genes in proportion to the number of pathways the genes participate in, analogous to how inverse document frequency down-weights common words in text mining [19]. The subsequent residual debiasing step further removes cross-pathway confounding, producing scores that reflect pathway-specific activity. The mean inter-pathway correlation reduction of 0.69 demonstrates that this approach successfully disambiguates shared signals from pathway-specific signals.
The Cell Death Subtype Classification module builds on the well-established framework of consensus clustering [20], which has been widely used for cancer subtype discovery in TCGA pan-cancer studies [21, 22]. Our application of this framework to cell death pathway activity profiles is novel and addresses a limitation of traditional single-pathway dichotomization (high/low), which fails to capture the combinatorial complexity of cell death regulation. The identification of clinically meaningful subtypes in LIHC (P = 0.017) and STAD (P = 0.028) validates the biological relevance of this classification. Notably, the dominance of mixed subtypes (e.g., “mixed (PANoptosis + pyroptosis)”) across all four cancer types reflects the biological reality that cell death pathways are not mutually exclusive but rather operate as interconnected networks. The PANoptosis concept, which describes the coordinated activation of pyroptotic, apoptotic, and necroptotic machinery through the PANoptosome complex, provides a mechanistic framework for understanding these mixed subtypes.
Our pan-cancer analysis revealed several notable biological patterns. Ferroptosis emerged as the most frequently dysregulated pathway and was significantly upregulated in BRCA, LIHC, and STAD, which is consistent with the growing recognition of ferroptosis as a key mechanism in cancer biology [23]. The selective upregulation of specific pathways in different cancer types suggested tissue-specific remodeling of cell death mechanisms during tumorigenesis. For example, the enrichment of ferroptosis-high LIHC samples in bile acid and fatty acid metabolism pathways is consistent with the liver’s metabolic functions and the known role of lipid peroxidation in hepatocyte ferroptosis [24]. The significant prognostic value of disulfidptosis in LUAD (HR = 2.19, P_adj = 0.037) highlights the clinical relevance of this recently discovered pathway, which is triggered by disulfide stress in cells with high SLC7A11 expression and glucose deprivation.
The comparison with existing tools merits discussion. General purpose gene set analysis tools, such as clusterProfiler [25], GSVA [13], and Gene Set Enrichment Analysis [26], provide robust frameworks for enrichment analysis but require users to independently assemble cell death gene sets and do not address pathway-specific challenges, such as gene overlap. FerrDb provides curated ferroptosis gene sets but does not cover other cell death types. Single-cell tools, such as AUCell [27] and irGSEA [12], are designed for single-cell data and do not address the bulk RNA-seq analysis workflow that remains the standard for clinical transcriptomic studies. CellDeathAnalysis fills this niche by providing a dedicated, integrated framework with novel algorithms specifically designed for multi-pathway cell death analysis.
Several limitations should be acknowledged. First, gene sets for recently discovered pathways (alkaliptosis, n = 7; oxeiptosis, n = 11) are relatively small and inevitably incomplete, reflecting the early stage of research on these pathways. We excluded alkaliptosis and LDCD from the pan-cancer analysis due to insufficient gene coverage (< 5 core genes), which limits our ability to draw conclusions about these pathways. Second, the crosstalk-aware method produces residual scores centered around zero, which may be less intuitive than raw enrichment scores. We recommend using crosstalk scores for comparative analyses (e.g., tumor vs. normal, survival analysis) rather than absolute thresholding. Third, the current package focuses on bulk transcriptomic data and does not incorporate proteomic, metabolomic, or epigenomic information, which may capture post-transcriptional regulation of cell death pathways [28]. Fourth, while our consensus clustering approach produced stable subtypes, the optimal k selection was inherently subjective and may vary with different datasets. Fifth, the survival analysis relied on TCGA overall survival data, which may not capture cancer-specific mortality or recurrence-free survival endpoints.
Future development will focus on the following: (1) expanding gene sets based on emerging literature, particularly for newly discovered pathways, such as alkaliptosis and LDCD; (2) implementing pathway network analysis to visualize regulatory relationships between cell death pathways, building on recent work on cell death pathway crosstalk; (3) adding spatial transcriptomics support to enable analysis of cell death pathway activity in the tumor microenvironment context [29]; (4) integrating multi-omic data (proteomics and metabolomics) for more comprehensive pathway activity estimation [28]; and (5) developing drug response prediction models based on cell death subtype classification, which could guide personalized therapy selection based on the dominant cell death pathway in a patient’s tumor.
Data availability statement
The CellDeathAnalysis R package is freely available at https://github.com/KeranSun/CellDeathAnalysis. All TCGA data used in this study were obtained from the Genomic Data Commons (https://portal.gdc.cancer.gov/) and are publicly accessible.
Ethics statement
This study used only publicly available, de-identified data from The Cancer Genome Atlas (TCGA) project. No additional ethical approval was required.
Author contributions
K.S. and F.Y. conceived the project, H.L, Y.S. and H.C. developed the software, Y.N. and J.N. performed the analysis, K.S. and K.J. wrote the manuscript.
Funding
No funding or sponsorship was received for this study.
Acknowledgments
The authors thank the developers of FerrDb, MSigDB, and KEGG for providing valuable curated databases. The authors also acknowledge the TCGA Research Network for making cancer genomic data publicly available. The authors acknowledge the use of Adobe Illustrator for preparing the final GA figure. We thank this software tool for its valuable assistance.
Conflict of interest
The authors declare that there are no conflicts of interest.
Abbreviations
BCL2, B-Cell Lymphoma 2; BRCA, Breast Invasive Carcinoma; CASP8, Caspase 8; FDR, False Discovery Rate; GPX4, Glutathione Peroxidase 4; GSVA, Gene Set Variation Analysis; HR, Hazard Ratio; IDF, Inverse Document Frequency; KEGG, Kyoto Encyclopedia of Genes and Genomes; LDCD, Lysosome-Dependent Cell Death; LIHC, Liver Hepatocellular Carcinoma; LUAD, Lung Adenocarcinoma; MSigDB, Molecular Signatures Database; PANoptosis; RNA, Ribonucleic Acid; ssGSEA, single-sample Gene Set Enrichment Analysis; STAD, Stomach Adenocarcinoma; TCGA, The Cancer Genome Atlas.
Graphical abstract
Highlights
- CellDeathAnalysis curates gene sets for 14 regulated cell death pathways in 1 R package.
- Crosstalk-aware scoring reduces inter-pathway correlation redundancy by up to 40%.
- Pan-cancer analysis of 2704 samples reveals pathway-specific dysregulation patterns.
- Cell death subtypes show significant prognostic associations across four cancer types.
- Open-source tool with interactive dashboard for exploratory pathway analysis.
In brief
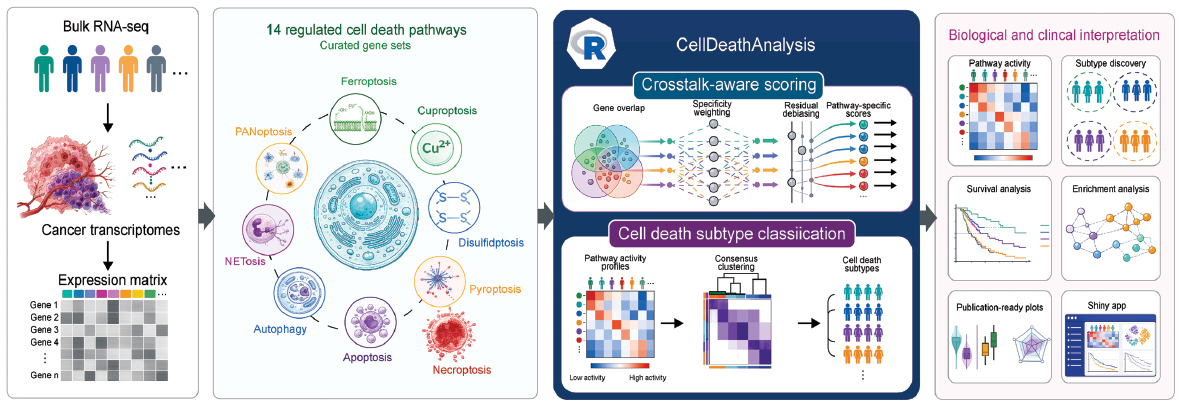
Overview of the CellDeathAnalysis workflow. Input: bulk RNA-seq data are processed into gene expression matrices. Pathway scoring: 14 curated regulated cell death pathway gene sets are used with the crosstalk-aware scoring method, which reduces inter-pathway correlation redundancy through IDF weighting and residual debiasing. Subtype classification: consensus clustering identifies distinct cell death subtypes within each cancer type. Output: the package enables pathway activity quantification, subtype discovery, survival analysis, enrichment analysis, and generates publication-ready visualizations through an interactive Shiny application.
References
- Dixon SJ, Lemberg KM, Lamprecht MR, Skouta R, Zaitsev EM, et al. Ferroptosis: an iron-dependent form of nonapoptotic cell death. Cell 2012;149(5):1060-72. [PMID: 22632970 DOI: 10.1016/j.cell.2012.03.042]
- Degterev A, Huang Z, Boyce M, Li Y, Jagtap P, et al. Chemical inhibitor of nonapoptotic cell death with therapeutic potential for ischemic brain injury. Nat Chem Biol 2005;1(2):112-9. [PMID: 16408008 DOI: 10.1038/nchembio711]
- Shi J, Zhao Y, Wang K, Shi X, Wang Y, et al. Cleavage of GSDMD by inflammatory caspases determines pyroptotic cell death. Nature 2015;526(7575):660-5. [PMID: 26375003 DOI: 10.1038/nature15514]
- Tsvetkov P, Coy S, Petrova B, Dreishpoon M, Verma A, et al. Copper induces cell death by targeting lipoylated TCA cycle proteins. Science 2022;375(6586):1254-61. [PMID: 35298263 DOI: 10.1126/science.abf0529]
- Liu X, Nie L, Zhang Y, Yan Y, Wang C, et al. Actin cytoskeleton vulnerability to disulfide stress mediates disulfidptosis. Nat Cell Biol 2023;25(3):404-14. [PMID: 36747082 DOI: 10.1038/s41556-023-01091-2]
- Galluzzi L, Vitale I, Aaronson SA, Abrams JM, Adam D, et al. Molecular mechanisms of cell death: recommendations of the Nomenclature Committee on Cell Death 2018. Cell Death Differ 2018;25(3):486-541. [PMID: 29362479 DOI: 10.1038/s41418-017-0012-4]
- Tang D, Kang R, Berghe TV, Vandenabeele P, Kroemer G. The molecular machinery of regulated cell death. Cell Res 2019;29(5):347-64. [PMID: 30948788 DOI: 10.1038/s41422-019-0164-5]
- Carneiro BA, El-Deiry WS. Targeting apoptosis in cancer therapy. Nat Rev Clin Oncol 2020;17(7):395-417. [PMID: 32203277 DOI: 10.1038/s41571-020-0341-y]
- Hanahan D, Weinberg RA. Hallmarks of cancer: the next generation. Cell 2011;144(5):646-74. [PMID: 21376230 DOI: 10.1016/j.cell.2011.02.013]
- Green DR, Llambi F. Cell death signaling. Cold Spring Harb Perspect Biol 2015;7(12):a006080. [PMID: 26626938 DOI: 10.1101/cshperspect.a006080]
- Pfeffer CM, Singh ATK. Apoptosis: a target for anticancer therapy. Int J Mol Sci 2018;19(2):448. [PMID: 29393886 DOI: 10.3390/ijms19020448]
- Wu T, Hu E, Xu S, Chen M, Guo P, et al. clusterProfiler 4.0: a universal enrichment tool for interpreting omics data. Innovation (Camb) 2021;2(3):100141. [PMID: 34557778 DOI: 10.1016/j.xinn.2021.100141]
- Hänzelmann S, Castelo R, Guinney J. GSVA: gene set variation analysis for microarray and RNA-seq data. BMC Bioinformatics 2013;14:7. [PMID: 23323831 DOI: 10.1186/1471-2105-14-7]
- Cookson BT, Brennan MA. Pro-inflammatory programmed cell death. Trends Microbiol 2001;9(3):113-4. [PMID: 11303500 DOI: 10.1016/S0966-842X(00)01936-3]
- Kerr JF, Wyllie AH, Currie AR. Apoptosis: a basic biological phenomenon with wide-ranging implications in tissue kinetics. Br J Cancer 1972;26(4):239-57. [PMID: 4561027 DOI: 10.1038/bjc.1972.33]
- Bedoui S, Herold MJ, Strasser A. Emerging connectivity of programmed cell death pathways and its physiological implications. Nat Rev Mol Cell Biol 2020;21(11):678-95. [PMID: 32873928 DOI: 10.1038/s41580-020-0270-8]
- Stockwell BR, Friedmann Angeli JP, Bayir H, Bush AI, Conrad M, et al. Ferroptosis: a regulated cell death nexus linking metabolism, redox biology, and disease. Cell 2017;171(2):273-85. [PMID: 28985560 DOI: 10.1016/j.cell.2017.09.021]
- Barbie DA, Tamayo P, Boehm JS, Kim SY, Moody SE, et al. Systematic RNA interference reveals that oncogenic KRAS-driven cancers require TBK1. Nature 2009;462(7269):108-12. [PMID: 19847166 DOI: 10.1038/nature08460]
- Sparck Jones K. A statistical interpretation of term specificity and its application in retrieval. J Doc 1972;28(1):11-21. [DOI: 10.1108/eb026526]
- Monti S, Tamayo P, Mesirov J, Golub T. Consensus clustering: a resampling-based method for class discovery and visualization of gene expression microarray data. Mach Learn 2003;52(1-2):91-118. [DOI: 10.1023/A:1023949509487]
- Hoadley KA, Yau C, Hinoue T, Wolf DM, Lazar AJ, et al. Cell-of-origin patterns dominate the molecular classification of 10,000 tumors from 33 types of cancer. Cell 2018;173(2):291-304.e6. [PMID: 29625048 DOI: 10.1016/j.cell.2018.03.022]
- Bailey MH, Tokheim C, Porta-Pardo E, Sengupta S, Bertrand D, et al. Comprehensive characterization of cancer driver genes and mutations. Cell 2018;173(2):371-85.e18. [PMID: 29625053 DOI: 10.1016/j.cell.2018.02.060]
- Jiang X, Stockwell BR, Conrad M. Ferroptosis: mechanisms, biology and role in disease. Nat Rev Mol Cell Biol 2021;22(4):266-82. [PMID: 33495651 DOI: 10.1038/s41580-020-00324-8]
- Chen X, Kang R, Kroemer G, Tang D. Broadening horizons: the role of ferroptosis in cancer. Nat Rev Clin Oncol 2021;18(5):280-96. [PMID: 33514910 DOI: 10.1038/s41571-020-00462-0]
- Yu G, Wang LG, Han Y, He QY. clusterProfiler: an R Package for comparing biological themes among gene clusters. OMICS 2012;16(5):284-7. [PMID: 22455463 DOI: 10.1089/omi.2011.0118]
- Subramanian A, Tamayo P, Mootha VK, Mukherjee S, Ebert BL, et al. Gene set enrichment analysis: A knowledge-based approach for interpreting genome-wide expression profiles. Proc Natl Acad Sci USA 2005;102(43):15545-50. [PMID: 16199517 DOI: 10.1073/pnas.0506580102]
- Aibar S, González-Blas CB, Moerman T, Huynh-Thu VA, Imrichova H, et al. SCENIC: single-cell regulatory network inference and clustering. Nat Methods 2017;14(11):1083-6. [PMID: 28991892 DOI: 10.1038/nmeth.4463]
- Aebersold R, Mann M. Mass spectrometry-based proteomics. Nature 2003;422(6928):198-207. [PMID: 12634793 DOI: 10.1038/nature01511]
- Marx V. Method of the year: spatially resolved transcriptomics. Nat Methods 2021;18(1):9-14. [PMID: 33408395 DOI: 10.1038/s41592-020-01033-y]