Integrated Single-cell RNA Sequencing Atlas of White Matter Microglial Functional Diversity in Chronic Multiple Sclerosis
1Shandong University of Traditional Chinese Medicine, Jinan, Shandong 250014, China
2Department of Gynecology, Longhua Hospital Shanghai University of Traditional Chinese Medicine, Shanghai, China
*Correspondence to: Zhiheng Lin, Department of Gynecology, Longhua Hospital, Shanghai University of Traditional Chinese Medicine, Shanghai 200032, China. E-mail: linzhiheng@shutcm.edu.cn
Received: November 14 2025; Revised: January 13 2026; Accepted: March 21 2026; Published Online: May 2 2026
Cite this paper:
Shang Y, Sun L, Lin J et al. Integrated Single-cell RNA Sequencing Atlas of White Matter Microglial Functional Diversity in Chronic Multiple Sclerosis. BIO Integration 2026; 7: 1–16.
DOI: 10.15212/bioi-2025-0209. Available at: https://bio-integration.org/
Download citation
© 2026 The Authors. This is an open access article distributed under the terms of the Creative Commons Attribution License (https://creativecommons.org/licenses/by/4.0/). See https://bio-integration.org/copyright-and-permissions/
Abstract
Background: In multiple sclerosis (MS), chronic “smoldering” lesions are driven by microglial activation, which promotes demyelination and disease progression. However, microglia exhibit a functional dichotomy by performing both neurotoxic and reparative roles. Precisely modulating these functions remains a major therapeutic challenge, because non-specific approaches can inadvertently impair beneficial microglial functions. Delineating microglial subtypes in chronic MS is therefore essential for targeted therapy.
Methods: Single-cell RNA sequencing, spatial transcriptomics, deconvolution, and pseudotime trajectory mapping were used to characterize cell subtypes. Subsequent investigations encompassed functional annotation, differential gene expression profiling, cell-cell communication pathways, and transcription factor network analysis.
Results: We identified six distinct microglial subtypes with varied functions and focused on the highly disease-relevant C2 microglial subtype. This subtype simultaneously exhibited enhanced phagocytic and pro-inflammatory functions potentially associated with the fatty acid metabolic pathway. Pseudotime trajectory analysis suggested that this subtype is likely to represent a late disease stage. Cell-cell communication analysis revealed interactions between this subtype and both oligodendrocytes and T cells, as further supported by spatial transcriptomics demonstrating co-localization of the C2 microglial subtype with T cells. Finally, transcriptional regulatory network analysis identified an association between the FOSL2 regulon and both the C2 microglial subtype and chronic MS.
Conclusion: Through integrated single-cell sequencing approaches, we identified a C2 microglial subtype in chronic MS that might contribute to disease progression via pro-inflammatory functions. We propose the transcription factor FOSL2 as a promising hypothesis-generating candidate for future studies aimed at modulating microglial differentiation toward a less harmful state. Our findings provide mechanistic insights into the pathology of white matter lesions in chronic MS and suggest novel subtype-specific directions for the development of next-generation disease-modifying therapies.
Keywords
Biology and biochemistry; immunology; medicine; neurosciences.
Introduction
Multiple sclerosis (MS), an immune-mediated inflammatory demyelinating disease affecting the central nervous system (CNS), has a global prevalence ranging from 5 to 300 per 100,000 people [1, 2]. Pathologically, MS is defined by dissemination in time and space. MS lesions can involve the white matter and gray matter of the CNS. In the acute phase, MS manifests as perivenous inflammation mediated by T lymphocytes, and secondary demyelination, accompanied by varying degrees of axonal injury; the pathology of progressive MS shows more severe white and gray matter demyelination, axonal loss, meningeal inflammation, and gray matter involvement [3]. Clinical manifestations are heterogeneous and range from motor and sensory deficits to cognitive impairment and chronic pain [4]. MS can present various clinical courses, among which relapsing-remitting MS (RRMS), the most common form, is characterized by periods of relapse followed by partial or complete recovery. Over time, some individuals with RRMS transition to secondary progressive MS, characterized by a steady progression of disability with or without superimposed relapses. In the initial stage of MS, peripheral immune cells cross the blood-brain barrier (BBB) and enter the CNS. The damaged myelin is presented by microglia, and CD8+ T cells and macrophages attack or phagocytose oligodendrocytes and further destroy the myelin. The rim of chronic active lesions contains a band of persistently activated microglia/macrophages, referred to as a “smoldering” lesion, which creates a persistent toxic microenvironment through continual release of low levels of pro-inflammatory factors and reactive oxygen species [5]. This chronic inflammatory environment damages oligodendrocytes in the adjacent white matter and leads to slow lesion expansion. Previous transcriptomic sequencing studies in chronic MS lesions have identified various glial cell subtypes, including immune-associated oligodendrocytes, reactive and cilia-forming astrocytes, and inflammatory microglia [6]. However, their specific mechanistic roles in driving disease progression and the nature of their intercellular interactions remain to be further elucidated.
Microglia, the only glial cells in the CNS originating from the mesodermal yolk sac, colonize the brain parenchyma before the formation of the BBB [7, 8]. Microglia play dominant roles in progressive MS and smoldering lesions. People with MS exhibit microglial cell-autonomous immune activation [9]. Furthermore, in donors with poor remyelination, pro-inflammatory microglia may inhibit the maturation of oligodendrocyte progenitor cells and lead to remyelination failure [10]. However, microglia play complex roles in CNS development, immune surveillance, and repair. For example, CD11c+ microglia promote white matter repair after ischemic stroke by clearing myelin debris and expressing repair-related genes [11]. Moreover, microglial depletion does not decrease myelin phagocytosis [12].
Given the complex patterns of microglial activation, further research on microglia is necessary to refine understanding of MS lesion formation. This study analyzed chronic MS white matter tissue by integrating single-cell sequencing methods. By combining single-cell RNA sequencing and spatial transcriptomics, we delineated the microglial landscape in chronic MS white matter. Our analysis identified six distinct microglial subtypes and highlighted a disease-relevant C2 subtype characterized by enhanced phagocytosis and dysregulated fatty acid metabolism. Furthermore, we identified FOSL2 as a key transcriptional regulator potentially driving C2 differentiation, thereby offering a potential target for modulating microglial states toward repair. Our research provides new insights that may facilitate understanding of the pathological mechanisms of chronic MS progression and clinical treatment.
Methods
Data source
This study used the publicly available single-nucleus RNA sequencing dataset GSE279108 from the GEO database. The dataset comprises 16 tissue samples from human post-mortem brain tissue, including ten samples from the core of chronic white matter lesions of patients with MS and six samples from the subcortical white matter of donors without neurological disease (controls). All samples were obtained from the subcortical/cerebral white matter to ensure neuroanatomical comparability.
Data quality control
In R (v4.2), using Seurat (v4.3), we imported the gene expression matrix and metadata for the GSE279108 dataset. A Seurat object was created with the CreateSeuratObject function. Cells expressing fewer than 300 or more than 10,000 genes were filtered out, and cells with mitochondrial gene content exceeding 20% were also removed. Thresholds were determined according to the distribution of gene counts to exclude low-quality cells and potential doublets. After quality control filtering, the gene expression data were normalized using the NormalizeData function with the ‘LogNormalize’ method. Subsequently, the top 2,000 highly variable genes were identified via the FindVariableFeatures function. The data were then linearly scaled using the ScaleData function to remove unwanted sources of variation. Principal component analysis (PCA) was performed on these variable features, and the Harmony algorithm was applied to the PCA embeddings to mitigate batch effects and technical biases among samples. Based on the elbow plot and cumulative variance explained, the first 30 principal components were selected for downstream analysis. Finally, Uniform Manifold Approximation and Projection (UMAP) visualization was executed using the RunUMAP function.
Cell population annotation
Marker genes for each cluster, compared against all other cells, were identified with the FindAllMarkers function in the Seurat package. The threshold parameters were set as log,fc. threshold = 0.25 and min.pct = 0.25. Only genes with an adjusted P < 0.05 were retained. Cell populations were annotated according to the established literature.
Differential gene screening and enrichment analysis
Differentially expressed genes between the MS and control groups were identified with the FindAllMarkers function in the Seurat package, with thresholds set at absolute log2 fold change >0.25 and P < 0.05. Gene set enrichment analysis was performed on the gene sets with the gseGO and gseKEGG functions from the clusterProfiler package.
AUCell analysis
Gene set activity was quantified with the AUCell algorithm implemented in the scgmt package [13]. This method evaluates enrichment in predefined gene signatures at single-cell resolution by calculating the area under the curve (AUC) for each cell’s gene ranking. For each gene set, cells were ranked by AUC value, and the top 20% across all cells were classified as having high activity for that specific gene set. The 20% threshold was chosen to capture cells with robust pathway activation while avoiding excessive false positives. The resulting activity scores reflected the relative activation strength of specific biological pathways or cellular states across the transcriptomic landscape.
Pseudotime trajectory
The pseudotemporal ordering of microglial cells was established with Monocle (v2.24.0), which enabled reconstruction of their developmental trajectories through single-cell transcriptomic patterns. This approach used continuous pseudotime metrics to delineate critical transitions along the differentiation continuum.
Slingshot
Pseudotemporal progression of microglial subtypes was analyzed with Slingshot (v2.8.0) to reconstruct continuous developmental trajectories that revealed transitional stages during cellular maturation.
Cell-cell communication
We used the CellChat analytical toolkit (v1.6.1) to conduct a systematic analysis of the single-cell transcriptomic dataset. Through a ligand-receptor interaction-mediated cell communication prediction model, integrated with the CellChatDB human reference database, and application of a statistical significance threshold of P < 0.05, we precisely defined the specific intercellular interaction network.
Transcription factor regulatory networks
We applied the single-cell regulatory network inference and clustering (SCENIC) pipeline to decode transcription factor (TF)-driven regulatory programs [14]. Analysis was conducted with default parameters on the raw count matrix from all samples. Co-expression networks were built with the GRNBoost2 algorithm in the Python environment. Regulon activity was then quantified and binarized for each cell with AUCell. Specifically, a regulon was considered active in a given cell if its AUCell score ranked within the top 5% of the score distribution across all cells. Finally, regulon specificity across cell subtypes was quantified with the calcRSS function.
Spatial transcriptomics sequencing analysis
We systematically analyzed tissue spatial architecture with a dataset acquired from the 10× Genomics platform, processed with the Seurat R package (v4.3.0). Gene expression data underwent normalization and variance stabilization with SCTransform followed by principal component analysis. The cellular composition of spatial transcriptomics slides was resolved by integration of single-cell RNA-seq data as a reference framework with comprehensive cell type decomposition. Cell type deconvolution was performed using the Robust Cell Type Decomposition (RCTD) algorithm (v1.2.0) within the ‘full’ mode to estimate the fractional composition of each spatial spot. By leveraging a probabilistic framework that accounts for platform-specific effects, RCTD integrated our annotated single-cell RNA-seq data as a reference to decompose the spatial gene expression profiles into cell-type-specific weights [15, 16].
Results
Single-cell atlas of white matter in MS
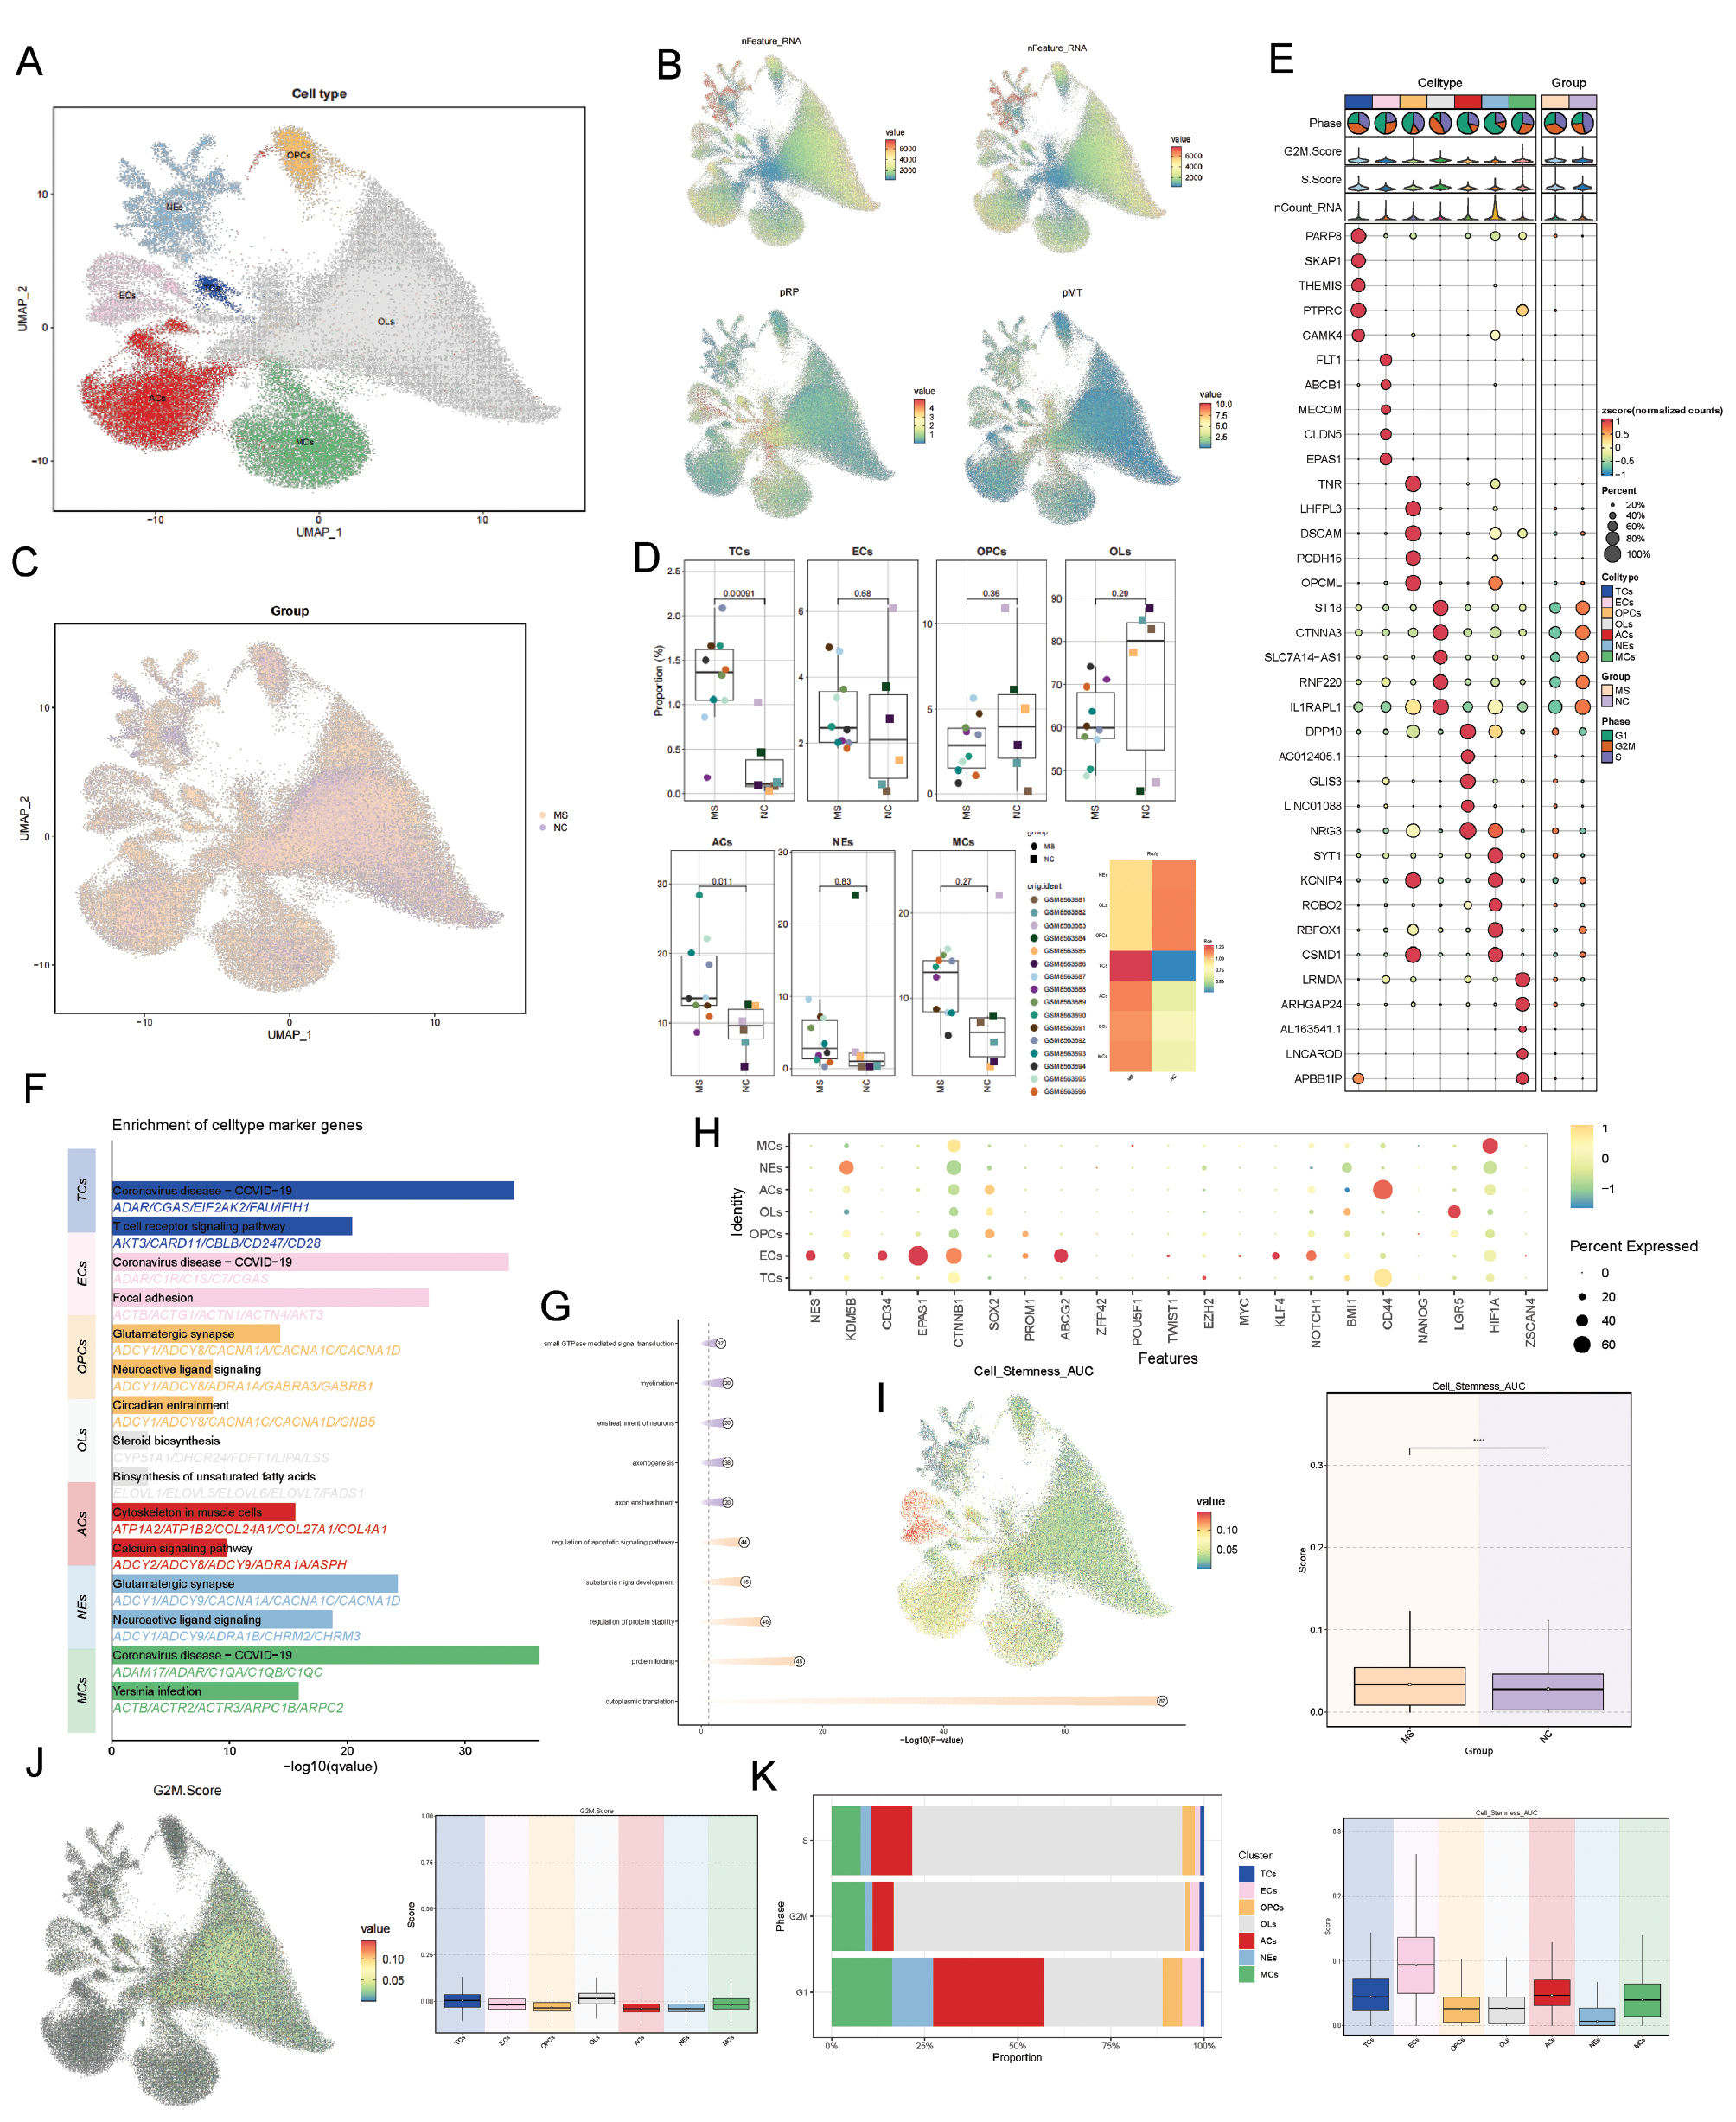
After batch-effect correction across all cells in the dataset, a total of 117,728 high-quality cells were obtained. These cells were classified into seven distinct cell types according to established marker genes: neurons (NEs), endothelial cells (ECs), astrocytes (ACs), macrophage/microglial cells (MCs), oligodendrocytes (OLs), and oligodendrocyte precursor cells. Figure 1B displays the nFeature RNA, nCount RNA, pMT, and pRP scores for each cell type. NEs exhibited relatively high nCount RNA and nFeature RNA values. The distribution of cells from the disease and control groups is shown in Figure 1C. Analysis of the proportional composition of each cell type revealed that the disease group showed a greater proportion of TCs, ACs, ECs, and MCs than the control group (Figure 1D,E), in agreement with the inflammatory disease characteristics of MS. Figure 1E presents the top five differentially expressed genes highly expressed in each cell population. We further performed enrichment analysis on the differentially expressed genes from the different cell types (Figure 1F). NEs and OLs were enriched in normal physiological functions, whereas MCs, ECs, and TCs showed enrichment in immune response functions. Moreover, differentially expressed genes in the control group were enriched in normal physiological functions, whereas the MS group exhibited enrichment in activities suggesting potential involvement in immune responses (Figure 1G). We further analyzed the characteristics of each cell type from various perspectives. Analysis of stemness-related gene expression across cell subpopulations revealed that stemness genes such as EPAS1, ABCG2, and CD34 showed elevated expression in endothelial cells. Concurrently, cells from the MS group also demonstrated elevated stemness AUCell scores (Figure 1H,I). Finally, we analyzed the cell cycle phase distribution across cell types. Cells in S and G2/M phases were derived primarily from OLs, whereas cells in G1 phase were derived predominantly from ACs (Figure 1J,K).
Figure 1 Single-cell landscape of major cell types. (A) All high-quality cells were dimensionally reduced and clustered into UMAP plots. (B) Differences in nCount RNA, nFeature RNA, pRP, and pMT across cells, displayed in UMAP. (C) UMAP visualization of cellular distribution in the NC and MS groups. (D) Sample proportion across cell clusters. (E) Top five marker genes of all cells and the differentially expressed genes between groups. (F,G) Functional enrichment analysis of cell clusters and experimental groups. (H) Bubble plot displaying expression of differentially expressed stemness-related genes. (I) UMAP and boxplots showing differences in stemness scores across cell clusters and two groups. (J) UMAP and boxplots highlighting expression differences in G2/M scores across all cell clusters. (K) Distribution of cell cycle phases across cell clusters.
Oligodendrocyte clustering and functional annotation
Because demyelination is a primary pathological manifestation of MS, we focused further analysis on oligodendrocytes. Through dimensionality reduction and clustering, we identified three distinct subpopulations (Figure 2A). The top five differentially expressed genes for each subpopulation are shown in Figure 2B and C displays word clouds from the enrichment analysis of differentially expressed genes for each subpopulation. To visualize the sample origins of the subtypes, we calculated the ratio of observed to expected cell numbers for each subpopulation within each group. The Ro/e heatmap clearly revealed the group preferences of different subpopulations (Figure 2G). Specifically, whereas the C1 and C3 subpopulations were more enriched in the disease group, the C2 oligodendrocytes showed a higher relative proportion in the control group. Therefore, we reasoned that the C1 and C3 subpopulations might be closely associated with the disease’s pathological processes, whereas the C2 oligodendrocytes might represent the oligodendrocyte population predominant in healthy states. Furthermore, we mapped the overall distribution of oligodendrocytes and the distribution of each subpopulation via spatial transcriptomics. Because myelination is the primary function of oligodendrocytes in the white matter, we scored the myelination function pathways for each subpopulation. C2 oligodendrocytes had the highest score (Figure 2H–K) and therefore might serve as primary target cells during MS disease progression.
Figure 2 Oligodendrocyte subtype characterization. (A) Distribution of oligodendrocyte subtypes on UMAP. (B) Differentially expressed genes in oligodendrocyte subtypes. (C) Word clouds highlighting terms strongly associated with each of the three oligodendrocyte subtypes. (D) ST maps visualizing oligodendrocytes. (E) ST maps indicating the most likely cell types at selected points within tissue sections. (F) UMAP projection showing the distribution of cells from the MS and NC groups. (G) Enrichment in oligodendrocyte subtypes across the NC and MS groups. (H) Activity of myelination-related pathways across oligodendrocyte subtypes. (I–K) UMAP and box plot visualizations depicting differences in axon-related pathway activity across subtypes. (M,N) UMAP plots showing differences in ether lipid metabolism and biosynthesis of unsaturated fatty acids across subtypes. Boxplots compare these two metabolic pathways across subtypes, cell cycle phases, and sample groups.
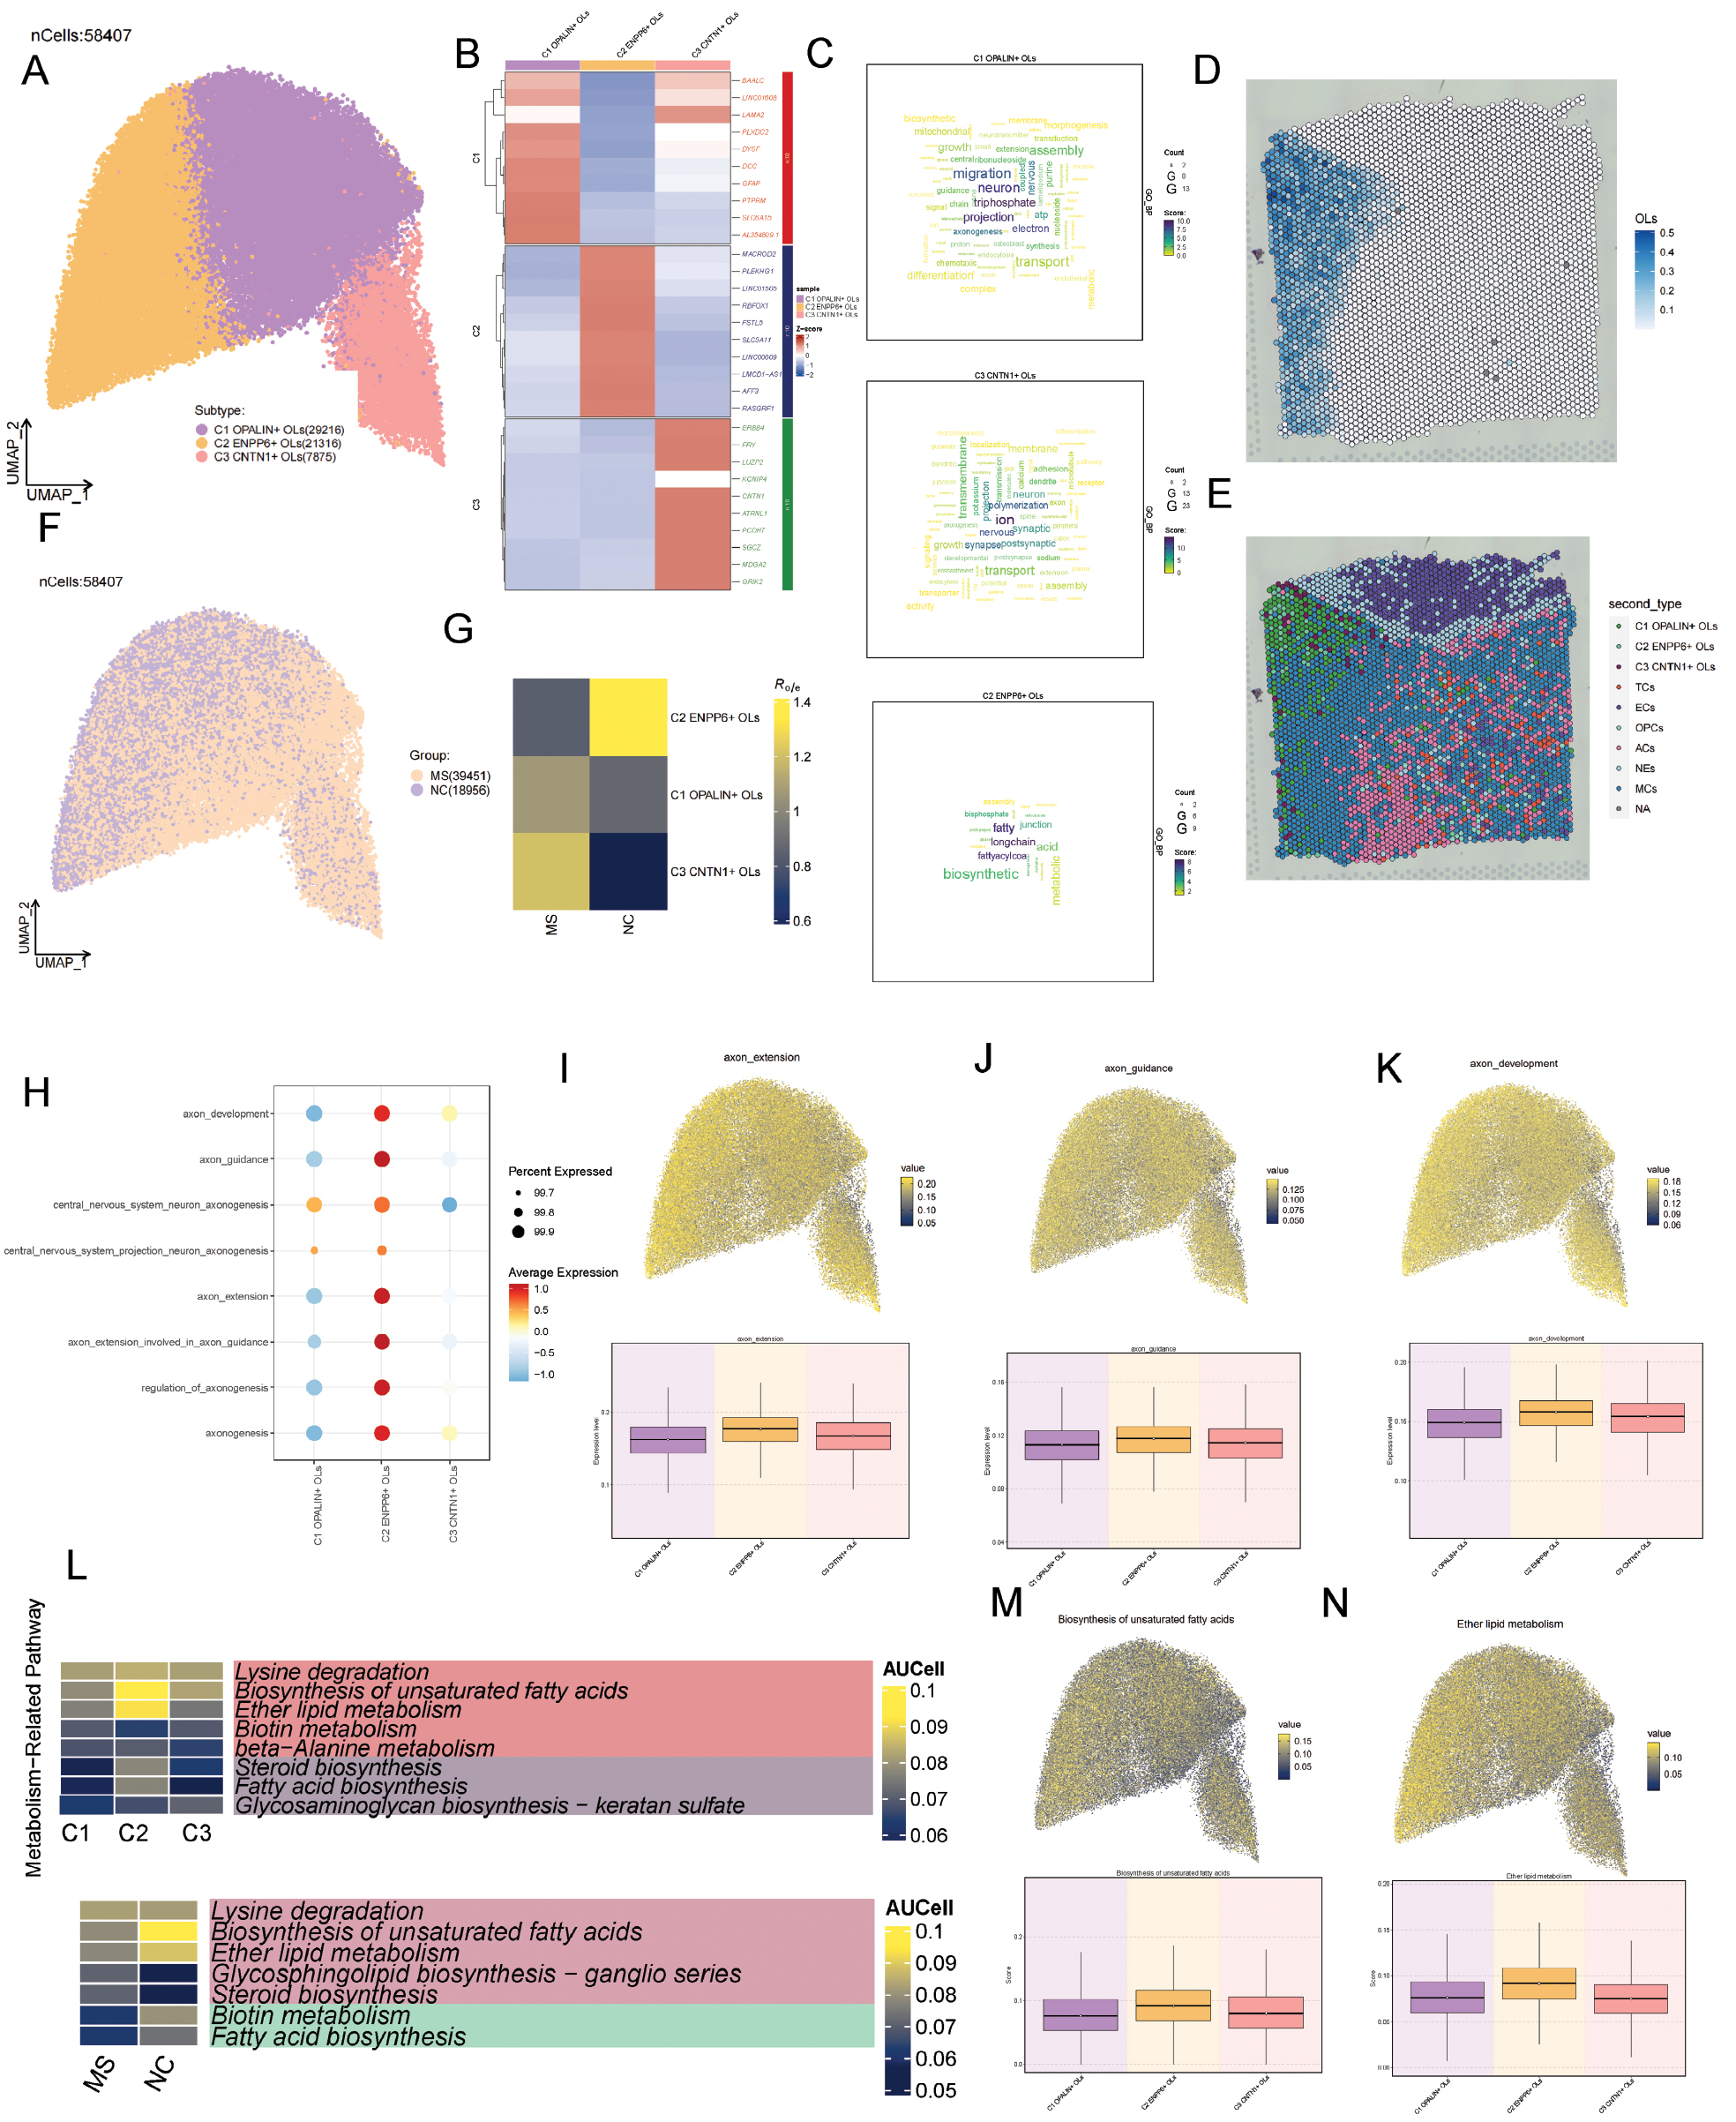
Finally, analysis of metabolic pathways associated with oligodendrocytes (Figure 2L–N) indicated that the C2 oligodendrocyte subtype and the NC group were enriched in the pathways of ether lipid metabolism and biosynthesis of unsaturated fatty acids.
Microglial functional heterogeneity
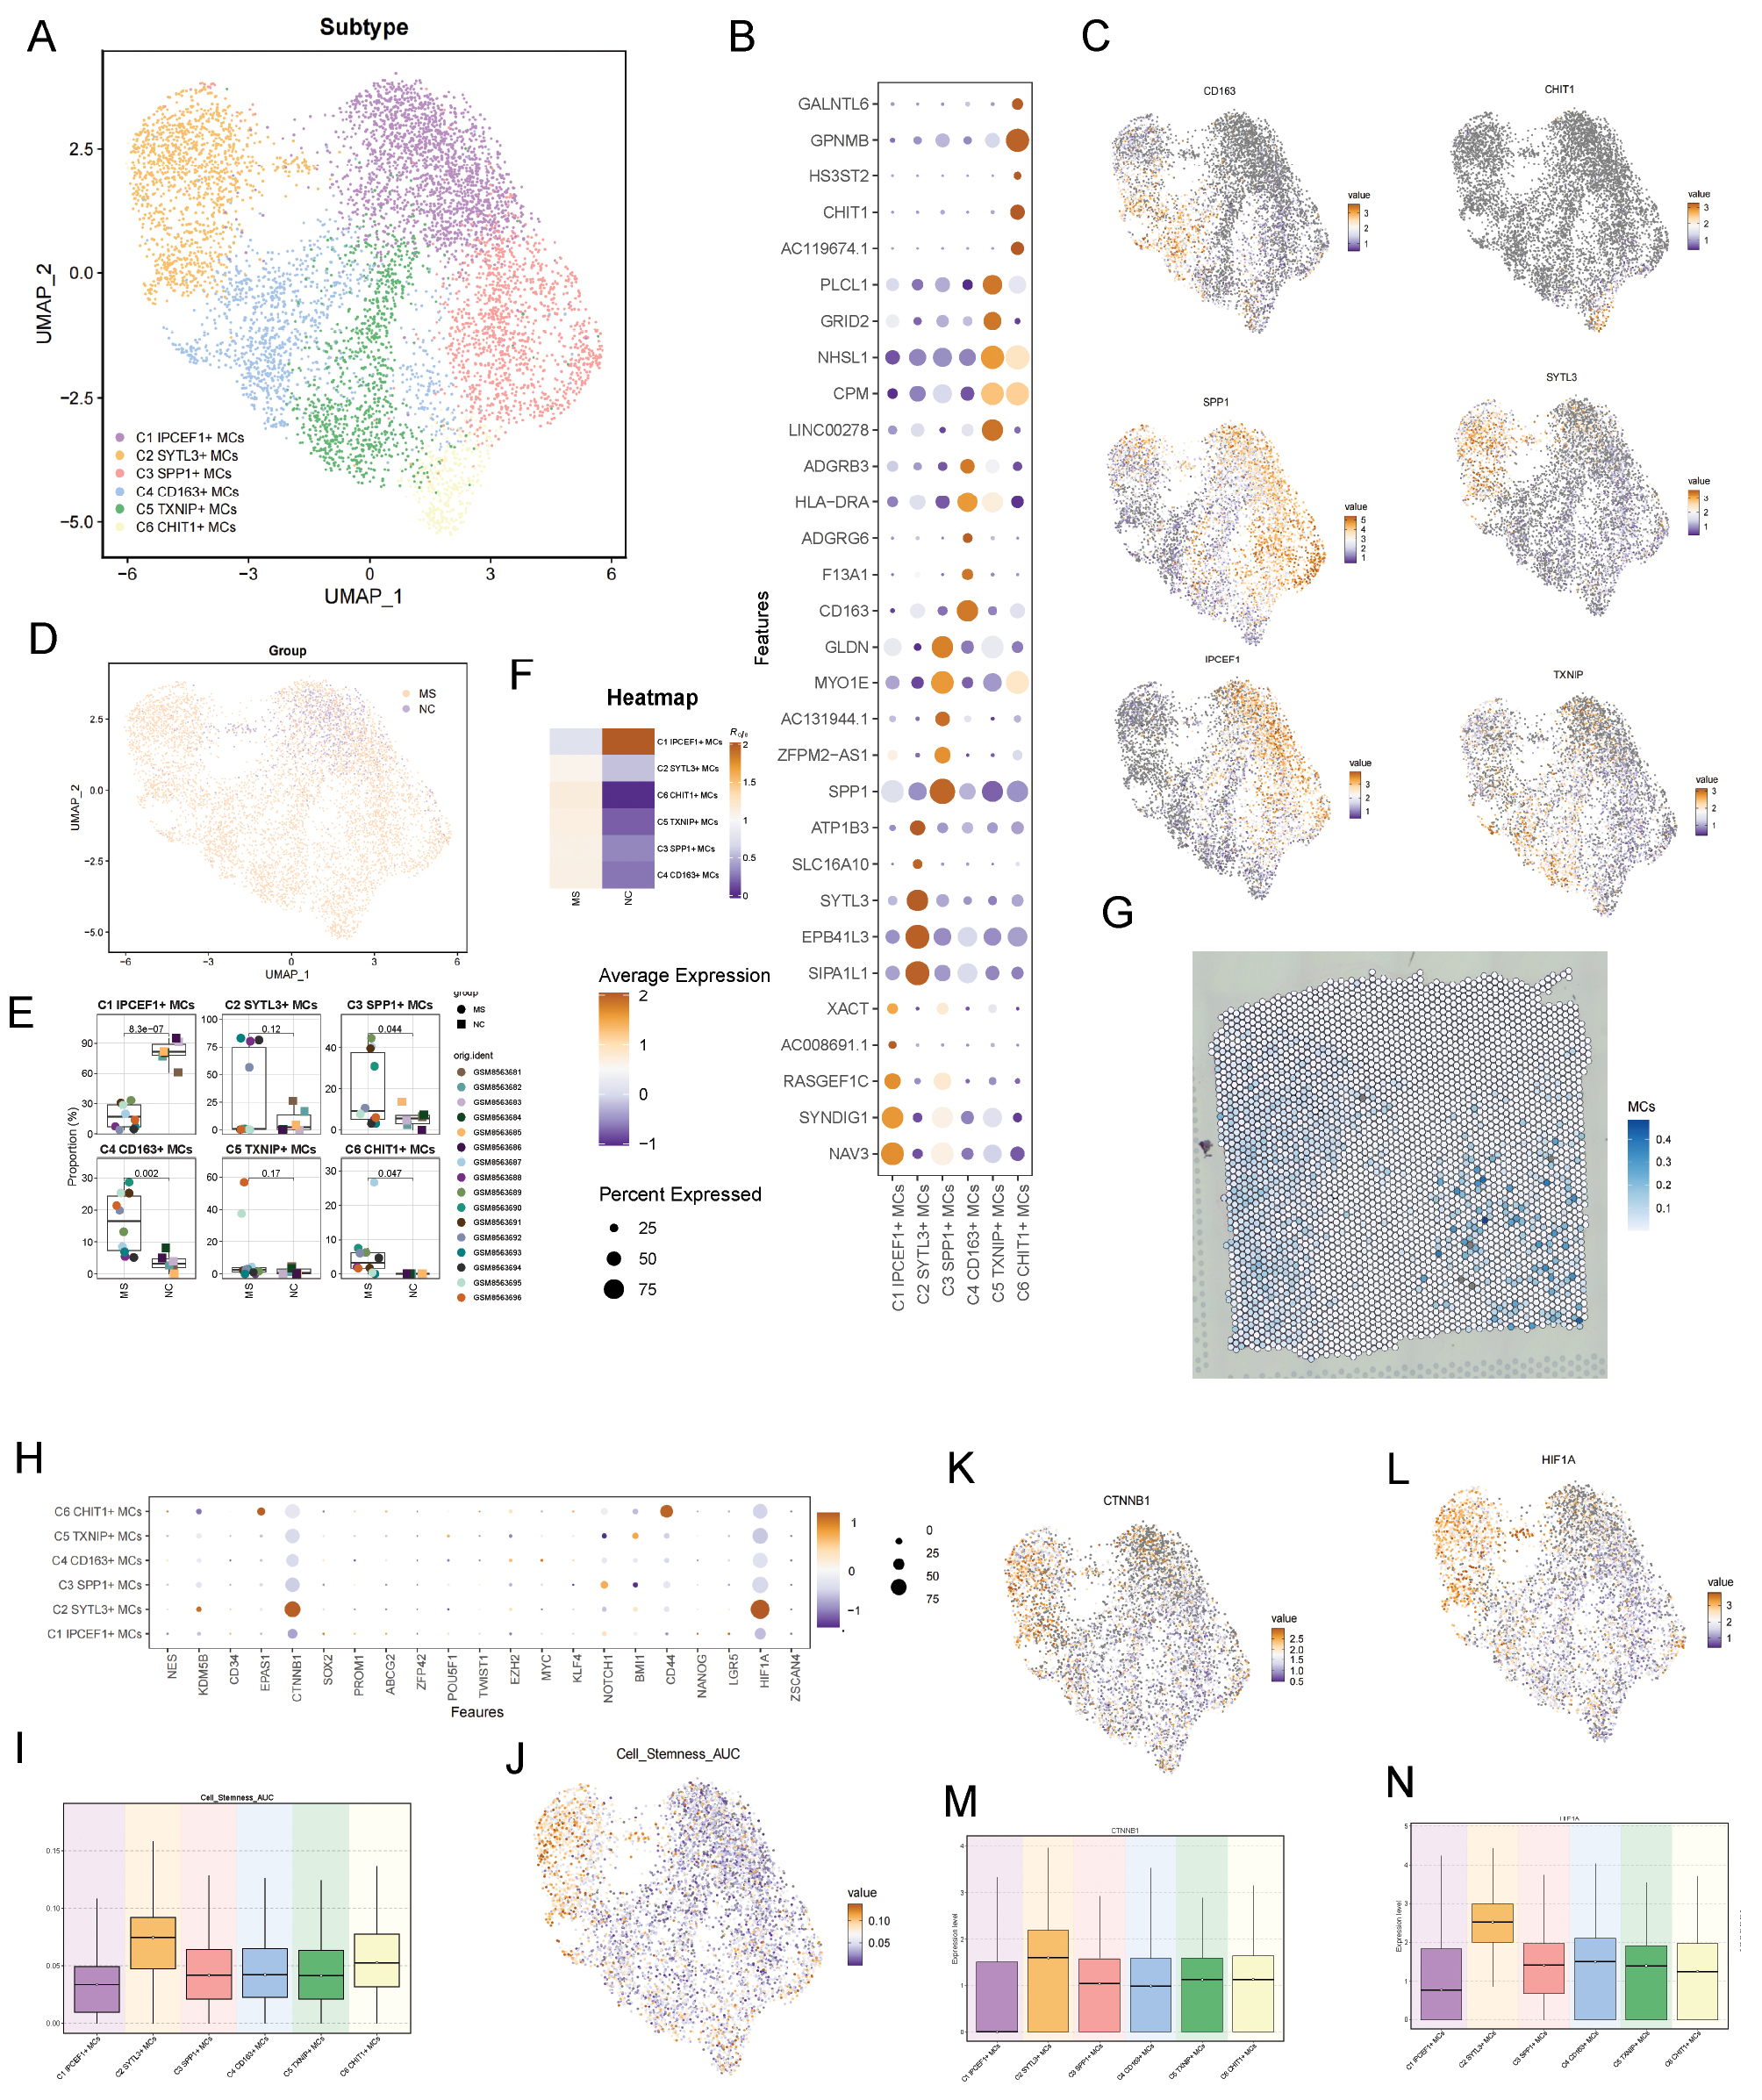
We further analyzed macrophages/microglia. To refine our analysis, we excluded peripheral macrophages and focused on the functions of microglia. Six subtypes were identified (Figure 3A). Figure 3B shows the top five marker genes for each microglial subtype. The distribution of key genes for each subtype was visualized via UMAP. Analysis of the sample origins of each microglial subtype indicated that, except for C1, the other five microglial subtypes were enriched predominantly in the MS group (Figure 3E,F). Finally, a comparison of the expression of stemness-related genes across subtypes (Figure 3H–J) revealed elevated expression of CTNNB1 and HIF1A in the C2 microglial subtype (Figure 3K–N). The stemness score of the C2 microglial subtype was higher than that of the other subtypes.
Figure 3 Microglial subtype identification. (A) Microglia were classified into six subtypes with distinct characteristics according to marker genes. (B) Dot plot of the top five marker genes. (C) UMAP visualization of key genes for microglial subtypes. (D) Distribution of microglial subtypes between groups, shown with UMAP plots. (E) Sample composition of microglial subtypes. (F) Distribution of microglial subtypes between groups, shown with UMAP plots. (G) ST maps visualizing MCs. (H) Bubble plot showing expression of differentially expressed stemness-related genes across microglial subtypes. (I,J) Stemness of microglial subtypes, visualized with UMAP plots. Boxplot illustrates differences in stemness scores among subtypes. (K–N) UMAP and boxplots highlighting expression differences in stemness-related genes, including CTNNB1 and HIF1A across microglial subtypes.
We next analyzed the differentially expressed genes (Figure 4A) and their functional enrichment in each mocroglial subtype (Figure 4B–C). The C1 subtype is responsible for actively pruning, organizing, and maintaining neuronal connections, and supports and promotes oligodendrocyte development and myelination function through secreted factors or direct contact. This subtype is situated in a microenvironment that actively supports myelin regeneration. The existence of this subtype suggests either normal tissue function of microglia or an active phase of repair and remodeling during the MS disease process. The C2 microglial subtype exhibits upregulated pro-inflammatory responses and phagocytic function. The high expression of C5AR1, encoding a key receptor in the complement system, indicated that microglia are highly sensitive to complement activation product C5a, which drives chemotaxis and inflammation [17]. Upregulation of MSR1 endows microglia with a robust ability to phagocytose myelin debris. The C3 subtype has lipid metabolism and phagocytosis functions. High expression of LPL, a key regulator of lipid metabolism, in microglia within chronic MS lesions suggests active uptake of lipids from damaged myelin debris or the surrounding environment [18]. PPARG, a core regulator of lipid metabolism and inflammation, promotes lipid uptake (e.g., via CD36) and storage, and directs microglia toward an anti-inflammatory, reparative phenotype [19]. C4 cells exhibit antigen-presenting ability and enrichment in the MHC II pathway, but their concurrent high expression of CD163 suggests anti-inflammatory and anti-oxidative repair roles [20]. C5 might be involved in regulating neuronal signaling and might potentially respond to neuronal inhibitory signals, thus participating in regulating synaptic plasticity and maintaining postsynaptic membrane stability. Furthermore, C5 might participate in constructing and modifying the neuron and glial cell microenvironment by synthesizing extracellular matrix components, thereby influencing repair and regeneration. The C6 type involves lipid metabolism, clearance of myelin debris, and tissue repair, and exhibits marked susceptibility to ferroptosis. LGMN is an important lysosomal cysteine protease responsible for degrading phagocytosed myelin debris [21]. Simultaneously, genes such as FTL and SAT1 reflect this subtype’s phagocytosis of large amounts of iron-rich myelin, thus leading to iron accumulation and lipid peroxidation [22].
Figure 4 Functional heterogeneity of microglial subtypes. (A) Differentially expressed genes in microglial subtypes. (B,C) Functional enrichment analysis of microglial subtypes. (D–H. Expression levels of macrophage phagocytosis, pro-inflammatory, anti-inflammatory, M1, and M2 signatures in microglial subtypes. (I) Heatmap of metabolic pathway alterations across microglial subtypes. (J) Heterogeneity of the fatty acid biosynthesis pathway across microglial subtypes.
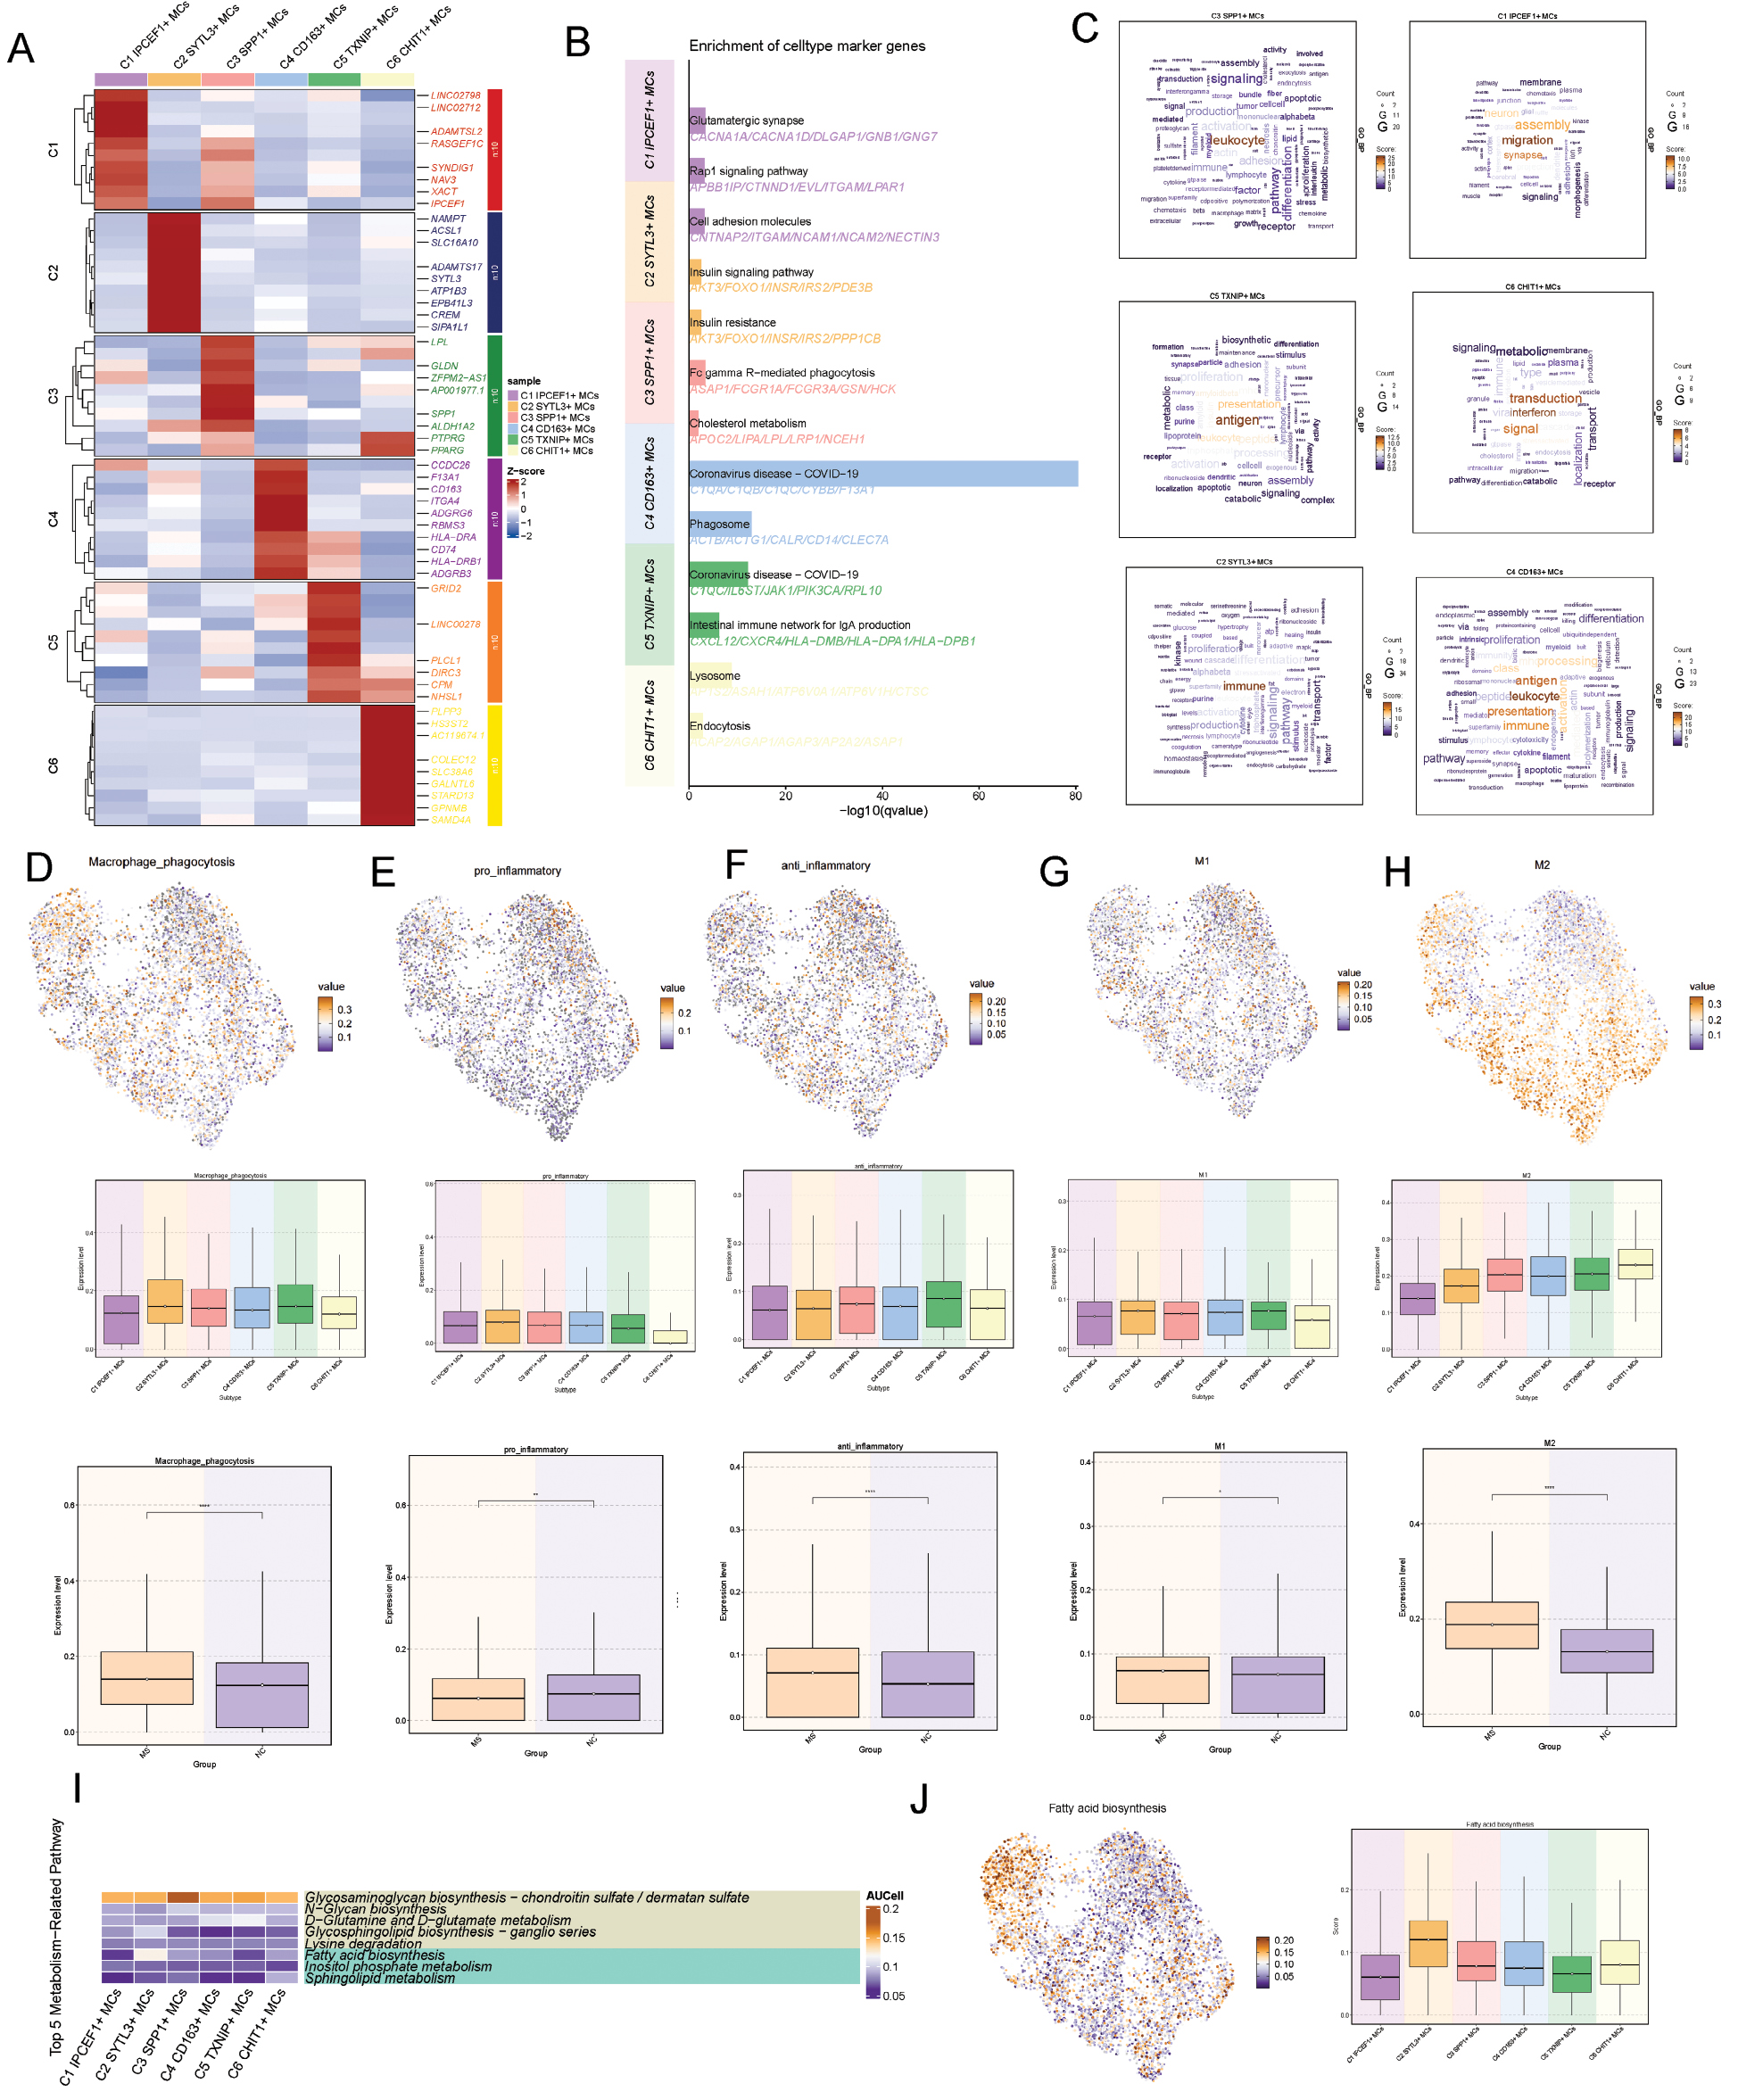
We performed AUC scoring on the anti-inflammatory and pro-inflammatory related pathways of each microglial subtype (Figure 4E,F). The C2 microglial subtype had the highest pro-inflammatory activity and relatively low anti-inflammatory activity, whereas the C5 subtype had relatively low anti-inflammatory activity. Furthermore, we scored the expression of M1/M2 phenotype-related genes in the microglial subtypes (Figure 4G,H). The C2 microglial subtype was characterized by a high M1 score and a low M2 score, thus suggesting high pro-inflammatory function, which might be associated with disease progression. Concurrently, the C6 subtype was characterized by a high M2 score and low M1 score, and therefore might be associated with inflammation suppression and tissue repair. Additionally, the C3, C4, and C5 subtypes all had relatively high M1/M2 scores suggesting a potential trend of transitioning from the M1 to the M2 phenotype. Therefore, these cellular subtypes might be in an intermediate state between disease progression and repair. Finally, according to the metabolic pathway scoring of microglia, the enrichment of the C2 microglial subtype in the fatty acid metabolism pathway might explain the correlation between its pro-inflammatory function and myelin phagocytosis (Figure 4I,J).
Pseudotime trajectory analysis of microglia
Assessment of microglial differentiation states via CytoTRACE revealed a distinct spectrum of pseudotemporal ordering among the subtypes (Figure 5A–C). The C3 subtype displayed the most primitive state, contrasting with the highly differentiated C2 microglial subtype. Genes showing significant positive associations with this differentiation continuum included PLXOC2, EPB41L2, ST6GAL1, DOCK8, DISC1, APBB1IP, MGAT4A, ARHGAP24, LRMDA, and GNAQ (Figure 5D).
Figure 5 Pseudotime trajectory of microglial subtypes. (A–C) CytoTRACE analysis revealing activation levels of the six microglial subtypes. (D) Genes positively and negatively correlated with CytoTRACE. (E) Pseudotime trajectory, progressing from left to right, showing the distribution of the six microglial subtypes along the trajectory. (F) Heatmap of temporal expression patterns of differentially expressed genes across subtypes along the pseudotime trajectory. (G) Slingshot analysis construction of two trajectories: lineage 1 and lineage 2. (H) Expression of the key genes, displayed along both trajectories.
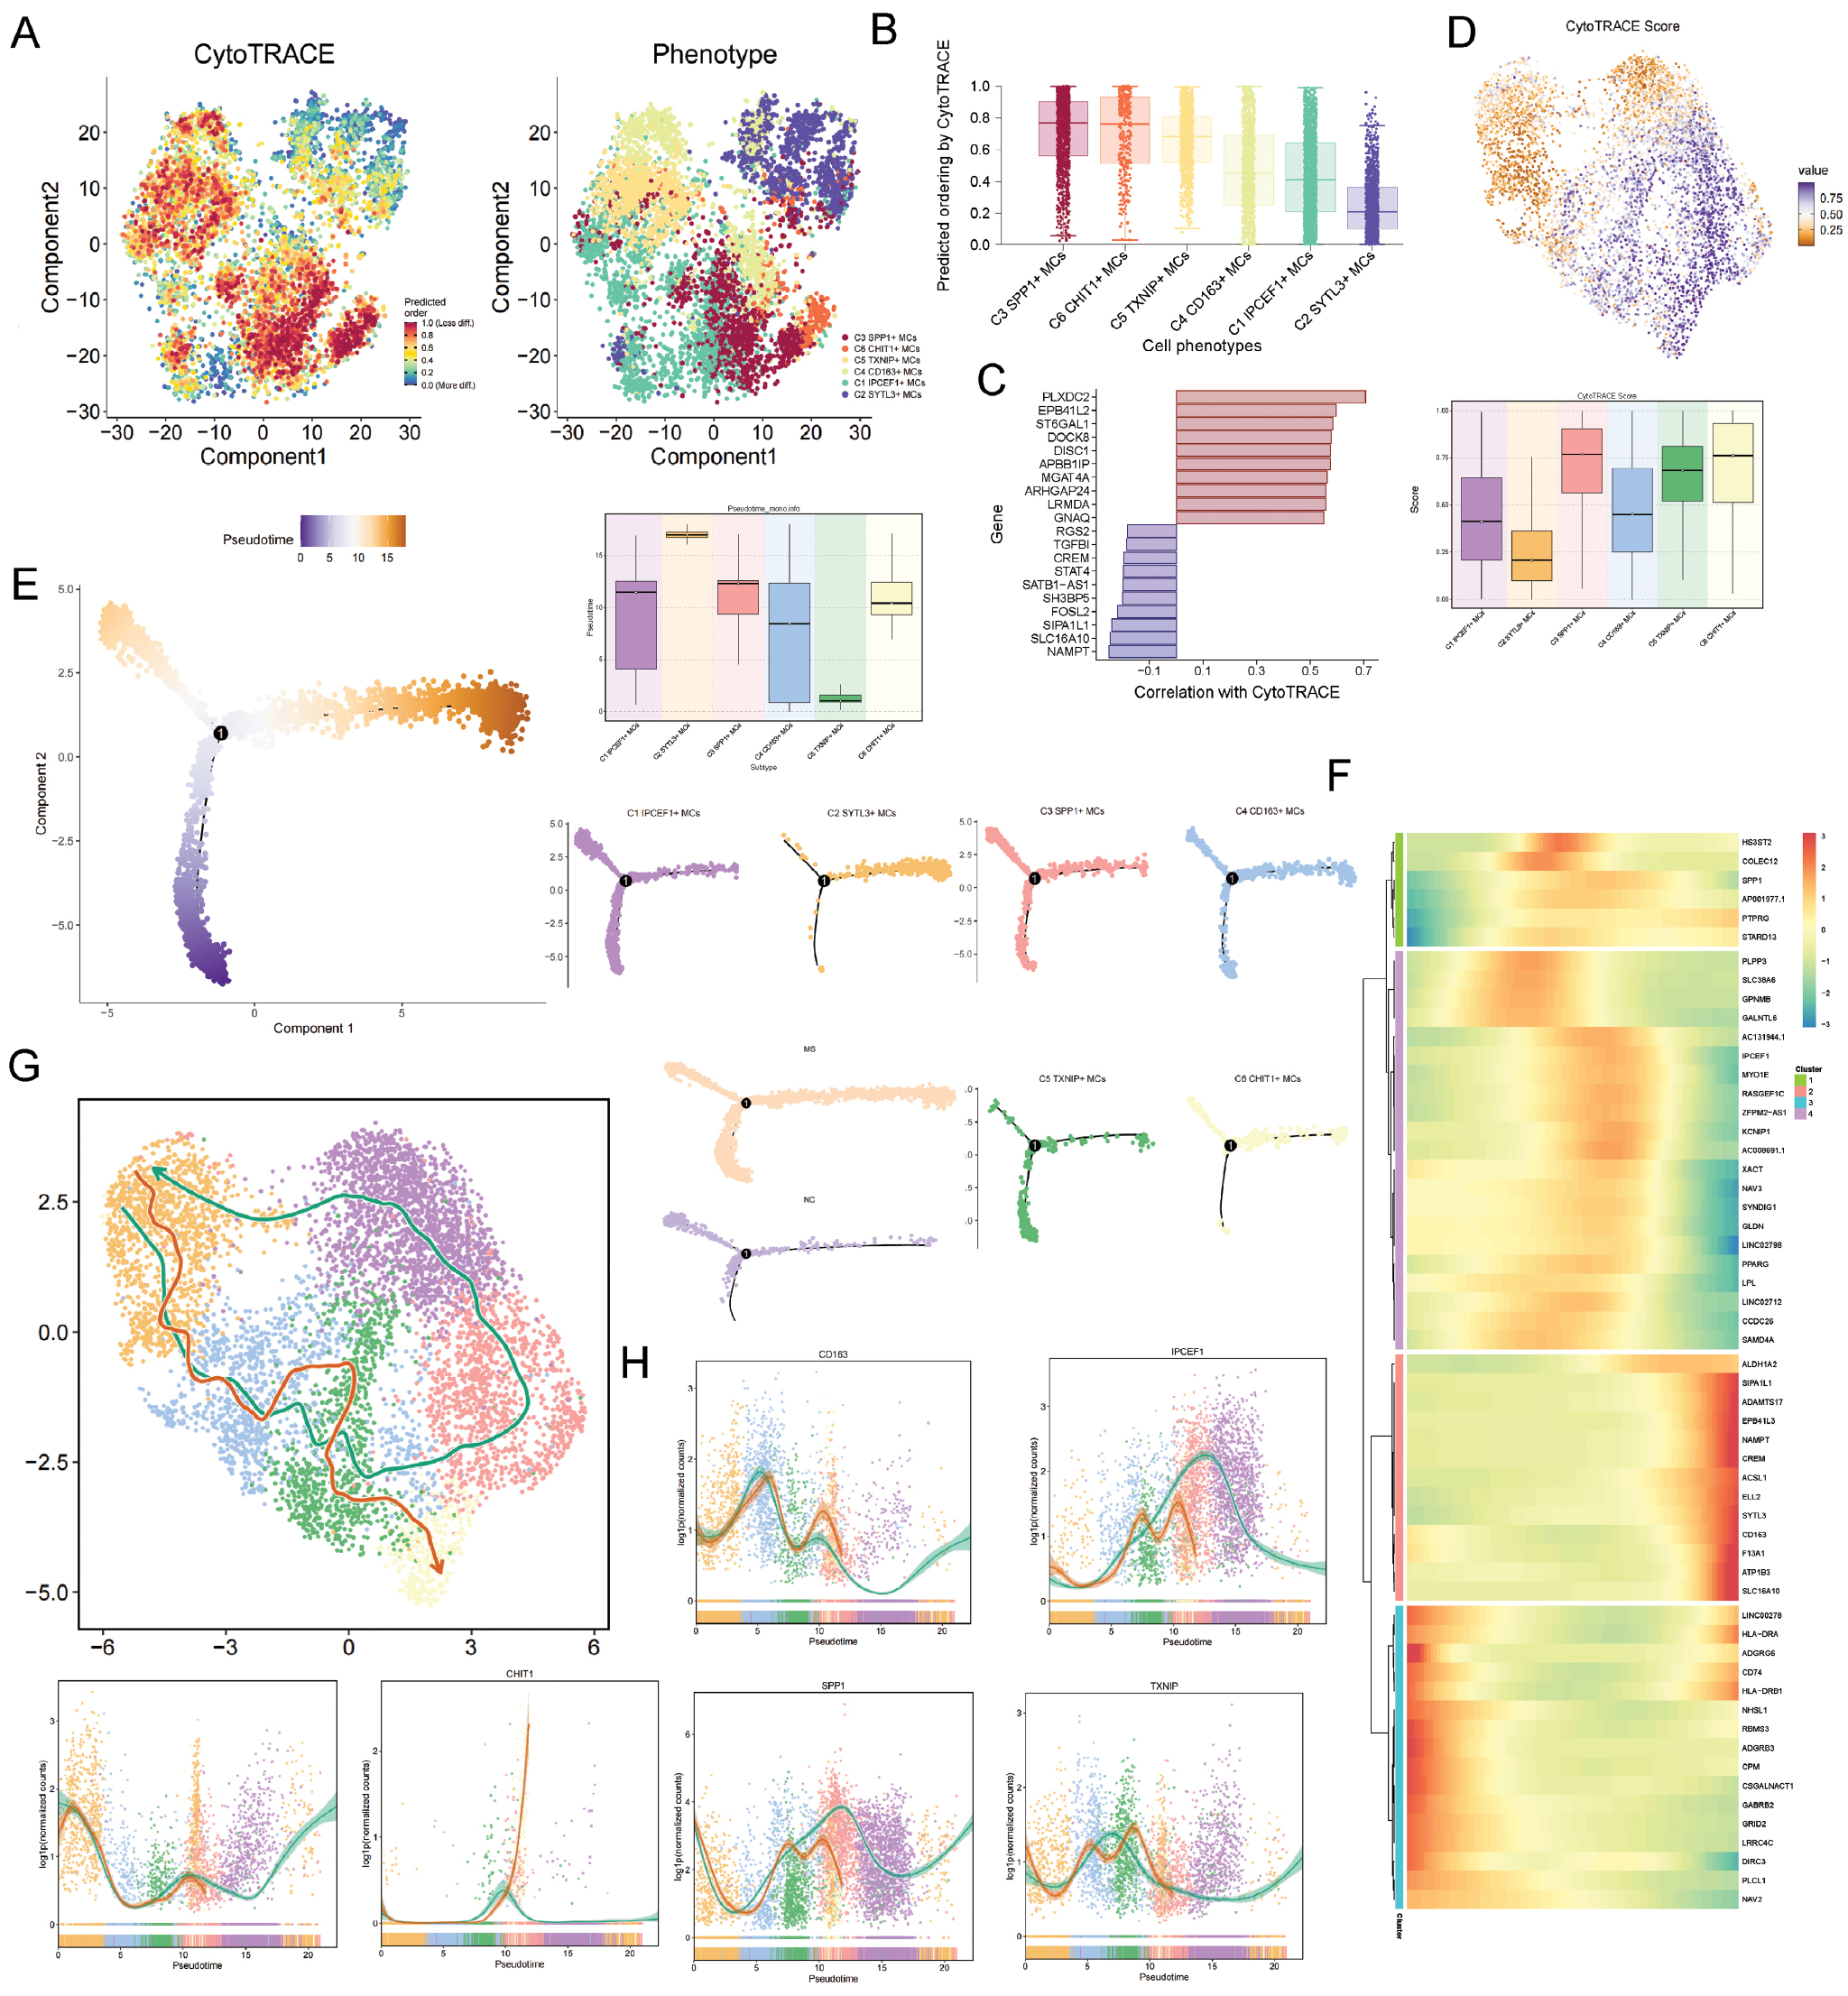
Using Monocle, we reconstructed a pseudotemporal trajectory featuring a single branch point, with progression oriented from left to right. Projection of microglial subtypes onto this trajectory revealed predominant localization of the C2 microglial subtype along the right branch (Figure 5E). Dynamic expression patterns of genes ordered by pseudotime are displayed in the accompanying heatmap (Figure 5F).
We reconstructed the cellular dynamics with Slingshot, which inferred two bifurcating trajectories of state transition (lineage 1 and LINEAGE 2; Figure 5G). Pseudotemporal ordering defined the progression as C2→C4→C5→C6 in lineage 1 and C2→C4→C5→C3→C1 in lineage 2. Notably, the marker gene SYTL3, associated with the C2 microglial subtype, exhibited sustained high expression during the initial phase of both lineages (Figure 5H).
Visualization of cell-cell communication networks
We first analyzed the cell communication between microglial subpopulations and oligodendrocyte subpopulations. Figure 6A displays the strength and number of interactions between microglial subpopulations and oligodendrocyte subpopulations. Figure 6B specifically shows the expression intensity of intercellular signaling pathways between various microglial and oligodendrocyte cells. We identified high expression of VISFATIN between microglial C2 and oligodendrocyte C2 microglial subtypes operating in both autocrine and paracrine modes. C2 microglia were the primary signal sender, and C2 oligodendrocytes were the major receiver (Figure 6C,D). Furthermore, within the VISFATIN pathway, we discovered high expression of the NAMPT-INSR ligand-receptor pair between microglial and oligodendrocyte cells (Figure 6E,F), which might be associated with myelin phagocytosis during disease progression.
Figure 6 Intercellular communication network. (A) Circular plots illustrating the number and strength of interactions between all oligodendrocyte subtypes and all microglial types. (B) Heatmap showing incoming communication patterns of target cells and outgoing communication patterns of secreting cells, respectively. (C,D) Paracrine and autocrine interactions between oligodendrocytes and microglia in the VISFATIN signaling pathway and centrality scores of the network. (E) Dot plot of ligand-receptor pair expression in the VISFATIN signaling pathway across cell types. (F) Interactions among all cells in the MDK-SDC1 pathway. (G) Circular plots illustrating the number and strength of interactions between all microglial subtypes and other cell types. (H) Heatmap of incoming and outgoing communication patterns between microglial subtypes and other cell types. (I,J) Paracrine and autocrine interactions in the MHC-I signaling pathway across all cell types and centrality scores of the MHC-I signaling network. (K) Dot plot of MHC-I signaling ligand-receptor pair expression across cell types. (L) Interactions among all cells in the MDK-SDC1 pathway. (M) ST maps visualizing C2 SYTL3 + MCs and TCs.
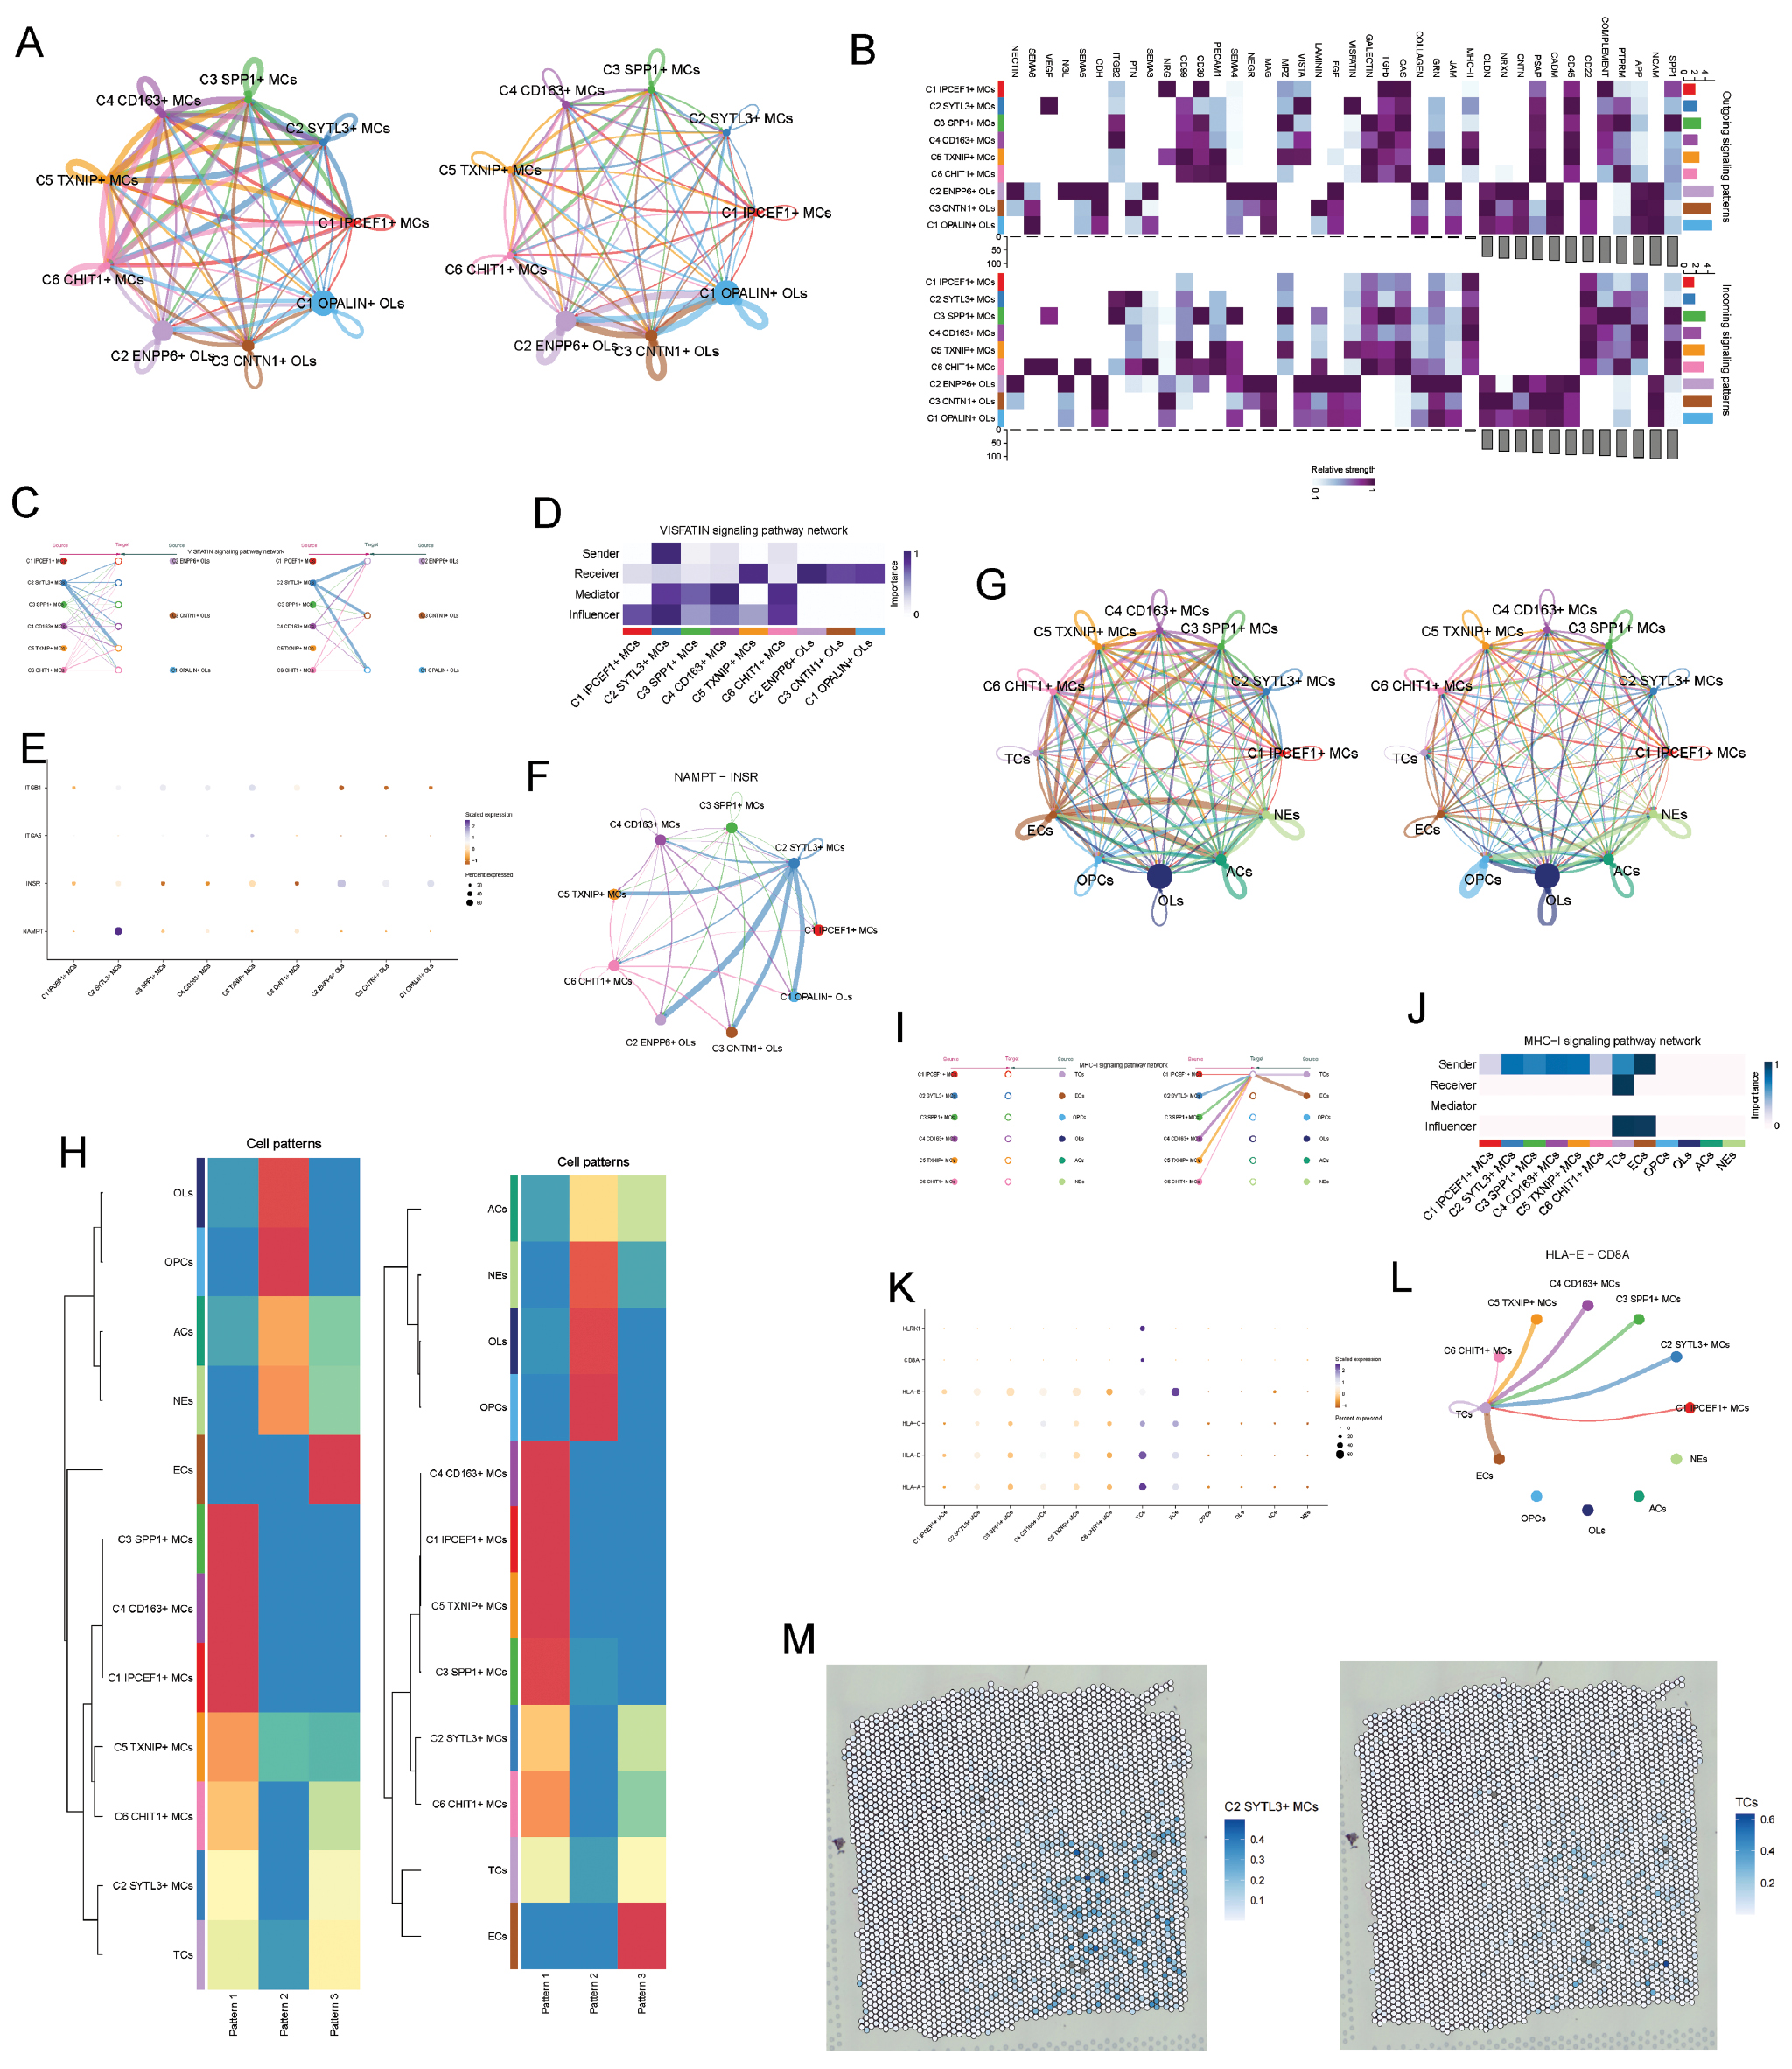
Additionally, we analyzed the intercellular interactions between microglial subpopulations and other subpopulations (Figure 6G). Subsequently, we compared the incoming and outgoing communication patterns across all cellular subtypes (Figure 6H). Notably, the similar incoming interaction patterns between the C2 microglial subtype and T cells suggested a specific role in disease progression. A hierarchical diagram of autocrine and paracrine interactions within the MHC-I pathway (Figure 6I) identified the C2 microglial subtype as a critical signal transmitter, with T cells as the main target. Centrality scoring further established its primary function as a signal sender (Figure 6J). In the search for additional critical receptor proteins, we used bubble plots to map specific interaction patterns between the C2 subtype and other cell populations (Figure 6K). This analysis revealed the HLA-E-CD8A pathway as the most prominent interaction and enabled comprehensive mapping of all cellular engagements within this pathway. Circular visualization further underscored the HLA-E-CD8A pathway’s role as a crucial communication channel between the C2 subtype and T cells (Figure 6L). Moreover, spatial transcriptomics confirmed the co-localization of C2 microglial and T cells (Figure 6M).
Transcriptional regulon activity in microglia
To delineate the TF heterogeneity across different subtypes, we visualized their transcriptional regulatory landscapes. A regulon is defined as a TF together with its directly bound target genes. The activity of each regulon was evaluated in individual cells with the AUCell algorithm. First, we presented a heatmap displaying the top five TFs for each subtype (Figure 7A) and ranked the regulatory factors according to the regulon specificity score (Figure 7B). Concurrently, we mapped the distribution of FOSL2, the highest-regulated factor in the C2 microglial subtype, onto the UMAP projection. UMAP plots demonstrated that FOSL2 was highly expressed in the C2 microglial subtype (Figure 7E), and boxplots provided a direct comparative visualization (Figure 7F).
Figure 7 Transcriptional regulatory landscape of microglial subtypes. (A) Heatmap of differential expression of the top five transcription factors (TFs) across all microglial subtypes. (B) Ranking of regulatory factors in microglial subtypes by regulatory score (RSS). (C) Heatmap displaying the top five differentially expressed transcription factors (TFs) in microglia from the MS and NC groups. (D) Ranking of regulatory factors in the MS and NC groups. (E) UMAP plots illustrating the expression intensity of FOSL2 across various subtypes. (F) Boxplots comparing FOSL2 expression across microglial subtypes. (G) Heatmap of co-transcriptional signatures across microglial subtypes in the NC and MS groups. (H) Heatmap illustrating the similarity of regulatory submodules according to SCENIC recognition modules and AUCell scores. (I,J) Ranking of microglial subtype and sample group content within the M1 and M2 modules. (K) Ranking of TF expression intensity in the M1 and M2 modules.
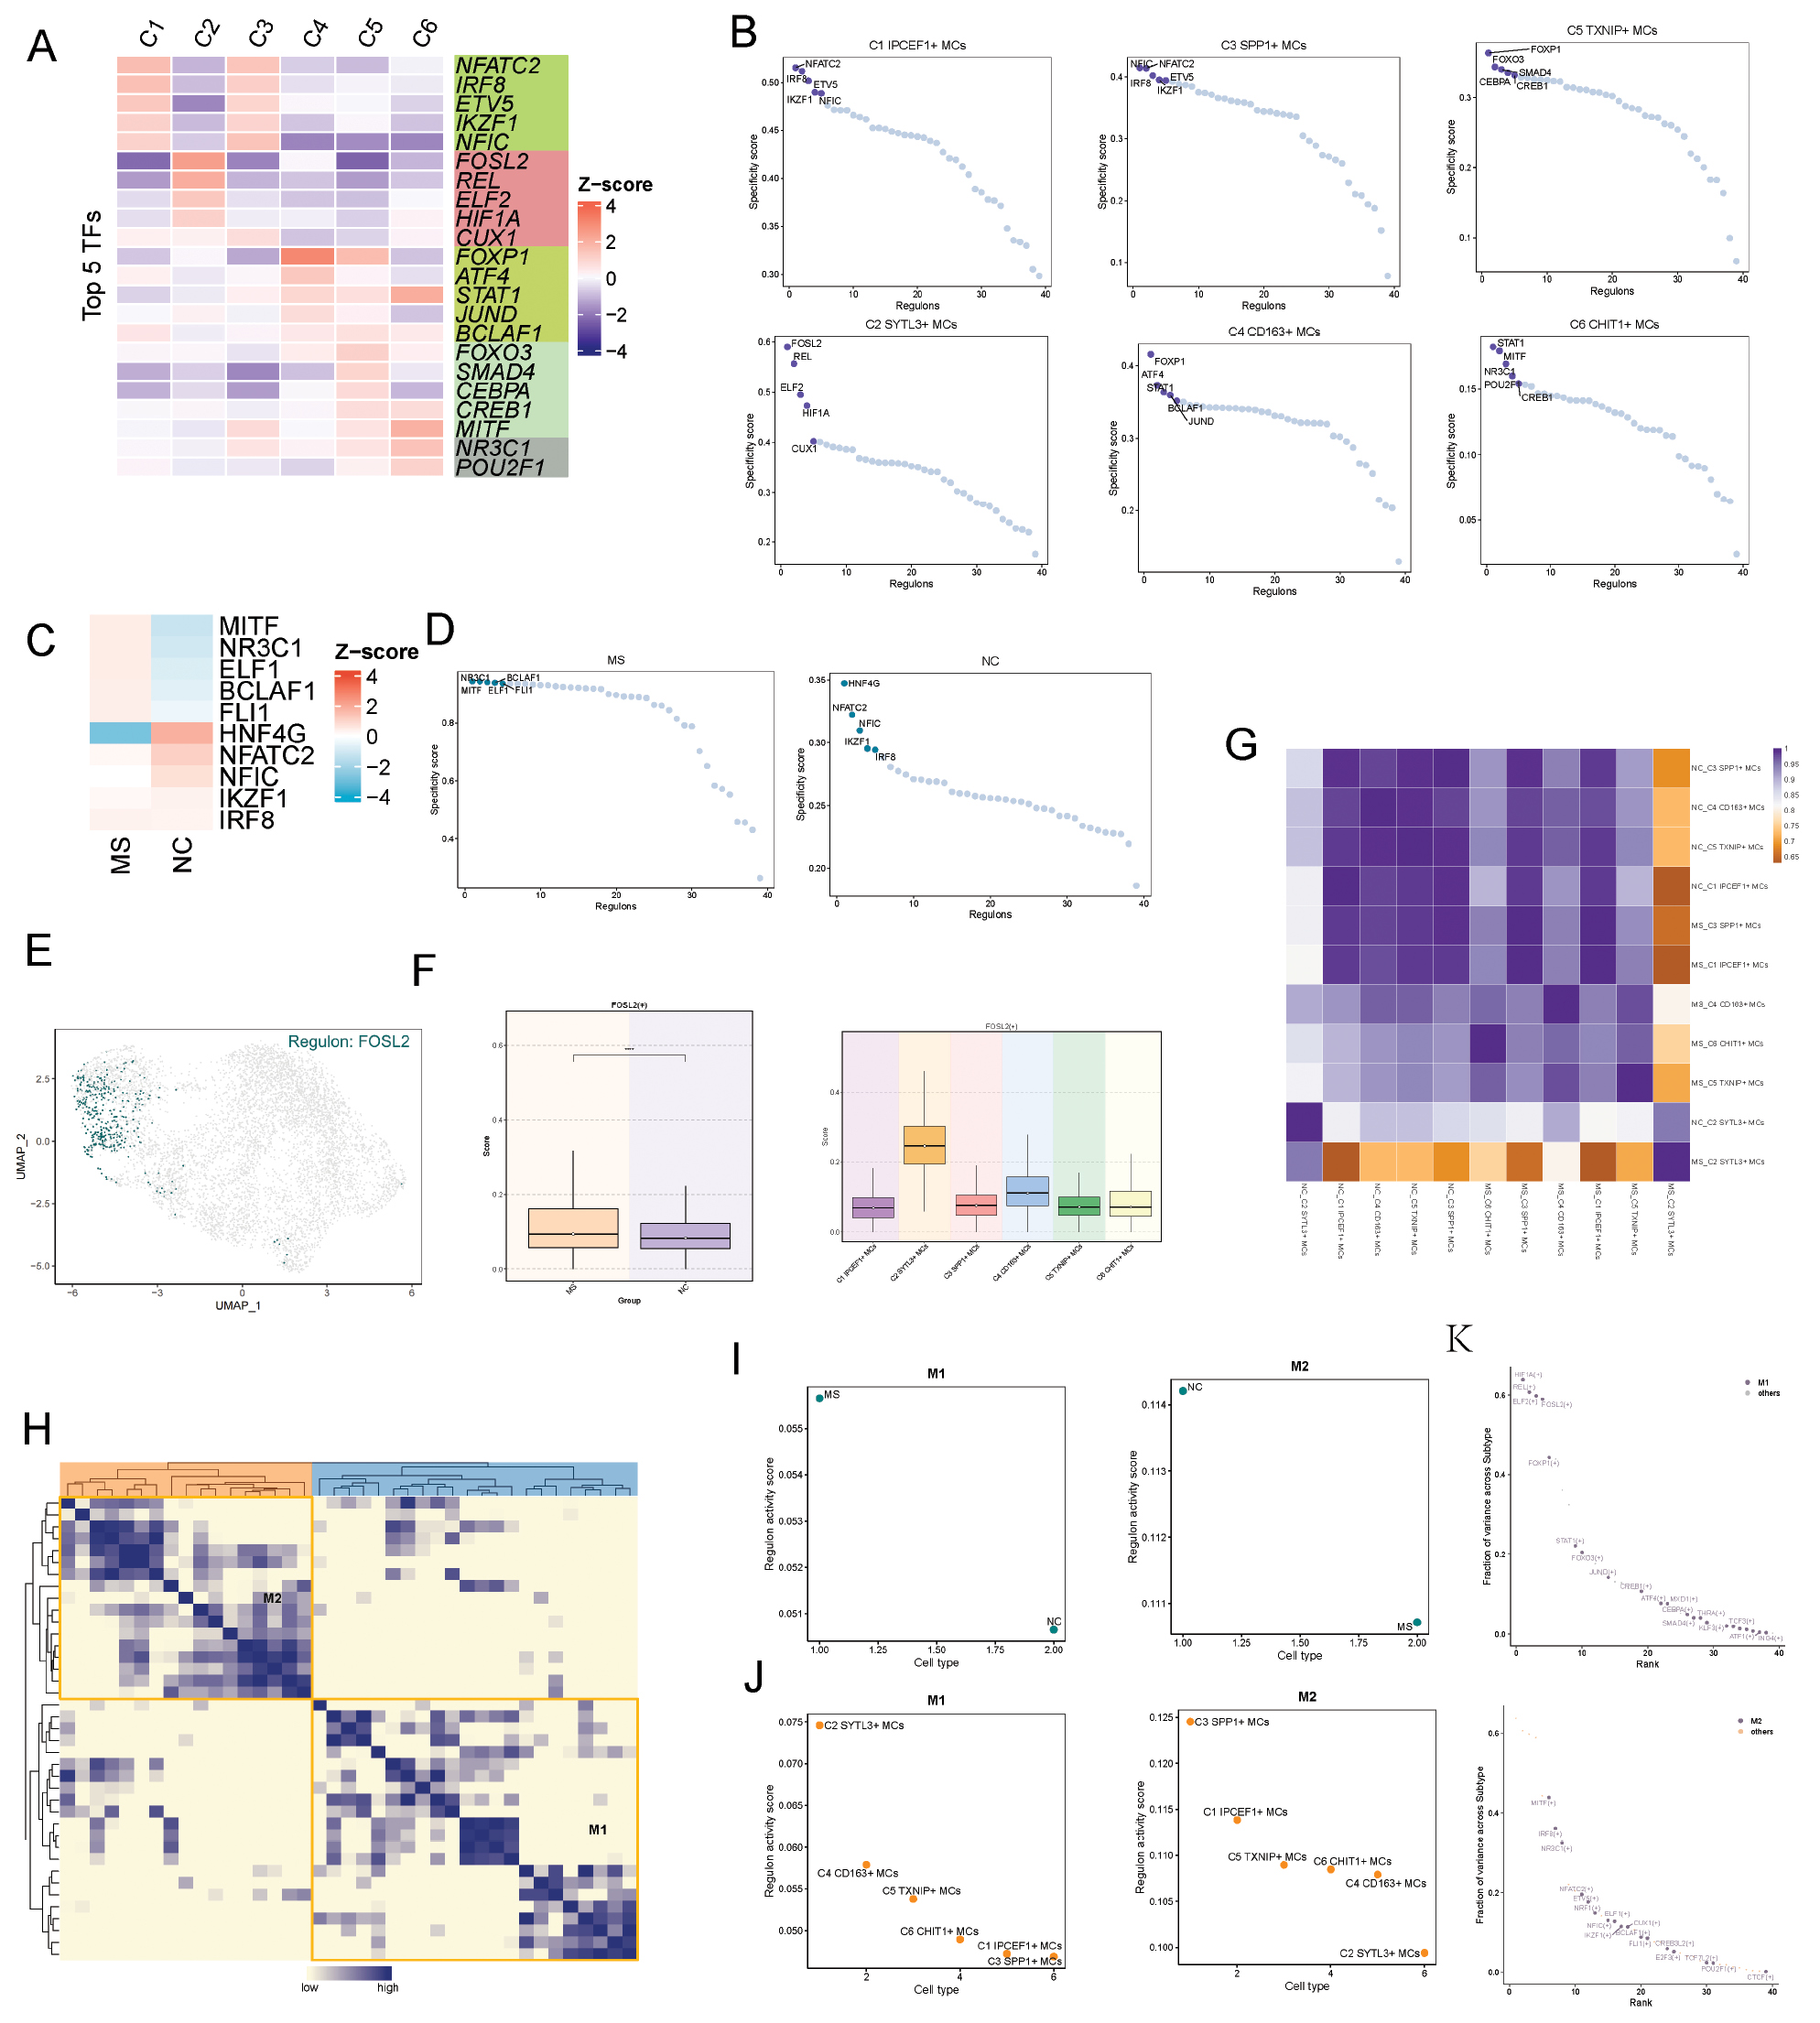
Subsequently, we applied the SCENIC identification framework and the CSI matrix to uncover the regulatory modules of fibroblast subtypes. On the basis of AUCell scores, we categorized the regulatory modules into two primary groups: M1 and M2 (Figure 7H). We then ranked the TF activity scores for each subtype within the M1 and M2 modules. In the M1 module, the C2 microglial subtype exhibited distinctly higher TF activity than the other subtypes, whereas in the M2 module, the C2 microglia showed markedly lower TF activity than the other subtypes (Figure 7J). Furthermore, we ranked the top five TFs in both M1 and M2 modules according to the variance explained across subtypes, thereby confirming that these TFs were among the highest ranked (Figure 7K).
Discussion
Herein, we integrated single-cell RNA sequencing and spatial transcriptomics to systematically characterize microglial heterogeneity in chronic MS white matter, with a focus on the disease-associated C2 microglial subtype.
Single-cell sequencing has been extensively applied in MS research. Disease-associated B cell, T cell, and monocyte subtypes have been identified in the cerebrospinal fluid from patients with MS [23]. Specific OL and oligodendrocyte precursor cell subpopulations with immunomodulatory and phagocytic functions have been identified in the spinal cord in EAE mice [24]. In active lesions of patients with progressive MS (PMS), the numbers of homeostatic and TNF-high microglia are diminished, whereas activated and highly phagocytic microglia are elevated. Additionally, active PMS lesions contain fewer monocyte-derived macrophages than observed in early disease stages, thereby highlighting distinct pathological mechanisms in chronic MS progression [25]. Furthermore, Shahriar et al. [26] have shown that venous endothelial cells in EAE mouse lesions exhibit gene signatures associated with angiogenesis and enhanced proliferation, which might be related to BBB impairment during acute and chronic MS progression. Other researchers have established organoid models and performed single-cell sequencing revealing that astrocytes in MS-derived organoids are enriched in pathways associated with autoantigen presentation and inflammatory signaling [27]. Although single-cell sequencing technology has provided a broader perspective for understanding the pathological environment of MS, the precise regulatory mechanisms and intercellular interactions of disease-relevant cells remain to be further elucidated.
The primary pathological process in MS involves oligodendrocyte injury. However, oligodendrocytes themselves exhibit intrinsic heterogeneity. One study performing single-nucleus RNA sequencing on post-mortem white matter regions has revealed an imbalance in oligodendrocyte subpopulation proportions in the brain in patients with MS. Concurrently, a distinct “immune-type” oligodendrocyte subpopulation was identified, expressing immune-related genes. Therefore, within the MS environment, oligodendrocytes directly participate in immune responses and potentially exacerbate inflammation. Interestingly, the same study found upregulation of myelin-related genes in mature oligodendrocytes in patients with MS, thus suggesting a potential attempt at remyelination [28]. In contrast, our own analysis of oligodendrocyte subtypes indicated lower myelination functionality in the subtypes enriched in the MS group. Therefore, further exploration of the functional subdivision of oligodendrocytes in chronic MS and their targeted therapy is warranted.
Microglia account for approximately 40% of the phagocytes found in early active lesions. However, microglia predominate in progressive MS and in smoldering lesions, whereas monocyte-derived macrophages are more common in RRMS lesions. The activation of microglia in smoldering lesions might stem from multiple factors. This study differentiated induced pluripotent stem cells from patients with RRMS and secondary progressive MS into microglia-like cells, which, even in an unstimulated resting state, exhibit a unique inflammatory gene expression profile prominently enriched in key immune pathways such as immune receptor activation, antigen presentation, and the complement system. Therefore, the sustained activation of microglia in MS might be attributable to their cell-autonomous activation under basal conditions.
The C2 microglial subtype was notably enriched in fatty acid metabolic processes. Saturated fatty acids have been reported to activate the PI3K/AKT signaling pathway, drive T cell activation, and induce the secretion of pro-inflammatory cytokines [29]. Myelin is composed of approximately 70% lipids (including cholesterol, phospholipids, and glycolipids). In MS lesions, myelin destruction generates large amounts of lipid debris. The massive phagocytosis of this debris markedly increases intracellular lipids within microglia and triggers a state of “lipid overload.” To cope with this excess lipid burden, microglia must undergo metabolic reprogramming. Furthermore, after phagocytosing myelin fragments, microglia upregulate fatty acid β-oxidation. The intermediates generated from this process (such as succinate) directly stabilize HIF-1α and drive the production of pro-inflammatory cytokines such as IL-1B, thereby exacerbating neuroinflammation.
Cell-cell communication analysis revealed that the C2 microglial subtype interacts with oligodendrocytes via the VISFATIN pathway, in which the NAMPT-INSR ligand-receptor pair showed the highest expression. Microglia have been reported to secrete NAMPT via exosomes during ischemic neuroinflammation [30]. Moreover, NAMPT inhibits pro-inflammatory polarization of infiltration of microglia and neutrophils after cerebral ischemia [31]. Neuronal overexpression of NAMPT decreases oligodendrocyte injury under oxygen-glucose deprivation conditions [32]. In agreement with the observed upregulation of NAMPT and its receptors in C2 microglia, our data supported the activation of this pathway. Therefore, we propose that the VISFATIN pathway might participate in a context-dependent regulatory response. Although activation of this pathway might potentially represent a compensatory effort to support oligodendrocytes, it might also exert pathological effects by sustaining pro-inflammatory states. This functional duality underscores the complexity of the C2 subtype and requires further investigation. Transcriptomic profiling demonstrated that the C2 subtype exhibits a dual signature of pro-inflammatory and phagocytic activity. On the basis of these data, C2 might plausibly represent a maladaptive yet plastic state characterized by heightened inflammatory and phagocytic activity alongside engagement of intrinsic compensatory and protective programs.
The goal of DMT, the core treatment for relapsing and progressive MS, is not only to alleviate symptoms but to fundamentally alter disease progression. DMT primarily includes S1P receptor modulators (ozanimod and fingolimod), integrin inhibitors (natalizumab), anti-CD20 monoclonal antibodies (rituximab and ocrelizumab), and interferon-β. However, DMT therapies can have adverse effects, such as lymphopenia and cardiovascular adverse events [33] induced by S1PRM. Furthermore, current DMTs predominantly target peripheral immune cell infiltration and therefore often have limited efficacy in PMS, in which inflammation becomes compartmentalized within the CNS. Our identification of the C2 subtype within chronic lesions suggested that these resident microglia drive smoldering inflammation independently of peripheral infiltration. The persistence of the C2 subtype might therefore explain the therapeutic resistance observed in PMS and represent a critical target for next-generation, CNS-penetrant therapies.
Our study identified FOSL2 as a highly expressed TF with elevated regulon activity in the C2 microglia, and implicated it as a potential driver of the pro-inflammatory phenotype in these cells. As a member of the AP-1 family, FOSL2 forms homo- or heterodimers with Jun family proteins and subsequently regulates the transcription of downstream target genes involved in immune activation and inflammatory responses. In agreement with our findings, accumulating evidence indicates that FOSL2 plays a critical role in promoting inflammation and autoimmunity. Studies have shown that the pro-inflammatory effects of FOSL2 are at least partly mediated by repression of regulatory T cell (Treg) development rather than direct modulation of effector T cell function. FOSL2 transgenic mice exhibit systemic inflammatory phenotypes, whereas T cell–specific deletion of FOSL2 in an EAE model enhances Treg inhibitory ability, increases expression of immune checkpoint molecules (including PD-1, GITR, Helios, and CTLA-4), and increases the proportion of thymus-derived Tregs within the CNS [34]. These findings highlight FOSL2 as an important regulator of immune tolerance and inflammatory balance. Beyond its role in adaptive immunity, FOSL2 has been implicated in macrophage and microglial polarization. Knockout of FOSL2 in U937 cells decreases the expression of M1-associated markers, including IL1B, CXCL2, CXCL3, and CCL2, as well as the enrichment in pathways associated with myeloid differentiation, hypoxia response, and glucocorticoid signaling; therefore, FOSL2 might have a role in shaping pro-inflammatory macrophage programs [35]. Similarly, Yuan et al. have demonstrated that miR-92a-3p–mediated upregulation of FOSL2 enhances pro-inflammatory cytokine production and promotes M1 polarization [36]. Elevated FOSL2 expression has been observed in an Aβ-induced microglial inflammation model, whereas knockdown of FOSL2 or its upstream regulator SPI1 facilitates a shift toward an anti-inflammatory M2 phenotype [37]. Mechanistically, SPI1 directly binds the FOSL2 promoter and drives its transcription, thereby amplifying neuroinflammatory signaling through the FOSL2/JAK2/STAT3 axis. In addition, post-transcriptional and downstream regulatory mechanisms involving miR-143-3p [38], miR-597 [39], and the IRF2BPL–PI3K/AKT/mTOR pathway further underscore the central position of FOSL2 within inflammatory regulatory networks [40]. Together, these data support that FOSL2 is a key regulatory node integrating multiple upstream signals and orchestrating pro-inflammatory microglial activation.
Notably, recent pharmacological evidence has further highlighted the druggability of FOSL2. Corydalis decumbens–derived tetrahydropalmatrubine has been reported to directly bind FOSL2, induce conformational changes, inhibit AP-1 transcriptional activity, and suppress downstream pro-inflammatory gene expression in arthritic models [41]. In the context of MS, the enrichment of FOSL2 in C2 microglia suggests that targeting the FOSL2 regulon might provide a promising strategy to modulate microglial activation states, attenuate chronic neuroinflammation, and potentially promote tissue repair. However, further functional studies are required to delineate the precise role of FOSL2 in microglial biology and validate its therapeutic potential in MS.
Study limitations
Although this study provided novel insights into microglial heterogeneity in chronic MS through integrated multi-omics analyses, several limitations should be acknowledged. The role of the C2 microglial subtype and FOSL2 in chronic MS lacks further experimental validation. Additionally, given the complexity of MS progression and its clinical subtypes, future studies should refine sample selection according to the distinct classifications of chronic MS.
Data availability statement
The datasets analyzed in this study are available in the GEO repository (GSE279108).
Ethics statement
All data used in this study were obtained from publicly available de-identified datasets or were collected in accordance with the ethical standards of the institutional research committee. Ethical approval was waived for this secondary analysis of previously published data.
Author contributions
All authors contributed to the study conception and design. Zhiheng Lin performed data analysis. Yifan Shang was responsible for data curation and preparation of the original draft. Lei Sun proofread the main text and supplementary materials. Jingheng Lin verified citation accuracy and prepared the errata list. All authors read and approved the final manuscript.
Funding
No funding or sponsorship was received for this study.
Acknowledgment
The Graphical Abstract was created with Adobe Illustrator (v28.0) and PowerPoint 2021.
Conflicts of interest
The authors declare that they have no competing interests or conflicts of interest that could influence the work reported herein.
Graphical abstract
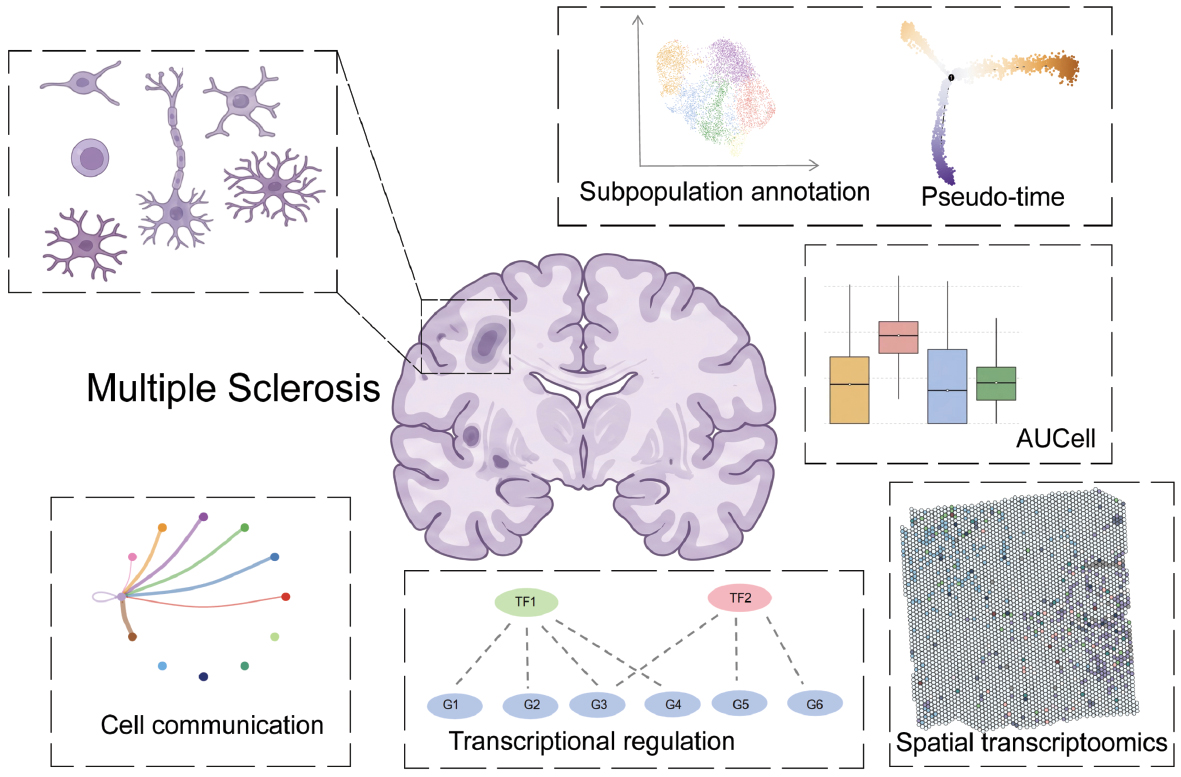
Highlights
- Integrated single-cell RNA-seq and spatial transcriptomics were used to map microglial heterogeneity in chronic MS.
- A disease-associated C2 subtype characterized by enhanced phagocytosis and fatty acid metabolism was identified.
- The C2 subtype was linked to “smoldering” inflammation and therapeutic resistance in progressive MS.
- FOSL2 was identified as a key hypothesis-generating regulator orchestrating pro-inflammatory microglial states.
In brief
This study provides a high-resolution characterization of microglial functional diversity in chronic MS. By integrating single-cell and spatial transcriptomics, we identified a specific C2 microglial subtype driving the smoldering inflammation characteristic of progressive MS. Our findings explain how resident microglia contribute to therapeutic resistance against conventional DMTs and implicate the FOSL2 regulon as a potential intervention target. This work offers critical insights for developing next-generation, CNS-specific treatments to halt MS progression.
References
- McGinley MP, Goldschmidt CH, Rae-Grant AD. Diagnosis and treatment of multiple sclerosis: a review. JAMA 2021;325(8):765-79. [PMID: 33620411 DOI: 10.1001/jama.2020.26858]
- Zhu X, Yue M, Zhang X, Han Y, Xia R, et al. Global disease burden of immune-mediated inflammatory diseases (IMIDs), 1990–2021. Med Res 2025;1(2):285-96. [DOI: 10.1002/mdr2.70018]
- Mansilla MJ, Presas-Rodriguez S, Teniente-Serra A, Gonzalez-Larreategui I, Quirant-Sanchez B, et al. Paving the way towards an effective treatment for multiple sclerosis: advances in cell therapy. Cell Mol Immunol 2021;18(6):1353-74. [PMID: 33958746 DOI: 10.1038/s41423-020-00618-z]
- Filippi M, Bar-Or A, Piehl F, Preziosa P, Solari A, et al. Multiple sclerosis. Nat Rev Dis Primers 2018;4(1):43. [PMID: 30410033 DOI: 10.1038/s41572-018-0041-4]
- Al-Kuraishy HM, Sulaiman GM, Mohammed HA, Albukhaty S, Albuhadily AK, et al. The compelling role of brain-derived neurotrophic factor signaling in multiple sclerosis: role of BDNF activators. CNS Neurosci Ther 2024;30(12):e70167. [PMID: 39654365 DOI: 10.1111/cns.70167]
- Feng R, Spieth L, Liu L, Berghoff S, Franz J, et al. Single-cell spatial transcriptomic profiling defines a pathogenic inflammatory niche in chronic active multiple sclerosis lesions. Immunity 2025;58(12):2989-3005. [PMID: 41167189 DOI: 10.1016/j.immuni.2025.10.003]
- Sun R, Jiang H. Border-associated macrophages in the central nervous system. J Neuroinflammation 2024;21(1):67. [PMID: 38481312 DOI: 10.1186/s12974-024-03059-x]
- Zhao T, Di J, Kang Y, Zhang H, Yao S, et al. TREM2 impedes recovery after spinal cord injury by regulating microglial lysosomal membrane permeabilization-mediated autophagy. Cell Prolif 2025;58(10):e70047. [PMID: 40320759 DOI: 10.1111/cpr.70047]
- Hyvärinen T, Tilvis J, Giudice L, Tujula I, Nylund M, et al. Microglia from patients with multiple sclerosis display a cell-autonomous immune activation state. J Neuroinflammation 2025;22(1):255. [PMID: 41174786 DOI: 10.1186/s12974-025-03575-4]
- Vermersch P, Airas L, Berger T, Deisenhammer F, Grigoriadis N, et al. The role of microglia in multiple sclerosis: implications for treatment with Bruton’s tyrosine kinase inhibitors. Front Immunol 2025;16:1495529. [PMID: 40443664 DOI: 10.3389/fimmu.2025.1495529]
- Jia J, Zheng L, Ye L, Chen J, Shu S, et al. CD11c+ microglia promote white matter repair after ischemic stroke. Cell Death Dis 2023;14(2):156. [PMID: 36828819 DOI: 10.1038/s41419-023-05689-0]
- Baaklini CS, Ho MFS, Lange T, Hammond BP, Panda SP, et al. Microglia promote remyelination independent of their role in clearing myelin debris. Cell Rep 2023;42(12):113574. [PMID: 38100356 DOI: 10.1016/j.celrep.2023.113574]
- Zhao Z, Cai H, Zhao Z, Wang X, Nie W, et al. Cancer-associated fibroblast-derived GDF15 induces oxidative stress and neutrophil infiltration in head and neck squamous cell carcinoma through the PI3K/AKT/STAT3 axis cascade. Research (Wash D C) 2025;8:901. [PMID: 41035818 DOI: 10.34133/research.0901]
- Xie R, Li T, Gao H, Xie C, Yuan H, et al. Single-cell transcriptional profiling reveals cellular senescence and inflammatory persistence as key features of type 1 diabetes partial remission. Diabetes Obes Metab 2025;27(7):3653-75. [PMID: 40183401 DOI: 10.1111/dom.16384]
- Zhao Z, Cai H, Nie W, Wang X, Zhao Z, et al. Ectopic expression of GDF15 in cancer-associated fibroblasts enhances melanoma immunosuppression via the GFRAL/RET cascade. J Immunother Cancer 2025;13(6):e011036. [PMID: 40555562 DOI: 10.1136/jitc-2024-011036]
- Wang S, Greenbaum J, Qiu C, Swerdlow RH, Haeri M, et al. Gene interactions analysis of brain spatial transcriptome for Alzheimer’s disease. Genes Dis 2024;11(6):101337. [PMID: 39281834 DOI: 10.1016/j.gendis.2024.101337]
- Yadav MK, Maharana J, Yadav R, Saha S, Sarma P, et al. Molecular basis of anaphylatoxin binding, activation, and signaling bias at complement receptors. Cell 2023;186(22):4956-73. [PMID: 37852260 DOI: 10.1016/j.cell.2023.09.020]
- Young SG, Fong LG, Beigneux AP, Allan CM, He C, et al. GPIHBP1 and lipoprotein lipase, partners in plasma triglyceride metabolism. Cell Metab 2019;30(1):51-65. [PMID: 31269429 DOI: 10.1016/j.cmet.2019.05.023]
- Li Y, Lu Y, Lin SH, Li N, Han Y, et al. Insulin signaling establishes a developmental trajectory of adipose regulatory T cells. Nat Immunol 2021;22(9):1175-85. [PMID: 34429546 DOI: 10.1038/s41590-021-01010-3]
- Tadokoro T, Murata S, Kato M, Ueno Y, Tsuchida T, et al. Human iPSC–liver organoid transplantation reduces fibrosis through immunomodulation. Sci Transl Med 2024;16(757):eadg0338. [PMID: 39047116 DOI: 10.1126/scitranslmed.adg0338]
- Liu Z, Chen C, Zhang Y, Ji F, Liu H, et al. Legumain in situ engineering promotes efferocytosis of CAR macrophage to treat cardiac fibrosis. Adv Mater 2025;37(27):e2417831. [PMID: 40223483 DOI: 10.1002/adma.202417831]
- Lei S, Chen C, Han F, Deng J, Huang D, et al. AMER1 deficiency promotes the distant metastasis of colorectal cancer by inhibiting SLC7A11- and FTL-mediated ferroptosis. Cell Rep 2023;42(9):113110. [PMID: 37682704 DOI: 10.1016/j.celrep.2023.113110]
- Straeten F, Zhu J, Börsch AL, Zhang B, Li K, et al. Integrated single-cell transcriptomics of cerebrospinal fluid cells in treatment-naïve multiple sclerosis. J Neuroinflammation 2022;19(1):306. [PMID: 36536441 DOI: 10.1186/s12974-022-02667-9]
- Falcão AM, van Bruggen D, Marques S, Meijer M, Jäkel S, et al. Disease-specific oligodendrocyte lineage cells arise in multiple sclerosis. Nat Med 2018;24(12):1837-44. [PMID: 30420755 DOI: 10.1038/s41591-018-0236-y]
- Böttcher C, van der Poel M, Fernández-Zapata C, Schlickeiser S, Leman JKH, et al. Single-cell mass cytometry reveals complex myeloid cell composition in active lesions of progressive multiple sclerosis. Acta Neuropathol Commun 2020;8(1):136. [PMID: 32811567 DOI: 10.1186/s40478-020-01010-8]
- Shahriar S, Biswas S, Zhao K, Akcan U, Tuohy MC, et al. VEGF-A-mediated venous endothelial cell proliferation results in neoangiogenesis during neuroinflammation. Nat Neurosci 2024;27(10):1904-17. [PMID: 39256571 DOI: 10.1038/s41593-024-01746-9]
- Fagiani F, Pedrini E, Taverna S, Brambilla E, Murtaj V, et al. A glia-enriched stem cell 3D model of the human brain mimics the glial-immune neurodegenerative phenotypes of multiple sclerosis. Cell Rep Med 2024;5(8):101680. [PMID: 39121861 DOI: 10.1016/j.xcrm.2024.101680]
- Jäkel S, Agirre E, Mendanha Falcao A, van Bruggen D, Lee KW, et al. Altered human oligodendrocyte heterogeneity in multiple sclerosis. Nature 2019;566(7745):543-47. [PMID: 30747918 DOI: 10.1038/s41586-019-0903-2]
- Yu H, Bai S, Hao Y, Guan Y. Fatty acids role in multiple sclerosis as “metabokines”. J Neuroinflammation 2022;19:157. [PMID: 35715809 DOI: 10.1186/s12974-022-02502-1]
- Lu YB, Chen CX, Huang J, Tian YX, Xie X, et al. Nicotinamide phosphoribosyltransferase secreted from microglia via exosome during ischemic injury. J Neurochem 2019;150(6):723-37. [PMID: 31269239 DOI: 10.1111/jnc.14811]
- Chen F, Weng Z, Xia Q, Cao C, Leak RK, et al. Intracerebroventricular delivery of recombinant NAMPT deters inflammation and protects against cerebral ischemia. Transl Stroke Res 2019;10(6):719-28. [PMID: 30820847 DOI: 10.1007/s12975-019-00692-0]
- Jing Z, Xing J, Chen X, Stetler RA, Weng Z, et al. Neuronal NAMPT is released after cerebral ischemia and protects against white matter injury. J Cereb Blood Flow Metab 2014;34(10):1613-21. [PMID: 25005877 DOI: 10.1038/jcbfm.2014.119]
- Balzano N, Di Napoli R, Fraenza F, Di Giulio Cesare D, Moreggia O, et al. Lymphopenia associated with sphingosine 1-phosphate receptor modulators (S1PRMs) in multiple sclerosis: analysis of European pharmacovigilance data. Pharmacol Rep 2025;77(3):775-88. [PMID: 40199814 DOI: 10.1007/s43440-025-00725-6]
- Renoux F, Stellato M, Haftmann C, Vogetseder A, Huang R, et al. The AP1 transcription factor Fosl2 promotes systemic autoimmunity and inflammation by repressing Treg development. Cell Rep 2020;31(3):107826. [PMID: 32610127 DOI: 10.1016/j.celrep.2020.107826]
- Wu Y, Yang J, Chen M, Chen X, Cao S. Synovial CXCL3+FOSL2+ macrophages mediate inflammation via FOSL2/AP-1 in rheumatoid arthritis: a single-cell transcriptome analysis. Int J Mol Sci 2025;26(19):9718. [PMID: 41096984 DOI: 10.3390/ijms26199718]
- Yuan Z, Chen R, Fan R, Yang Z, Zhu Q, et al. FOSL2+ macrophages drive pro-inflammatory phenotype via miR-92a-3p/FOSL2/NF-κB axis to mediate endothelial cell injury in aortic dissection. Life Sci 2026;388:124174. [PMID: 41453656 DOI: 10.1016/j.lfs.2025.124174]
- Sun X, Dai G, Yu L, Hu Q, Chen J, et al. miR-143-3p inhibits the proliferation, migration and invasion in osteosarcoma by targeting FOSL2. Sci Rep 2018;8(1):606. [PMID: 29330462 DOI: 10.1038/s41598-017-18739-3]
- He J, Mai J, Li Y, Chen L, Xu H, et al. miR-597 inhibits breast cancer cell proliferation, migration and invasion through FOSL2. Oncol Rep 2017;37(5):2672-78. [PMID: 28393251 DOI: 10.3892/or.2017.5558]
- Liu W, Xia K, Huang X, Wei Z, Wei Z, et al. IRF2BPL inhibits proliferation, migration and invasion of osteosarcoma cells by inhibiting FOSL2-mediated PI3K/AKT pathway activation. Cell Signal 2025;135:112068. [DOI: 10.1016/j.cellsig.2025.112068]
- Gao P, Yuan S, Wang Y, Wang Y, Li X, et al. Corydalis decumbens and tetrahydropalmatrubin inhibit macrophages inflammation to relieve rheumatoid arthritis by targeting Fosl2. J Ethnopharmacol 2025;341:119348. [PMID: 39805480 DOI: 10.1016/j.jep.2025.119348]
- Du J, An Z. SPI1 affects Aβ1–42-induced microglia-mediated neuroinflammation by transcriptionally regulating FOSL2 expression. J Neuroimmunol 2025;406:578650. [PMID: 40449341 DOI: 10.1016/j.jneuroim.2025.578650]