Differentiating Hepatic Perivascular Epithelioid Cell Tumor from Hepatocellular Carcinoma without High-Risk Factors using Contrast-Enhanced Ultrasound
1Department of Ultrasound, the First Medical Center, Chinese PLA General Hospital, No. 28, Fuxing Road, Haidian District, Beijing 100853, China
aThese authors contributed equally.
*Correspondence to: Lianhua Zhu, Department of Ultrasound, the First Medical Center, Chinese PLA General Hospital, No. 28, Fuxing Road, Haidian District, Beijing 100853, China. Tel: +86-010-66935074, E-mail: zhulianhua27@163.com
Received: November 20 2025; Revised: December 14 2025; Accepted: December 21 2025; Published Online: January 5 2026.
Cite this paper:
Fei X, Li N, Jiang B et al. Differentiating Hepatic Perivascular Epithelioid Cell Tumor from Hepatocellular Carcinoma without High-Risk Factors using Contrast-Enhanced Ultrasound. BIO Integration 2026; 7: 1–12.
DOI: 10.15212/bioi-2025-0211. Available at: https://bio-integration.org/
Download citation
© 2026 The Authors. This is an open access article distributed under the terms of the Creative Commons Attribution License (https://creativecommons.org/licenses/by/4.0/). See https://bio-integration.org/copyright-and-permissions/
Abstract
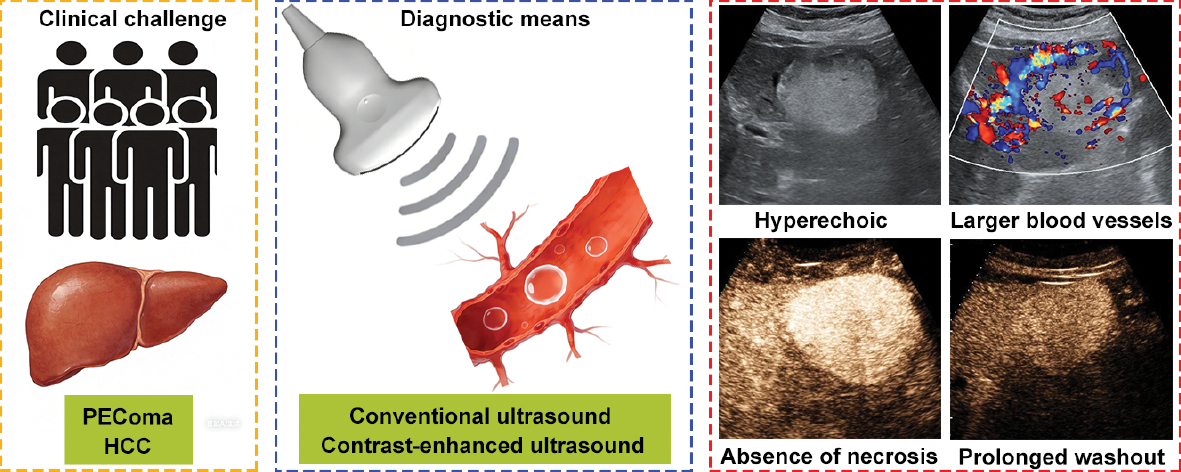
Background: Hepatic perivascular epithelioid cell tumor (PEComa) is a rare tumor with malignant potential that is frequently misdiagnosed as hepatocellular carcinoma (HCC), despite requiring distinct treatment approaches. This study retrospectively investigated the imaging characteristics of PEComa and HCC without high-risk factors using conventional ultrasound (CUS) and contrast-enhanced ultrasound (CEUS) to improve preoperative diagnostic accuracy.
Materials and methods: Sixteen patients with pathologically confirmed PEComa and 31 patients with HCC and no known high-risk factors underwent preoperative ultrasound examinations. Imaging features from CUS and CEUS were systematically reviewed and compared. Independent predictive factors of PEComa were identified using multiple logistic regression analysis and diagnostic performance was assessed through receiver operating characteristic curve analysis. Bootstrap validation and optimism correction were applied to assess the stability and generalization performance.
Results: Of the 16 patients in the PEComa group, 11 underwent surgical resection and biopsies were performed in 5. PEComa exhibited distinct CUS imaging features, including a hyperechoic appearance, clear margins, and larger blood vessels around lesions. PEComa was characterized by the absence of necrosis, hyper- or iso-enhancement in the portal phase, isoenhancement in the delayed phase, and prolonged washout time (>180 s) on CEUS. Logistic regression analysis identified hyperechoic appearance, larger blood vessels around lesions, absence of necrosis, and prolonged washout time as independent predictors of PEComa. Integrating CUS and CEUS significantly improved diagnostic accuracy, achieving a sensitivity of 81.25%, a specificity of 96.77%, and an area under the receiver operating characteristic curve of 0.9395. Bootstrap validation and optimism correction confirmed the stability and generalization performance of the combined method.
Conclusion: This preliminary study demonstrated that the integration of CUS and CEUS provides high specificity and accuracy in distinguishing hepatic PEComa from HCC without high-risk factors. The identified imaging features should be considered as initial diagnostic indicators, facilitating accurate preoperative differentiation and supporting appropriate clinical management.
Keywords
Contrast-enhanced ultrasound, diagnosis, hepatocellular carcinoma, liver, perivascular epithelioid cell tumor.
Perivascular epithelioid cell tumor (PEComa) is a rare mesenchymal neoplasms characterized by specialized perivascular epithelioid cells exhibiting both smooth muscle and melanocytic differentiation [1, 2]. Immunohistochemically, PEComa expresses melanocytic markers, such as human melanin black-45 and Melan-A, and smooth muscle markers, like smooth muscle actin [3]. While PEComa most commonly occurs in the uterus and kidneys, the presence of PEComa in the liver is exceptionally rare [4]. Hepatic PEComa is considered a tumor of borderline malignant potential, typically displaying indolent biological behavior and predominantly affecting middle-aged females [5, 6]. These lesions are often asymptomatic and accompanied by non-contributory laboratory findings, making detection and diagnosis particularly challenging [7].
The absence of pathognomonic clinical, laboratory, or radiologic features significantly complicates the diagnosis of hepatic PEComa, frequently leading to misdiagnosis [8]. Studies have reported that PEComa is rarely diagnosed preoperatively with approximately 60% of cases being mistakenly identified as hepatocellular carcinoma (HCC), especially in patients without high-risk factors for HCC [9–11]. Unlike HCC, PEComa is not associated with established risk factors, such as liver cirrhosis, hepatitis virus infection, or a history of HCC [12]. Although HCC with high-risk factors is often identifiable based on typical radiologic features, differentiating hepatic PEComa from HCC in patients without such risk factors is difficult. Accurate preoperative differentiation is crucial because therapeutic strategies differ significantly between these entities. Treatment options vary for HCC without high-risk factors by clinical stage and may include radiofrequency ablation, surgical resection, transhepatic arterial chemoembolization, or liver transplantation [13, 14]. In contrast, hepatic PEComa is primarily treated with surgical resection due to its malignant potential. mTOR inhibitors may be considered an alternative therapeutic approach for patients unfit for surgery, such as patients of advanced age or with severe co-morbidities [15].
Conventional ultrasound (CUS) is widely used as a first-line imaging modality for liver tumors but has limited capacity to differentiate PEComa from HCC due to overlapping imaging features [5]. Contrast-enhanced ultrasound (CEUS), which utilizes purely intravascular microbubble contrast agents, provides real-time visualization of lesion perfusion and microvascular architecture [16, 17]. CEUS has gained popularity in characterizing focal liver lesions due to the high sensitivity and specificity, and safety profile, even in patients with impaired renal function [18]. Hepatic PEComa and HCC exhibit distinct vascular characteristics. PEComa is associated with rich sinusoid-like lacunae and complex vascular networks, while HCC primarily derives its blood supply from the arterial vasculature [19]. These differences theoretically lead to distinct enhancement patterns on CEUS following contrast administration. However, limited research has systematically investigated these features and most existing studies on hepatic PEComa are case reports [5, 20, 21]. Detailed CEUS findings for distinguishing hepatic PEComa from HCC in patients without risk factors, such as liver cirrhosis, hepatitis virus infection, or a history of HCC, have been poorly documented.
In this retrospective study the diagnostic value of combining CUS with CEUS in differentiating hepatic PEComa from HCC in patients without high-risk factors was assessed. This study identified distinctive imaging characteristics that improve diagnostic accuracy and provide deeper insights into the vascular and structural patterns unique to PEComa by systematically analyzing and comparing the imaging features of these two entities on CUS and CEUS.
Materials and methods
Study population
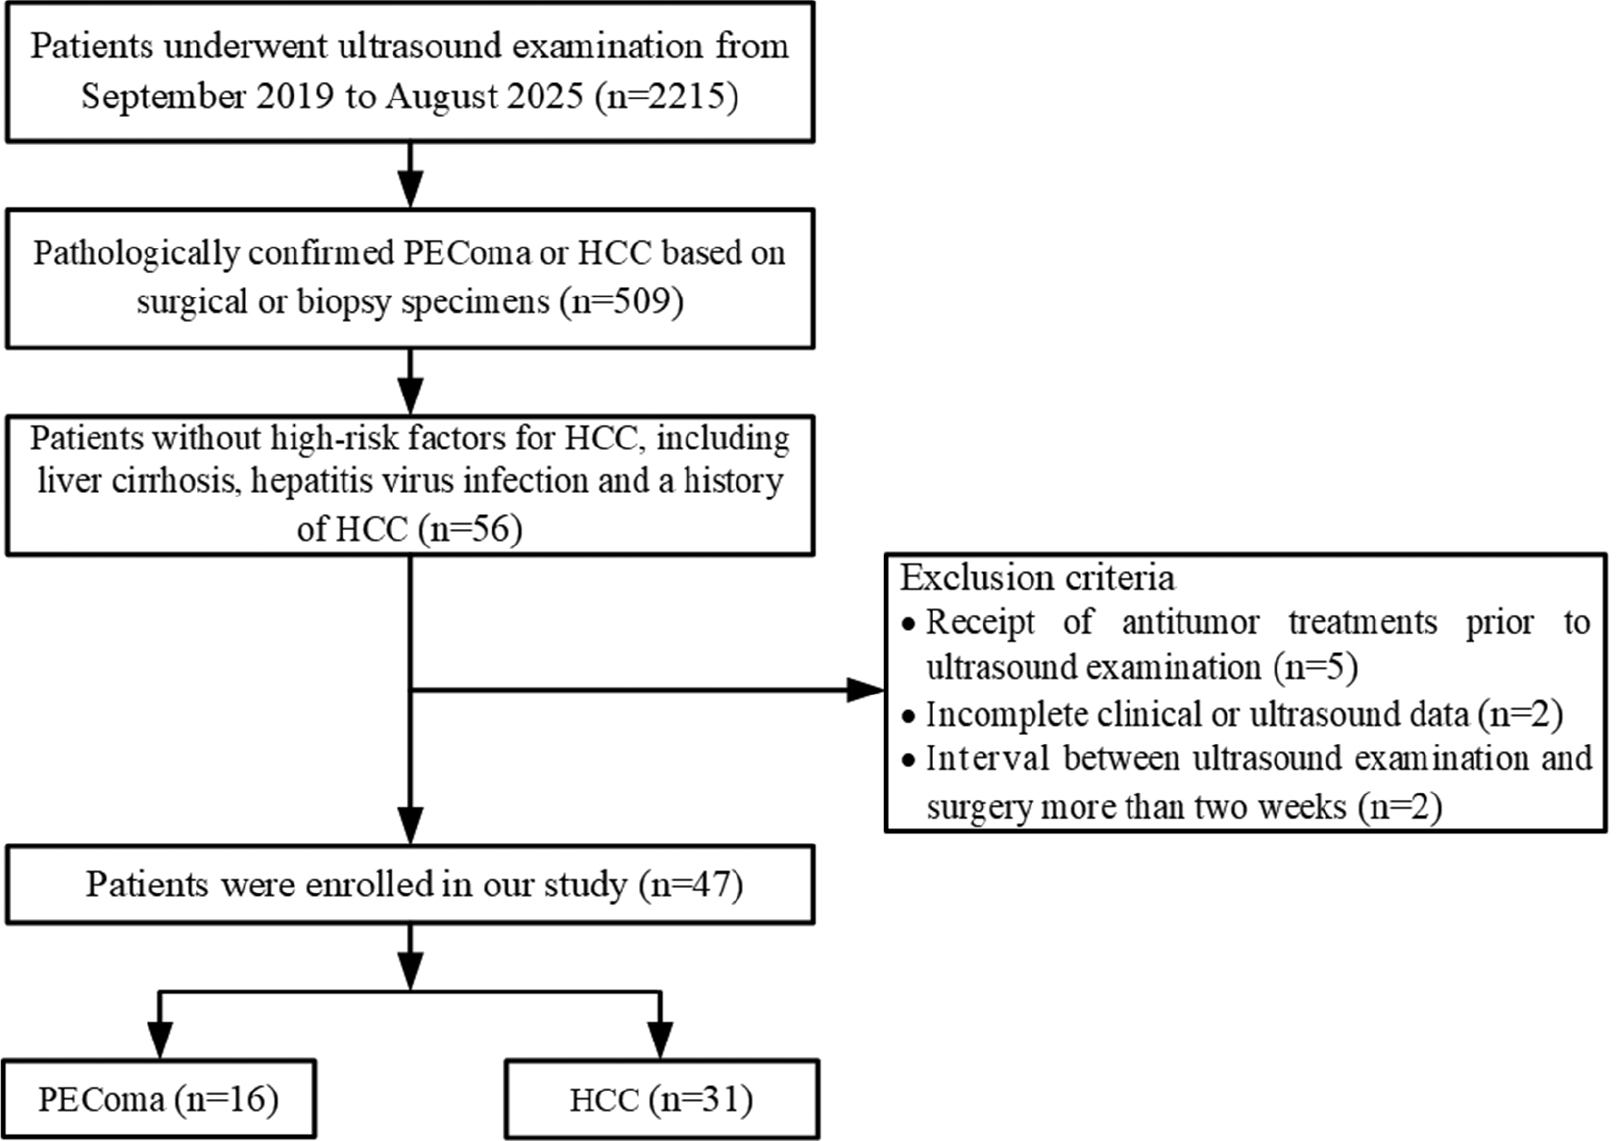
This retrospective study was conducted with approval from the Ethics Committee of the Chinese PLA General Hospital (Beijing, China). Informed consent was waived due to the retrospective design of the study. Sixteen patients diagnosed with hepatic PEComa and 31 patients with HCC between September 2019 and August 2025 were included (Figure 1). The inclusion criteria were as follows: (1) ultrasound examination performed prior to surgery or biopsy; (2) pathologically confirmed PEComa or HCC based on surgical or biopsy specimens; and (3) patients without high-risk factors for HCC, including liver cirrhosis, hepatitis virus infection, and a history of HCC. The exclusion criteria were as follows: (1) receipt of antitumor treatments prior to ultrasound examination; (2) incomplete clinical or ultrasound data; and (3) a > 2-week interval between the ultrasound examination and surgery.
Figure 1 Flow diagram illustrating patient enrollment and applied exclusion criteria. PEComa: perivascular epithelioid cell tumor; HCC: hepatocellular carcinoma.
Ultrasound equipment and scanning protocol
Ultrasound examinations were performed using high-performance ultrasound systems, including the Sequoia (Siemens, Munich, Germany) with 5C1 convex transducers and the Resona 7/R9 (Mindray, Shenzhen, China) with SC5-1U convex transducers. The central frequency ranged from 2.0–5.0 MHz. All CUS and CEUS examination followed the consensus guidelines established by the European Federation of Societies for Ultrasound in Medicine and Biology [22]. CUS was initially performed to evaluate tumor lesions and surrounding liver parenchyma. CEUS was subsequently conducted using a bolus injection of 2.4 mL SonoVue (Bracco, Milan, Italy) as the contrast agent. Real-time dynamic enhancement was continuously observed for at least 30 s during the arterial phase, followed by intermittent scanning at 30-s intervals until at least 5 min post-injection. The mechanical index was maintained between 0.06 and 0.09 to optimize imaging quality, with adjustments to focus, gain, and depth made as necessary. CEUS acquisitions were performed at a frame rate of 7–10 frames/s (fps).
Clinical data collection
Demographic and clinical data were extracted from patient medical records. The variables collected included age, gender, and laboratory parameters, such as alanine aminotransferase, aspartate aminotransferase, albumin, total bilirubin, alpha-fetoprotein, carbohydrate antigen 19–9, and carcinoembryonic antigen levels and prothrombin time and platelet count.
Ultrasound image analysis
Two experienced physicians, each with > 10 years of expertise in abdominal CEUS, independently reviewed all ultrasound images. Both physicians were blinded to pathologic findings and clinical data. Discrepancies in imaging feature interpretation were resolved via discussion until consensus was achieved. Inter- and intra-observer agreement was assessed using intraclass correlation coefficients or kappa statistics. The following CUS features were analyzed: tumor number; tumor location; maximum tumor diameter; echogenicity (hyperechoic, isoechoic, or hypoechoic compared to adjacent liver parenchyma); margins (clear or unclear); morphology (regular or irregular); hyperechoic ring (present or absent); blood flow on color Doppler imaging (present or absent); and larger blood vessels around lesions (diameter > 2 mm) on color Doppler imaging (present or absent).
The imaging characteristics for CEUS were assessed based on enhancement patterns relative to adjacent liver tissue, providing insights into tumor perfusion and vascularization. The following CEUS features were analyzed: initial enhancement time (earlier or not earlier); arterial phase enhancement intensity (hyperenhancement or non-hyperenhancement); feeding artery (present or absent); fill-in direction (centripetal or non-centripetal); necrosis (defined as non-enhancing area within the tumor lesion [present or absent]); enhancement mode (homogeneous or heterogeneous); portal phase enhancement intensity (hyper-, iso-, or hypo-enhancement); delayed phase enhancement intensity (iso-, hypo-enhancement, or no enhancement); pseudocapsule (present or absent); and washout time (> 180 or ≤ 180 s) [23, 24]. The CEUS enhancement process was divided into 3 phases: arterial phase (10–30 s); portal phase (30–120 s); and delayed phase (120–300 s) [22].
Pathologic examinations
All tumors were pathologically confirmed through surgical resection or biopsy. Immunohistochemical staining demonstrated for human melanin black-45-, Melan-A-, and smooth muscle actin-positivity, confirming the diagnosis of PEComa [7].
Post-hoc power analysis
The sample size estimation was not performed before data collection due to the retrospective nature of this study. A post-hoc power analysis based on the area under the receiver operating characteristic [ROC] curve (AUC) was performed using PASS 15.0 software to determine the statistical power of integrating CUS and CEUS in differentiating PEComa. The major parameters were set to an alpha of 0.05, a null hypothesis AUC of 0.7, lower and upper false-positive rates of 0.0 and 1.0, and a B value (the standard deviation of the HCC/PEComa group) of 1.0 according to the two-sided test of one ROC curve. The data type was discrete (ratings). The analysis demonstrated a statistical power of 94.30% based on the actual sample size and AUC, indicating that integrating CUS and CEUS was adequately powered in differentiating PEComa.
Statistical analysis
Statistical analyses were performed using SPSS 26.0 (IBM Corporation, Armonk, NY, USA). Continuous variables are expressed as medians with interquartile ranges, while categorical variables were summarized as frequencies and percentages. The Mann-Whitney U test was applied to compare continuous data, while categorical variables were analyzed using the chi-square test. Univariate logistic regression analysis was used to screen potential predictors of PEComa with variables showing a P value < 0.05 subsequently included in multivariate logistic regression to identify independent predictors. Diagnostic performance was determined using ROC curve analysis with AUC comparisons performed via the DeLong test. Bootstrap validation with 1000 resampling iterations was performed to assess the stability of the diagnostic approach and optimism correction was applied to mitigate potential overfitting. Statistical significance was defined as a P-value < 0.05.
Results
Patient baseline characteristics
Of the 16 patients in the PEComa group, 11 underwent surgical resection and biopsies were performed in 5. The patients ranged in age from 25–69 years with a mean age of 49 ± 12 years. The majority of patients were women (n = 11). In contrast, all 31 patients in the HCC group underwent surgical resection with ages ranging from 52–81 years and a mean age of 66 ± 8 years. Significant differences were detected between the PEComa and HCC groups in age, gender, and platelet count (P < 0.05). PEComa was more prevalent in middle-aged women. No significant differences were detected in alanine aminotransferase, aspartate aminotransferase, albumin, total bilirubin, alpha-fetoprotein, carbohydrate antigen 19–9, and carcinoembryonic antigen levels and prothrombin time (P > 0.05). The detailed clinical characteristics are provided in Table 1.
Table 1 Comparation of Baseline Clinical Characteristics between PEComa and HCC without High-Risk Factors
| Characteristics | PEComa (n = 16) | HCC (n = 31) | P value |
|---|---|---|---|
| Age (years)a | 50 (38-60) | 67 (60-72) | < 0.001 |
| Gender | < 0.001 | ||
| Men | 5 (31%) | 28 (90%) | |
| Women | 11 (69%) | 3 (10%) | |
| Alanine aminotransferase (U/L) | 0.60 | ||
| < 40 | 14 (88%) | 29 (94%) | |
| > 40 | 2 (12%) | 2 (6%) | |
| Aspartate aminotransferase (U/L) | > 0.99 | ||
| < 40 | 15 (94%) | 29 (94%) | |
| > 40 | 1 (6%) | 2 (6%) | |
| Albumin (g/L) | 0.34 | ||
| < 35 | 1 (6%) | 0 (0%) | |
| > 35 | 15 (94%) | 31 (100%) | |
| Total bilirubin (μmol/L) | > 0.99 | ||
| < 21 | 15 (94%) | 29 (94%) | |
| > 21 | 1 (6%) | 2 (6%) | |
| Prothrombin time (s) | > 0.99 | ||
| < 15 | 16 (100%) | 30 (97%) | |
| > 15 | 0 (0%) | 1 (3%) | |
| Platelet count (×109/L) | 0.04 | ||
| < 300 | 13 (81%) | 31 (100%) | |
| > 300 | 3 (19%) | 0 (0%) | |
| Alpha fetoprotein (μg/L)a | 0.08 | ||
| < 20 | 16 (100%) | 25 (81%) | |
| > 20 | 0 (0%) | 6 (19%) | |
| Carbohydrate antigen 19-9 (μ/mL) | 0.60 | ||
| < 37 | 14 (88%) | 29 (94%) | |
| > 37 | 2 (12%) | 2 (6%) | |
| Carcinoembryonic antigen (μg/L) | > 0.99 | ||
| < 5 | 16 (100%) | 30 (97%) | |
| > 5 | 0 (0%) | 1 (3%) |
Note: Unless otherwise specified, data are the number of patients with percentages in parentheses.
aData are presented as median values with interquartile ranges.
PEComa: perivascular epithelioid cell tumor; HCC: hepatocellular carcinoma.
CUS findings
The CUS imaging features of both groups are summarized in Table 2. Significant differences were detected in echogenicity, margins, and the presence of larger blood vessels around lesions between the PEComa and HCC groups (P < 0.05). PEComa lesions were more likely to have a hyperechoic appearance with clear margins and larger blood vessels around lesions compared to HCC lesions (Figures 2 and 3). No significant differences were detected between the two groups with respect to tumor number, location, maximum diameter, morphology, hyperechoic ring, or blood flow on color Doppler imaging (P > 0.05).
Table 2 Comparation of Conventional Ultrasound Characteristics between PEComa and HCC without High-Risk Factors
| Characteristics | PEComa (n = 16) | HCC (n = 31) | P value |
|---|---|---|---|
| Number | > 0.99 | ||
| Solitary | 14 (88%) | 28 (90%) | |
| Multiple | 2 (12%) | 3 (10%) | |
| Location | > 0.99 | ||
| Left | 6 (37%) | 12 (39%) | |
| Right | 10 (63%) | 19 (61%) | |
| Maximum diameter (cm)a | 3.38 (2.32-6.19) | 3.68 (2.63-5.11) | 0.60 |
| Echogenicity | 0.02 | ||
| Hyperechoic | 13 (81%) | 12 (39%) | |
| Isoechoic | 2 (13%) | 8 (26%) | |
| Hypoechoic | 1 (6%) | 11 (35%) | |
| Margins | 0.01 | ||
| Clear | 14 (88%) | 15 (48%) | |
| Unclear | 2 (12%) | 16 (52%) | |
| Morphology | 0.06 | ||
| Regular | 12 (75%) | 13 (42%) | |
| Unregular | 4 (25%) | 18 (58%) | |
| Hyperechoic ring | 0.27 | ||
| Present | 5 (31%) | 5 (16%) | |
| Absent | 11 (69%) | 26 (84%) | |
| Blood flow | > 0.99 | ||
| Present | 14 (88%) | 26 (84%) | |
| Absent | 2 (12%) | 5(16%) | |
| Larger blood vessels around lesions | 0.001 | ||
| Present | 15 (94%) | 14 (45%) | |
| Absent | 1 (6%) | 17 (55%) |
Note: Unless otherwise specified, data are the number of patients with percentages in parentheses.
aData are presented as median values with interquartile ranges.
PEComa: perivascular epithelioid cell tumor; HCC: hepatocellular carcinoma.
Figure 2 Imaging features of perivascular epithelioid cell tumor in a 69-year-old female. (A) Hyperechoic lesion located in segment 3 (arrow). (B) Presence of larger blood vessels around lesions (arrow). Contrast-enhanced ultrasound revealed (C) Rapid centripetal enhancement at 13 s (arrow), (D) Hyperenhancement in the arterial phase without necrosis at 20 s (arrow), (E) Hyperenhancement in the portal phase at 59 s (arrow), (F) Isoenhancement in the delayed phase at 183 s (arrow).
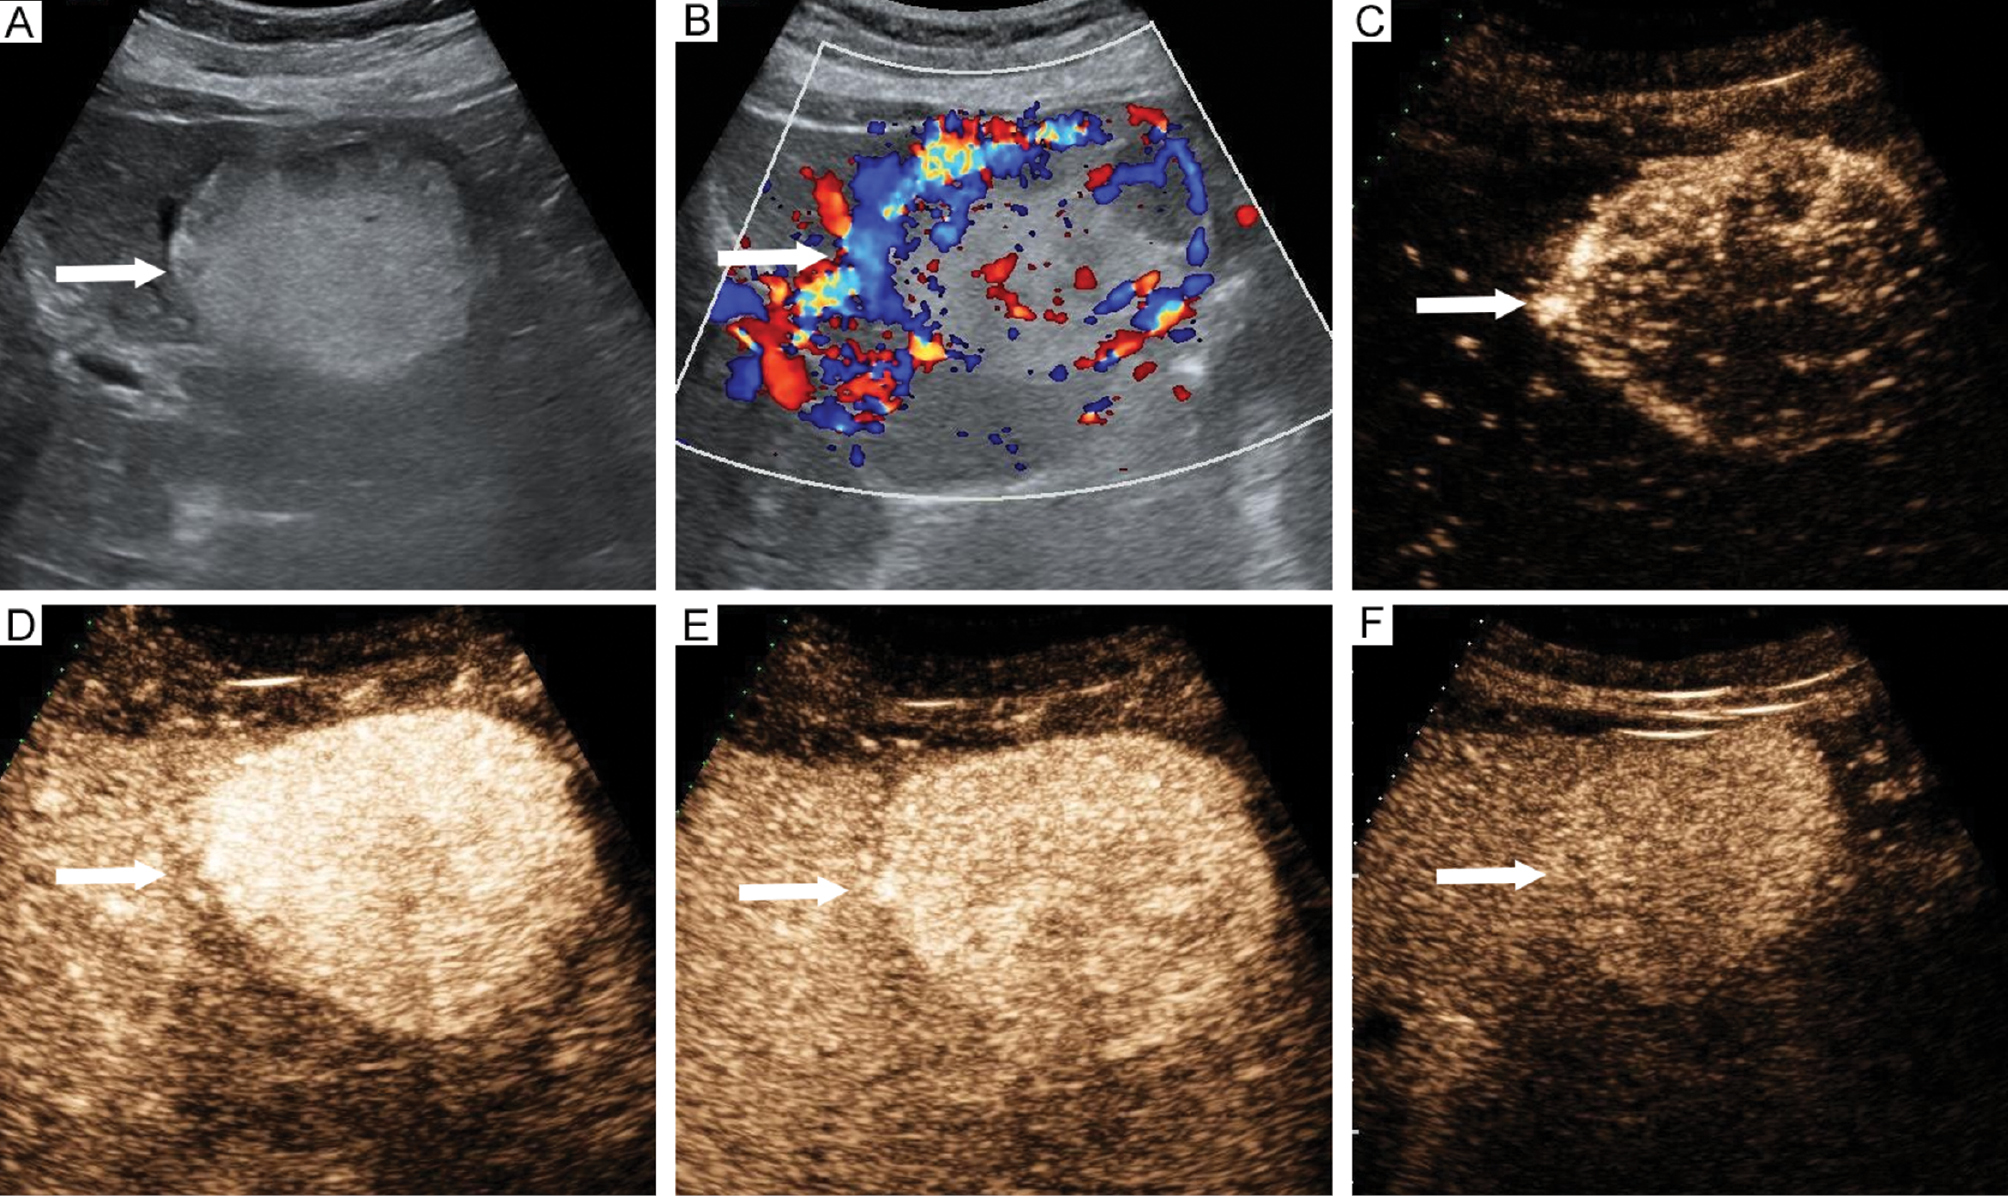
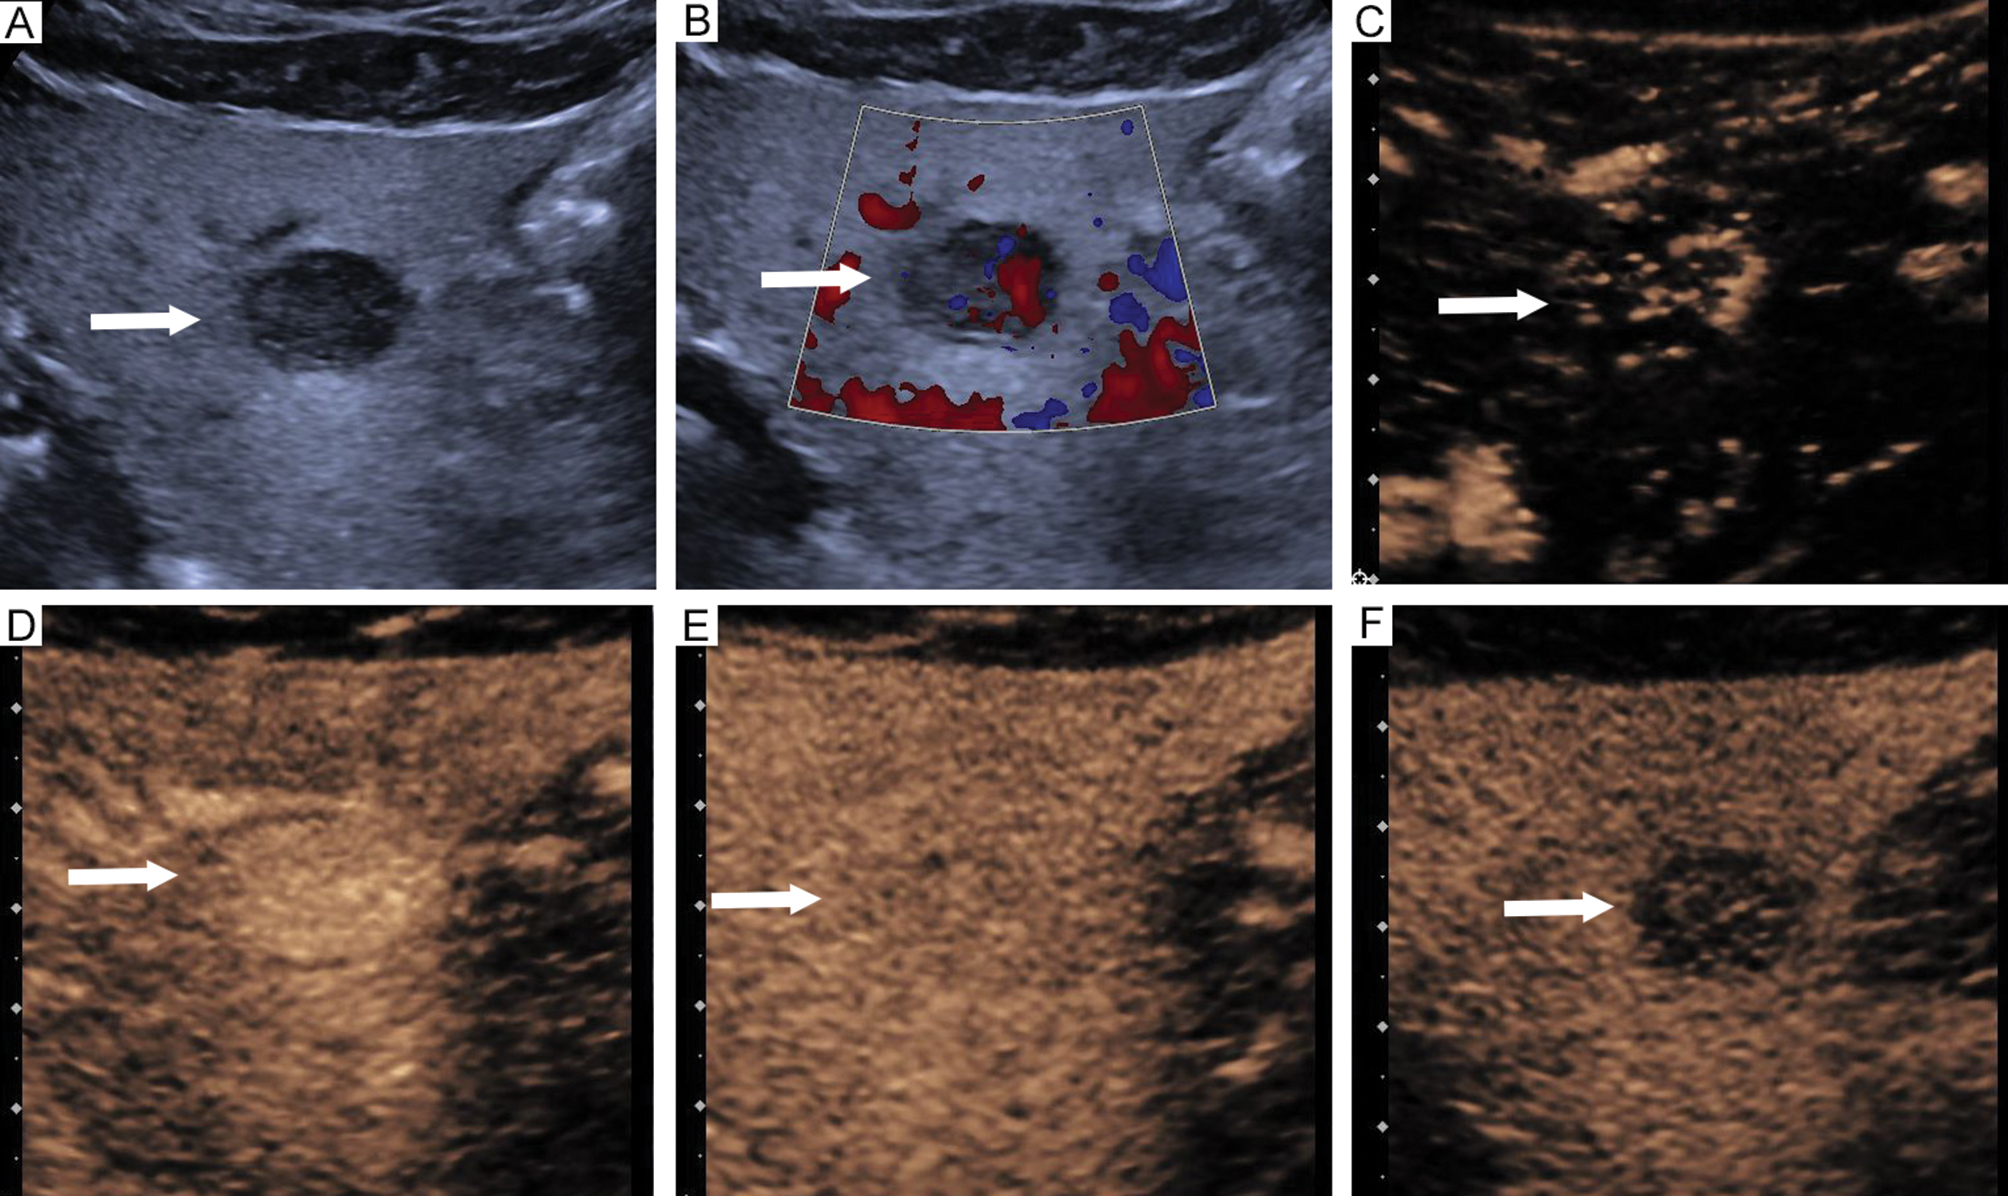
Figure 3 Imaging features of hepatocellular carcinoma in a 75-year-old male. (A) Hyperechoic lesion located in segment 3 (arrow). (B) Absence of larger blood vessels around lesions (arrow). Contrast-enhanced ultrasound revealed (C) Rapid centripetal enhancement at 15 s (arrow), (D) Hyperenhancement in the arterial phase with necrosis at 24 s (arrow), (E) Hypoenhancement in the portal phase at 67 s (arrow), (F) Hypoenhancement in the delayed phase at 171 s (arrow).
CEUS findings
Comparisons of CEUS features between the PEComa and HCC groups are provided in Table 3. Necrosis, portal phase enhancement intensity, delayed phase enhancement intensity, and washout time were significantly different between the PEComa and HCC groups (P < 0.05). PEComa lesions were characterized by the absence of necrosis, hyper- or iso-enhancement in the portal phase, isoenhancement in the delayed phase, and a washout time > 180 s compared to HCC (Figures 2 and 3). No significant differences were detected in initial enhancement time, arterial phase enhancement intensity, feeding artery, fill-in direction, enhancement mode, or pseudocapsule between the PEComa and HCC groups (P > 0.05).
Table 3 Comparation of Contrast-Enhanced Ultrasound Characteristics between PEComa and HCC without High-Risk Factors
| Characteristics | PEComa (n = 16) | HCC (n = 31) | P value |
|---|---|---|---|
| Initial enhancement time | 0.34 | ||
| Earlier | 15 (94%) | 31 (100%) | |
| Non-earlier | 1 (6%) | 0 (0%) | |
| Arterial phase enhancement intensity | 0.34 | ||
| Hyperenhancement | 15 (94%) | 31 (100%) | |
| Non-hyperenhancement | 1 (6%) | 0 (0%) | |
| Feeding artery | > 0.99 | ||
| Present | 8 (50%) | 16 (52%) | |
| Absent | 8 (50%) | 15 (48%) | |
| Fill-in direction | > 0.99 | ||
| Centripetal | 11 (69%) | 20 (65%) | |
| Non-centripetal | 5 (31%) | 11 (35%) | |
| Necrosis | 0.008 | ||
| Present | 1 (6%) | 15 (48%) | |
| Absent | 15 (94%) | 16 (52%) | |
| Enhancement mode | 0.12 | ||
| Homogeneous | 12 (75%) | 15 (48%) | |
| Heterogeneous | 4 (25%) | 16 (52%) | |
| Portal phase enhancement intensity | 0.008 | ||
| Hyperenhancement | 2 (13%) | 0 (0%) | |
| Isoenhancement | 8 (50%) | 7 (23%) | |
| Hypoenhancement | 6 (37%) | 24 (77%) | |
| Delayed phase enhancement intensity | 0.001 | ||
| Isoenhancement | 6 (37%) | 0 (0%) | |
| Hypoenhancement | 6 (37%) | 24 (77%) | |
| No enhancement | 4 (25%) | 7 (23%) | |
| Pseudocapsule | 0.23 | ||
| Present | 6 (37%) | 18 (58%) | |
| Absent | 10 (63%) | 13 (42%) | |
| Washout time | 0.001 | ||
| > 180s | 9 (56%) | 3 (10%) | |
| ≤ 180s | 7 (44%) | 28 (90%) |
Note: Data are the number of patients with percentages in parentheses.
PEComa: perivascular epithelioid cell tumor; HCC: hepatocellular carcinoma.
Diagnostic performance
Multivariate logistic regression analysis identified hyperechoic appearance, the presence of larger blood vessels around lesions, absence of necrosis, and a washout time > 180 s as independent predictive factors for PEComa diagnosis (P < 0.05; Table 4). The diagnostic performance of individual ultrasound parameters is detailed in Table 5. Among these parameters, the presence of larger blood vessels around lesions and the absence of necrosis demonstrated the highest sensitivity for diagnosing PEComa, while necrosis had the lowest specificity. Washout time > 180 s exhibited the highest specificity, although the sensitivity was relatively low. Tumor lesions were classified as PEComa when at least three predictive ultrasound parameters were present. Combining the four predictive ultrasound parameters significantly improved diagnostic performance (AUC) compared to each individual ultrasound parameters, with all comparisons showing statistically significant differences (P ≤ 0.001). The combination of CUS and CEUS achieved a sensitivity of 81.25% and a specificity of 96.77% with an AUC of 0.9395 (Figure 4). Table 6 presents the comprehensive performance evaluation and internal validation results of the combined CUS and CEUS approach. Bootstrap validation confirmed the stability because the mean performance metrics of bootstrap samples closely aligned with the original values. Optimism correction estimated the true generalization performance, which closely aligned with the original results.
Table 4 Independent Predictive Factors for Perivascular Epithelioid Cell Tumor by Multiple Logistic Regression Analysis
| Features | Coefficient | Standard error | Odds ratio | 95% CI | P value |
|---|---|---|---|---|---|
| Echogenicity | −1.39 | 0.58 | 0.25 | 0.08–0.78 | 0.02 |
| Larger blood vessels around lesions | 3.01 | 1.14 | 20.29 | 2.16–190.28 | 0.008 |
| Necrosis | −3.37 | 1.42 | 0.04 | 0.002–0.56 | 0.02 |
| Washout time | 3.36 | 1.14 | 28.77 | 3.11–266.29 | 0.003 |
Table 5 Diagnostic Performance of Ultrasound Parameters in Differentiating Perivascular Epithelioid Cell Tumor from Hepatocellular Carcinoma without High-Risk Factors
| Parameter | Sensitivity (%) | Specificity (%) | Accuracy (%) | AUC | P valuea |
|---|---|---|---|---|---|
| Echogenicity | 81.25 (54.35–95.95) | 61.29 (42.19–78.15) | 68.09 (52.88–80.91) | 0.7127 (0.5810–0.8444) | < 0.001 |
| Larger blood vessels around lesions | 93.75 (69.77–99.84) | 54.84 (36.03–72.68) | 68.09 (52.88–80.91) | 0.7429 (0.6349–0.8510) | 0.001 |
| Necrosis | 93.75 (69.77–99.84) | 48.39 (30.15–66.94) | 63.83 (48.52–77.33) | 0.7107 (60.23–81.91) | < 0.001 |
| Washout time | 56.25 (29.88–80.25) | 90.32 (74.25–97.96) | 78.72 (64.34–89.30) | 0.7329 (0.5967–0.8691) | < 0.001 |
aComparison of the AUC achieved by combining the four predictive ultrasound parameters.
AUC: area under the receiver operating characteristic curve.
Figure 4 Receiver operating characteristic curve analysis. Diagnostic performance of ultrasound parameters and the combination of CUS with CEUS. CUS: conventional ultrasound; CEUS: contrast-enhanced ultrasound.
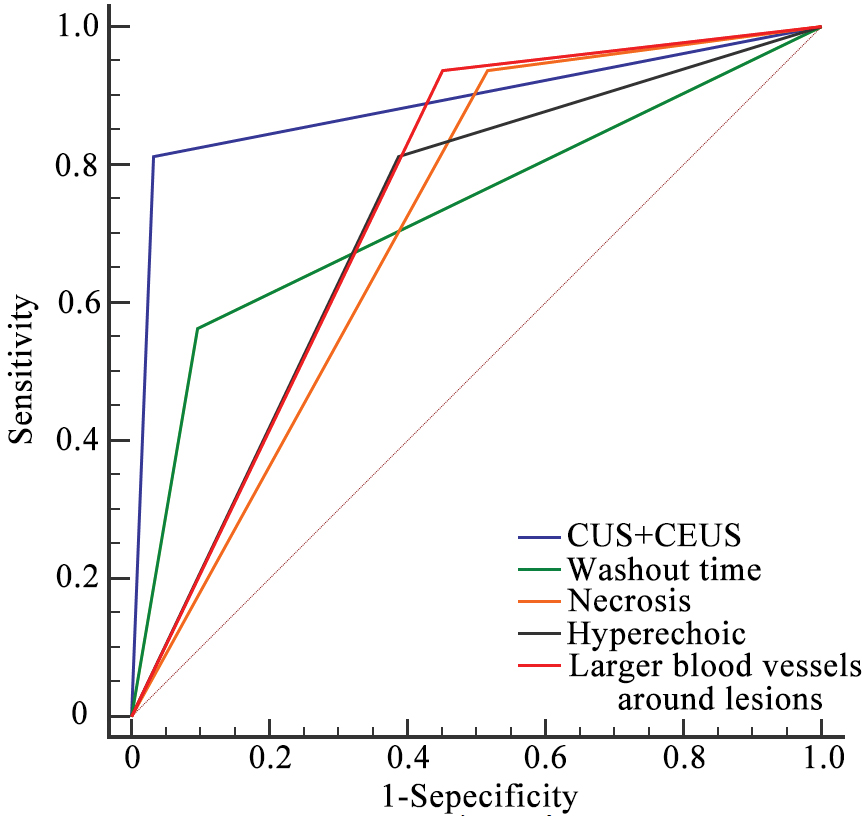
Table 6 Comprehensive Performance Evaluation and Internal Validation
| Metric | Sensitivity (%) | Specificity (%) | Accuracy (%) | AUC |
|---|---|---|---|---|
| CUS+CEUS | 81.25 (54.35–95.95) | 96.77 (83.30–99.92) | 91.49 (79.62–97.63) | 0.9395 (0.8776–100.00) |
| Bootstrap | 81.33 (60.00–100.00) | 96.79 (88.90–100.00) | 91.53 (82.98–97.87) | 0.9401 (0.8666–0.9927) |
| Optimism corrected | 80.83 (37.10–100.00) | 96.75 (85.66–100.00) | 91.40 (73.62–100.00) | 0.9377 (0.7905–100.00) |
| Optimism bias | 0.42 (−37.55 to 44.15) | 0.03 (−10.72 to 11.11) | 0.09 (−14.89 to 17.87) | 0.0018 (−0.1207 to 0.1490) |
CUS: conventional ultrasound; CEUS: contrast-enhanced ultrasound; AUC: area under the receiver operating characteristic curve.
Agreement
Inter- and intra-observer agreement for CUS and CEUS image features ranged from substantial-to-excellent (coefficients = 0.65–0.89; Table 7).
Table 7 Inter- and Intra-observer Agreement for Conventional Ultrasound and Contrast-enhanced Ultrasound Image Features
| Characteristics | Interobserver Agreement | Intraobserver Agreement |
|---|---|---|
| Maximum diameter | 0.88 (0.79–0.93) | 0.89 (0.80–0.94) |
| Echogenicity | 0.79 (0.69–0.90) | 0.80 (0.68–0.91) |
| Margins | 0.78 (0.59–0.96) | 0.78 (0.60–0.96) |
| Morphology | 0.74 (0.55–0.93) | 0.79 (0.61–0.96) |
| Hyperechoic ring | 0.71 (0.48–0.95) | 0.69 (0.44–0.94) |
| Blood flow | 0.70 (0.43–0.97) | 0.73 (0.48–0.97) |
| Larger blood vessels around lesions | 0.65 (0.44–0.87) | 0.68 (0.46–0.90) |
| Initial enhancement time | 0.66 (0.03–1.00) | 0.66 (0.03–1.00) |
| Arterial phase enhancement intensity | 0.66 (0.03–1.00) | 0.66 (0.03–1.00) |
| Feeding artery | 0.79 (0.61–0.96) | 0.79 (0.61–0.96) |
| Fill-in direction | 0.72 (0.52–0.93) | 0.73 (0.54–0.93) |
| Necrosis | 0.77 (0.59–0.96) | 0.77 (0.57–0.96) |
| Enhancement mode | 0.74 (0.54–0.93) | 0.78 (0.60–0.96) |
| Portal phase enhancement intensity | 0.83 (0.70–0.96) | 0.81 (0.68–0.94) |
| Delayed phase enhancement intensity | 0.78 (0.63–0.93) | 0.75 (0.58–0.91) |
| Pseudocapsule | 0.74 (0.55–0.93) | 0.75 (0.56–0.93) |
| Washout time | 0.76 (0.54–0.98) | 0.71 (0.48–0.95) |
Discussion
Accurate preoperative differentiation between PEComa and HCC in patients without high-risk factors is essential because the clinical management strategies differ significantly. This study demonstrated that PEComa exhibits distinct imaging features on CUS and CEUS compared to HCC in patients without high-risk factors. Specifically, PEComa lesions more frequently had a hyperechoic appearance, showed the presence of larger blood vessels around lesions on CUS, and were characterized by the absence of necrosis and prolonged washout time (> 180 s) on CEUS. The combined use of these 4 ultrasound parameters demonstrated high diagnostic performance with a sensitivity of 81.25%, a specificity of 96.77%, and an AUC of 0.9395. Bootstrap validation and optimism correction confirmed the stability and true generalization performance of the combined CUS and CEUS approach. These findings suggested that integrating CUS and CEUS is a valuable tool for distinguishing PEComa from HCC in patients without high-risk factors.
Hepatic PEComa often presents with non-specific clinical features, making the preoperative diagnosis challenging [19]. In this study patients in both groups lacked high-risk factors for HCC, such as liver cirrhosis, hepatitis virus infection, or a history of HCC. The laboratory results, including alpha-fetoprotein, carbohydrate antigen 19-9, and carcinoembryonic antigen levels, were comparable between the two groups, complicating differentiation based solely on clinical or laboratory findings. Consequently, radiologic imaging plays a critical role in distinguishing PEComa from HCC, particularly in patients without high-risk factors. As the first-line imaging modality, CUS revealed that 81% of PEComa lesions had a hyperechoic appearance compared to only 39% of HCC lesions. Hyperechoic appearance has been identified as a significant imaging feature of PEComa, which is consistent with previous studies [11, 25]. This feature may be explained by the histologic composition of PEComa lesions, which include epithelioid cells, spindle-shaped smooth muscle-like cells, and adipose tissue with varying fat content [9, 26]. The interlacing patterns of these components generate multi-interface echoes, contributing to the hyperechoic appearance on CUS [26]. However, hyperechoic appearance is not exclusive to PEComa; HCC lesions undergoing steatosis may also exhibit similar features. Therefore, hyperechoic appearance alone cannot reliably differentiate PEComa from HCC. Another important CUS feature observed in the current study was the presence of larger blood vessels around PEComa lesions, which was less frequently observed in HCC. This finding corresponds to the vascular nature of PEComa, which is often characterized by abnormal feeding arteries and draining veins [19, 27]. These vascular structures serve as a critical marker for distinguishing PEComa from HCC, in which such features are less common.
CEUS provides additional information about lesion microcirculation and perfusion, revealing features that further differentiate PEComa from HCC. Both tumor types exhibited rapid hyperenhancement in the arterial phase with no significant differences in initial enhancement time or arterial phase enhancement intensity. Hypervascularity in PEComa is attributed to its thick-walled, dilated, and distorted vascular networks, as reported in previous studies [19, 28]. Two CEUS parameters (washout time and necrosis) showed strong discriminatory power. In this study 56% of PEComa lesions demonstrated prolonged washout time (> 180 s) compared to only 10% of HCC lesions, which typically showed rapid washout in the portal or delayed phases. This prolonged washout in PEComa may reflect aberrant vascular structures, including extensive sinusoids, which delay the clearance of contrast agents [23]. In contrast, HCC is characterized by rapid washout, a hallmark of malignancy [26]. Necrosis was another key feature distinguishing PEComa from HCC. Necrosis in HCC was often visualized as irregular defect areas on CEUS, which were absent in PEComa lesions. Pathologic studies indicated that PEComa lesions often lack intratumoral necrosis, likely due to the generally low mitotic activity and less aggressive growth patterns [29]. In contrast, HCC frequently exhibits necrotic areas due to rapid growth and high metabolic demand, which outstrip the blood supply. The absence of necrosis, combined with prolonged washout time, provides a robust imaging-based framework for differentiating PEComa from HCC without high-risk factors.
Previous studies have reported sensitivities of 42.11%–88.9% and specificities of 92.3%–99.59% for CT/MRI in diagnosing PEComa [11, 19, 30]. The combined use of CUS and CEUS demonstrated comparable diagnostic performance for distinguishing PEComa from HCC, particularly in patients without high-risk factors. Accurate preoperative diagnosis of PEComa is crucial for optimizing treatment strategies because surgical resection remains the primary intervention for PEComa, while HCC management often involves multimodal therapies. This study highlighted the potential of ultrasound-based modalities to guide clinical decision-making, particularly in cases in which laboratory findings and clinical history provide limited diagnostic insights.
This study had several limitations. First, this was a single-center, retrospective study conducted in a setting where PEComa cases are rare. The small sample size (n = 16) poses significant challenges, including the introduction of selection bias and limited generalizability. The limited cohort size reduces the statistical power of some analyses and increases the risk of overfitting in the multivariable logistic regression analysis, particularly given the low events-per-variable ratio. While bootstrap resampling was used for internal validation, this method cannot fully mitigate the potential instability and variance inflation caused by the sparse data. The wide confidence intervals observed in the diagnostic performance metrics, particularly for sensitivity estimates, further highlight the uncertainty associated with the small sample size. Second, significant differences in gender, age, and platelet count between the PEComa and HCC groups reflect the natural epidemiology of these diseases. While these differences are unavoidable due to the rarity of PEComa and the clinical characteristics of HCC, the differences may introduce diagnostic bias and residual confounding during imaging evaluation. Finally, this study did not include direct comparisons with CT or MRI modalities due to the retrospective design and incomplete multimodal imaging data. Future studies should focus on larger, multi-center cohorts to validate these findings and improve generalizability. Prospective research with matched clinical and demographic characteristics between PEComa and HCC groups is needed to confirm the independence of key imaging features identified in this study. In addition, direct comparisons of CUS and CEUS with CT, MRI, and histopathology would further strengthen the diagnostic value of ultrasound-based modalities in distinguishing PEComa from HCC.
In summary, this preliminary study demonstrated that the integration of CUS and CEUS is highly effective in distinguishing PEComa from HCC in patients without high-risk factors. Key imaging features, including hyperechoic appearance, the presence of larger blood vessels around lesions, absence of necrosis, and prolonged washout time, serve as initial diagnostic indicators for PEComa. These findings highlight the critical role of imaging in preoperative diagnosis, enabling precise differentiation between PEComa and HCC and supporting appropriate clinical management strategies.
Data availability statement
The raw data and analysis scripts are available from the corresponding author upon reasonable request.
Ethics statement
This study was approved by the Ethics Committee of the Chinese PLA General Hospital (Approval No. S2024-369-01).
Author contributions
Xiang Fei and Nan Li contributed equally. Xiang Fei, Nan Li, and Lianhua Zhu were primarily responsible for the study design, data analysis, and interpretation of results. Xiang Fei, Nan Li, and Bo Jiang contributed to the investigation, data collection, and initial manuscript drafting. Lianhua Zhu provided critical revisions to the manuscript. Yaqiong Zhu, Peng Han, and Miao Li assisted with the statistical analysis and manuscript refinement. All authors reviewed and approved the final manuscript.
Funding
No funding or sponsorship was received for this study.
Conflict of interest
The authors declare that there are no conflicts of interest.
Graphical abstract
Highlights
- Integrating conventional ultrasound and contrast-enhanced ultrasound identified distinctive imaging features, including hyperechoic appearance, larger blood vessels around lesions, absence of necrosis, and prolonged washout time, enhancing diagnostic precision.
- This diagnostic approach achieved high specificity and accuracy, providing a reliable, non-invasive tool for accurate preoperative differentiation and optimized clinical management.
In brief
This study demonstrated that combining conventional ultrasound and contrast-enhanced ultrasound improves the diagnostic accuracy for distinguishing hepatic perivascular epithelioid cell tumors from hepatocellular carcinoma in patients without high-risk factors.
References
- Algashaamy K, Montgomery EA, Garcia-Buitrago M. Liver mesenchymal neoplasms: something old, something new. Pathology 2022;54:225-35. [PMID: 34965900 DOI: 10.1016/j.pathol.2021.09.022]
- Amante MF. Hepatic perivascular epithelioid cell tumors: benign, malignant, and uncertain malignant potential. World J Gastroenterol 2024;30:2374-8. [PMID: 38764772 DOI: 10.3748/wjg.v30.i18.2374]
- Zhang S, Yang PP, Huang YC, Chen HC, Chen DL, et al. Hepatic perivascular epithelioid cell tumor: clinicopathological analysis of 26 cases with emphasis on disease management and prognosis. World J Gastroenterol 2021;27:5967-77. [PMID: 34629813 DOI: 10.3748/wjg.v27.i35.5967]
- Zhu D, Song S, Wang D, Kuang D, Cheng S, et al. Hepatic perivascular epithelioid cell tumor resembling hepatic adenoma and hepatocellular carcinoma on preoperative imaging: a case report. Front Oncol 2024;14:1292313. [PMID: 38361782 DOI: 10.3389/fonc.2024.1292313]
- Guo YL, Dang Y, Zhang H, Lian J. Contrast-enhanced ultrasound of a hepatic perivascular epithelioid cell tumor: a case report and literature review. Cureus 2025;17:e81579. [PMID: 40313453 DOI: 10.7759/cureus.81579]
- Sarangi S, Thirunavukkarasu B, Khera S, Selvakumar B, Yadav T. Vascular tumors of the liver: a brief review. Ann Hepatobiliary Pancreat Surg 2023;27:329-41. [PMID: 37953709 DOI: 10.14701/ahbps.23-046]
- Yang W, Sun Q, Shang M, Li S, Hu X, et al. Multimodal imaging study of hepatic perivascular epithelioid cell tumors: a case report. Front Med (Lausanne) 2023;10:1322048. [PMID: 38173942 DOI: 10.3389/fmed.2023.1322048]
- Cheng Z, Zhou J, Kuang D, Zuo R, Zhu D, et al. Performance of [68Ga]Ga-FAPI-04 PET/CT imaging in hepatic vascular-associated mesenchymal tumor: comparison with [18F]FDG PET/CT. Eur J Nucl Med Mol Imaging 2025. [PMID: 40702227 DOI: 10.1007/s00259-025-07446-1]
- Huang Z, Wu X, Li S, Li K. Contrast-enhanced ultrasound findings and differential diagnosis of hepatic epithelioid angiomyolipoma compared with hepatocellular carcinoma. Ultrasound Med Biol 2020;46:1403-11. [PMID: 32165015 DOI: 10.1016/j.ultrasmedbio.2020.02.001]
- Tan Y, Xie XY, Li XJ, Liu DH, Zhou LY, et al. Comparison of hepatic epithelioid angiomyolipoma and non-hepatitis B, non-hepatitis C hepatocellular carcinoma on contrast-enhanced ultrasound. Diagn Interv Imaging 2020;101:733-8. [PMID: 32331793 DOI: 10.1016/j.diii.2020.03.005]
- Li R, Tang CL, Zhang Y, Ma KS, Zhang XH, et al. Diagnosis of hepatic angiomyolipoma by combination of baseline and contrast-enhanced ultrasound–a prospective study in non-cirrhotic patients. PLoS One 2015;10:e0132290. [PMID: 26147859 DOI: 10.1371/journal.pone.0132290]
- Chernyak V, Fowler KJ, Kamaya A, Kielar AZ, Elsayes KM, et al. Liver Imaging Reporting and Data System (LI-RADS) version 2018: imaging of hepatocellular carcinoma in at-risk patients. Radiology 2018;289:816-30. [PMID: 30251931 DOI: 10.1148/radiol.2018181494]
- Moris D, Martinino A, Schiltz S, Allen PJ, Barbas A, et al. Advances in the treatment of hepatocellular carcinoma: an overview of the current and evolving therapeutic landscape for clinicians. CA Cancer J Clin 2025;75:498-527. [PMID: 40392748 DOI: 10.3322/caac.70018]
- Singal AG, Kanwal F, Llovet JM. Global trends in hepatocellular carcinoma epidemiology: implications for screening, prevention and therapy. Nat Rev Clin Oncol 2023;20:864-84. [PMID: 37884736 DOI: 10.1038/s41571-023-00825-3]
- Li Z, Zhou Y, Wang C, Yu H, Yang G, et al. Insights into clinical diagnosis and treatment of malignant hepatic perivascular epithelioid cell tumor. Intractable Rare Dis Res 2022;11:202-5. [PMID: 36457582 DOI: 10.5582/irdr.2022.01111]
- Tan L, Wu SJ, Qiu Y, Jie Y, Zhang S, et al. Preliminary investigation into ultrasound and MRI presentation of large-cell neuroendocrine carcinomas of the uterine cervix. BIO Integration 2023;4:180-5. [DOI: 10.15212/bioi-2022-0028]
- Zhu L, Jiang B, Fei X, Xu Y, Liu Z, et al. Contrast-enhanced US evaluation of residual hepatocellular carcinoma following lenvatinib combined with anti-PD-1 antibody downstaging therapy. Radiology 2025;317:e251698. [PMID: 41400470 DOI: 10.1148/radiol.251698]
- Zhu L, Li N, Liang S, Jiang B, Li M, et al. High frame rate contrast-enhanced ultrasound in hepatocellular carcinoma: biological characteristics and patient outcomes. BMC Cancer 2025;25:1488. [PMID: 41034821 DOI: 10.1186/s12885-025-14907-1]
- Ma R, Feng ST, Zhou X, Chen M, Wang J, et al. Hepatic pecoma versus hepatocellular carcinoma in the noncirrhotic liver on Gd-EOB-DTPA-enhanced MRI: a diagnostic challenge. Curr Med Imaging 2024;20:e15734056269369. [PMID: 38415458 DOI: 10.2174/0115734056269369231213102554]
- Matrood S, Görg C, Safai Zadeh E, Alhyari A. Hepatic perivascular epithelioid cell tumor (PEComa): contrast-enhanced ultrasound (CEUS) characteristics-a case report and literature review. Clin J Gastroenterol 2023;16:444-9. [PMID: 36964879 DOI: 10.1007/s12328-023-01779-w]
- Li C, Xu JY, Liu Y. Sonazoid-enhanced ultrasonography and pathologic characters of CD68 positive cell in primary hepatic perivascular epithelioid cell tumors: a case report and literature review. Open Med (Wars) 2021;16:737-41. [PMID: 34013045 DOI: 10.1515/med-2021-0275]
- Dietrich CF, Nolsøe CP, Barr RG, Berzigotti A, Burns PN, et al. Guidelines and good clinical practice recommendations for contrast enhanced ultrasound (CEUS) in the liver – update 2020 – WFUMB in cooperation with EFSUMB, AFSUMB, AIUM, and FLAUS. Ultraschall Med 2020;41:562-85. [PMID: 32707595 DOI: 10.1055/a-1177-0530]
- Gao X, Tang H, Wang J, Yao Q, Wang H, et al. Specific imaging features indicate the clinical features of patients with hepatic perivascular epithelioid cell tumor by comparative analysis of CT and ultrasound imaging. Front Oncol 2022;12:908189. [PMID: 36324566 DOI: 10.3389/fonc.2022.908189]
- Wu W, Jing X, Xue GQ, Zhu XL, Wang J, et al. A multicenter randomized controlled study of contrast-enhanced US versus US-guided biopsy of focal liver lesions. Radiology 2022;305:721-8. [PMID: 35916680 DOI: 10.1148/radiol.212317]
- Huang Z, Zhou P, Li S, Li K. Hepatic angiomyolipoma: clinical features and imaging findings of quantitative contrast-enhanced ultrasound perfusion analysis and magnetic resonance imaging. J Ultrasound Med 2020;39:2111-22. [PMID: 32383807 DOI: 10.1002/jum.15316]
- Li R, Tang CL, Cai P, Ma KS, Zhang XH, et al. Comparison of CT and contrast-enhanced ultrasound findings in hepatic angiomyolipoma with pathological correlations. Abdom Radiol (NY) 2016;41:248-56. [PMID: 26867906 DOI: 10.1007/s00261-015-0571-0]
- Fan PL, Ji ZB, Cao JY, Xu C, Dong Y, et al. Baseline and contrast-enhanced ultrasound features of hepatic epithelioid angiomyolipoma. Clin Hemorheol Microcirc 2022;80:447-61. [PMID: 34864652 DOI: 10.3233/CH-211305]
- Chen W, Liu Y, Zhuang Y, Peng J, Huang F, et al. Hepatic perivascular epithelioid cell neoplasm: a clinical and pathological experience in diagnosis and treatment. Mol Clin Oncol 2017;6:487-93. [PMID: 28413654 DOI: 10.3892/mco.2017.1168]
- Wei RX, Wang WP, Ding H, Huang BJ, Li CL, et al. Hepatic angiomyolipoma: contrast patterns with sonoVue-enhanced real-time gray-scale ultrasonography. Asian Pac J Cancer Prev 2012;13:493-7. [PMID: 22524813 DOI: 10.7314/apjcp.2012.13.2.493]
- Park S, Kim MJ, Han K, Park JH, Han DH, et al. Differentiation between hepatic angiomyolipoma and hepatocellular carcinoma in individuals who are not at-risk for hepatocellular carcinoma. Eur J Radiol 2023;166:110957. [PMID: 37451136 DOI: 10.1016/j.ejrad.2023.110957]