Development and Validation of a Bioanalytical Method for Estimating Ellagic Acid in Wistar Rat Plasma by RP-HPLC Using a Gradient Elution Technique
1Satara College of Pharmacy, Degaon, Satara, Maharashtra 415004, India
2Department of Pharmaceutics, Krishna Institute of Pharmacy, Krishna Vishwa Vidyapeeth (Deemed to be University), Karad-415539, Maharashtra, India
*Correspondence to: Varsha Mane, Satara College of Pharmacy, Degaon, Satara, Maharashtra 415004, India, Mobile: +91-9960589356. E-mail: varsha.mane76@gmail.com
Received: May 30 2024; Revised: July 30 2024; Accepted: August 5 2024; Published Online: August 26 2024
Cite this paper:
Mane V, Aloorkar N, Ghorpade V et al. Development and Validation of a Bioanalytical Method for Estimating Ellagic Acid in Wistar Rat Plasma by RP-HPLC Using a Gradient Elution Technique. BIO Integration 2024; 5: 1–8.
DOI: 10.15212/bioi-2024-0029. Available at: https://bio-integration.org/
Download citation
© 2024 The Authors. This is an open access article distributed under the terms of the Creative Commons Attribution License (https://creativecommons.org/licenses/by/4.0/). See https://bio-integration.org/copyright-and-permissions/
Abstract
Background: Ellagic acid (EA) is a natural polyphenolic compound recognized for bioactive and pharmacologic properties that is found abundantly in various plant groups, particularly eudicotyledons. In the current study a novel, reliable, and cost-effective bioanalytical method was developed for quantifying EA in Wistar rat plasma using RP-HPLC.
Methods: Zorbax SB C18 (5μ, 4.6150 mm) and Ascentis C18 (5μ, 1004.6 mm) columns were used in the stationary phase, while the mobile phase consisted of water with 0.1 % formic acid (A) and acetonitrile (ACN) with 0.08% formic acid (B).
Results: Optimized parameters were as follows: temperature, 30°C; flow rate, 1.0 ml/min; and PDA detectors, 254 nm. The method exhibited high linearity (r2 = 0.9993) between 5 and 300 μg/ml. Precision, both intra- and inter-day, was within acceptable limits (relative standard deviation <2%), and the mean recovery was 99.73%. The LOD and LOQ were 1.564 ± 0.026 μg/ml and 5.015 ± 0.025 μg/ml, respectively. Stability tests, including short- and long-term evaluations, demonstrated stability under various conditions.
Conclusion: The developed method met the necessary criteria and holds promise for application in clinical laboratories for assessing EA levels, either alone or with analytes.
Keywords
Ellagic acid, HPLC, ICH, plasma, validation.
Introduction
Ellagic acid (EA) is a natural polyphenolic compound recognized for bioactive and pharmacologic properties that is found abundantly in various plant groups, particularly eudicotyledons [1]. EA holds significance in the pharmaceutical and cosmetics industries, which has prompted exploration of diverse plant species to identify new sources for human nutrition and raw materials for functional supplements and nutraceuticals. Renowned for its antioxidant, anti-mutagenic, and anti-cancer attributes, EA stands out as a highly stable molecule with lipophilic and hydrophilic domains composed of four rings, four phenolic, and two lactone groups. The potent antioxidant, anti-inflammatory, anti-mutagenic, and anti-proliferative characteristics coupled with therapeutic potential across various human diseases have garnered considerable research attention in recent years [2].
Utilizing thoroughly validated and well-characterized bioanalytical methods is crucial for generating reliable and interpretable results. These methods continually evolve and improve, often at the forefront of technological advancements. It is important to note that each bioanalytical technique possesses unique characteristics, which may vary depending on the analyte being studied. Consequently, specific validation criteria might need development for individual analytes. Furthermore, the suitability of a technique can be influenced by the overarching objectives of the current study [3].
It is imperative to validate the bioanalytical methods at each site and furnish appropriate validation data to ensure inter-laboratory reliability in studies in which sample analysis occurs across multiple sites. A limited number of UV and HPLC techniques exist for estimating EA alone or in combination with different dosage forms [4]. Notably, there is still a gap in the literature with respect to the development of a bioanalytical technique for measuring EA in rat plasma [5]. To close this gap, a simple, accurate, and sensitive bioanalytical RP-HPLC method is needed.
The objective of this work was to develop and test a new bioanalytical HPLC technique for measuring EA in rat plasma. The approach is intended to be simple, economical, sensitive, sturdy, and long-lasting.
Materials and methods
Materials
Standard EA was gifted by Sigma-Aldrich (Mumbai, Maharashtra, India). HPLC grade formic acid, methanol, and acetonitrile (ACN) were obtained from Merck (Mumbai, Maharashtra, India). The remaining chemicals used in experiments were of analytical grade.
Plasma sample preparation
A 5% EDTA solution was added to centrifuge tubes with the blood from Wistar rats. Following 1 min of vortex agitation, the material was centrifuged for 10 min at 10,000 rpm and 4 °C. The supernatant was collected and kept at −80°C until further use [6].
EA standard stock solution (SSS) preparation
An EA SSS was prepared by accurately weighing 400 mg of pure EA and transferring the EA into a 100-ml volumetric flask. After adding 25 ml of methanol, the mixture was sonicated for 5 min. Methanol was then added to a volume to 100 ml. The solution was filtered using Whatman No. 41 filter paper. The resulting average stock solution had a concentration of 4000 μg/ml.
Preparation of EA working standard solutions
SSS (0.3125, 0.625, 1.563, 3.125, 6.25, 9.375, 12.5, 15.625, and 18.75 ml [4000 μg/ml]) was placed into separate 25 ml volumetric flasks and diluted with methanol to achieve 50, 100, 2500, and 3000 μg/ml concentrations.
Sample preparation for linearity and quality control
Blank plasma (2.7 ml) was mixed with 0.3 ml of working standard solutions. Each concentration was prepared by transferring 0.3 ml of the standard solution into separate 10-ml Eppendorf tubes, followed by spiking with 2.7 ml of blank plasma. Subsequently, 3 ml of methanol was added to each tube and the contents were vortex-agitated for 1 min. The solutions were then centrifuged at 10,000 rpm for 20 min at 5°C using a Remi centrifuge (Mumbai, Maharashtra, India). The resulting clear supernatant (3 ml) from each tube was transferred to new Eppendorf tubes. The clear supernatants were passed through a 0.42-mm membrane filter paper for filtration prior to HPLC loading. The final linearity and quality control samples were prepared at concentrations ranging from 5–300 μg/ml.
Optimized chromatographic conditions
The optimized chromatographic conditions were derived based on several trials. The amount of EA in plasma was determined (Waters 2695 Alliance; Milford, MA, USA) using HPLC. Columns from Ascentis (C18, 5 μ, 100 × 4.6 mm; Bellefonte, PA, USA) and Zorbax SB (C18, 5 μ, 4.6 × 150 mm; Santa Clara, CA, USA) were utilized. The column temperature was maintained at 30 °C. The mobile phase flow rate was fixed at 1.0 ml/min. A PDA-style detector was used at 254 nm. The experiments were performed using gradient chromatographic methods. ACN containing 0.08% formic acid (B) and water containing 0.1% formic acid (A) made up the mobile phase. The components of the mobile phase were changed while maintaining a constant flow rate.
Validation
Linearity
Nine control samples for linearity and quality were created by mixing different volumes of working standard solutions with 2.7 ml of blank rat plasma. After agitation for 1 min on a vortex shaker, the solutions underwent centrifugation to obtain clear supernatants, which were then transferred to Eppendorf tubes. These samples had EA concentrations ranging from 5–300 μg/ml. Plotting peak area versus concentration using three replicates for every sample allowed linearity assessment. The concentration of EA in each sample was determined using the resulting regression equation. The linearity curve was considered legitimate if all the answers showed a relative standard deviation (RSD) <15% [7].
Specificity or selectivity
Specificity and selectivity were assessed by analyzing the chromatogram of blank Wistar rat plasma in triplicate without EA. Plasma samples spiked with EA were then examined to identify interfering co-eluting peaks in the rat plasma chromatogram. The retention time (RT) of the EA chromatographic peak was determined. To determine method specificity, adjustments were made to the HPLC method, including altering gradient slopes, to detect interference from endogenous substances causing co-eluting peaks in the chromatogram [8].
Accuracy and precision
Accuracy and precision were evaluated through five replicates for intra- and inter-day assessments. This evaluation included 4 different quality control (QC) levels: 300 μg/ml (high-quality control [HQC]); 150 μg/ml (medium-quality control [MQC]); 50 μg/ml (low-quality control [LQC]); and 5 μg/ml (lower limit of quantification [LLOQ]). The amount of plasma retrieved was calculated utilizing a regression equation. Precision was expressed as the % RSD and accuracy was expressed as the % recovery [9].
Recovery study
A recover study was undertaken across three distinct QC concentrations: 300 μg/ml (HQC); 150 μg/ml (MQC); and 50 μg/ml (LQC). Initially, EA was introduced into blank plasma at the three QC levels and the concentrations were determined utilizing the established HPLC bioanalytical method chromatogram. Identical standard concentration solutions were subsequently prepared without the biological matrix. To determine the EA extraction efficiency, the EA concentration ratio with and without the biological matrix was then calculated [10].
Limit of detection (LOD)
The LOD involves determining the amount of an analyte in a sample at the lowest detectable level, although the LOD is seldom quantified. By injecting 1.5 μg/ml of EA 3 times into a plasma sample and comparing the chromatograms to the blank plasma, the LOD was determined [11].
Limit of quantification (LOQ)
The LOQ was accomplished by comparing the peak areas of plasma samples that were spiked with EA at the LLOQ level with the blank plasma samples in triplicate [12].
Ruggedness
Two separate operators evaluated the proposed process using separate columns of the same manufacturer with different reagents and solvents. EA was spiked into rat plasma at 2 quality control concentration levels: HQC at 300 μg/ml; and LQC at 50 μg/ml [12].
Robustness
Robustness gauges the ability to withstand slight, intentional variations in method parameters. In the current study various critical parameters, like mobile phase composition, flow rate, and column temperature, varied by ± 5%, ± 10%, and ± 10% respectively, with the resulting chromatograms compared to the normal chromatograms. EA was spiked into rat plasma at 300 μg/ml (HCQ) and 50 μg/ml (LQC) [13].
Stability study
Before analysis, LQC and HQC samples were kept for 6 h and 10 d at room temperature (25°C) to test short- and long-term stability, respectively. In addition, the samples were kept in an auto sampler tray at 5°C for a full day to assess auto sampler stability. LQC and HQC samples were kept at room temperature for benchtop stability testing. To evaluate the freeze-thaw stability of EA in plasma, LQC and HQC samples underwent three cycles of freezing and thawing. After each cycle, the samples were removed from the deep freezer at regular intervals and allowed to thaw at room temperature for 1 h. The stability of EA at LQC and HQC levels was then measured and compared to typical content in plasma [14].
Results and discussion
Validation of the bioanalytical method
Linearity
The EA linearity study was studied by plotting calibration curves in rat plasma. The linearity was excellent over a 5–300 μg/ml concentration with an R2 of 0.9993. The overlay spectra and calibration curve are presented in Figure 1. The linear equation was Y = 25683.09 X – 199830.75 with an intercept of −199830.75 and a slope of 25683.09. The RT was 4.728 min. The resulting standard deviation (SD) was <2%. The % RSD was <2% with an accuracy between 99% and 101%, as shown in Table 1. The optimized chromatographic conditions of the bioanalytical method are presented in Table 2.
Figure 1 Overlay spectra of ellagic acid linearity at different concentrations.
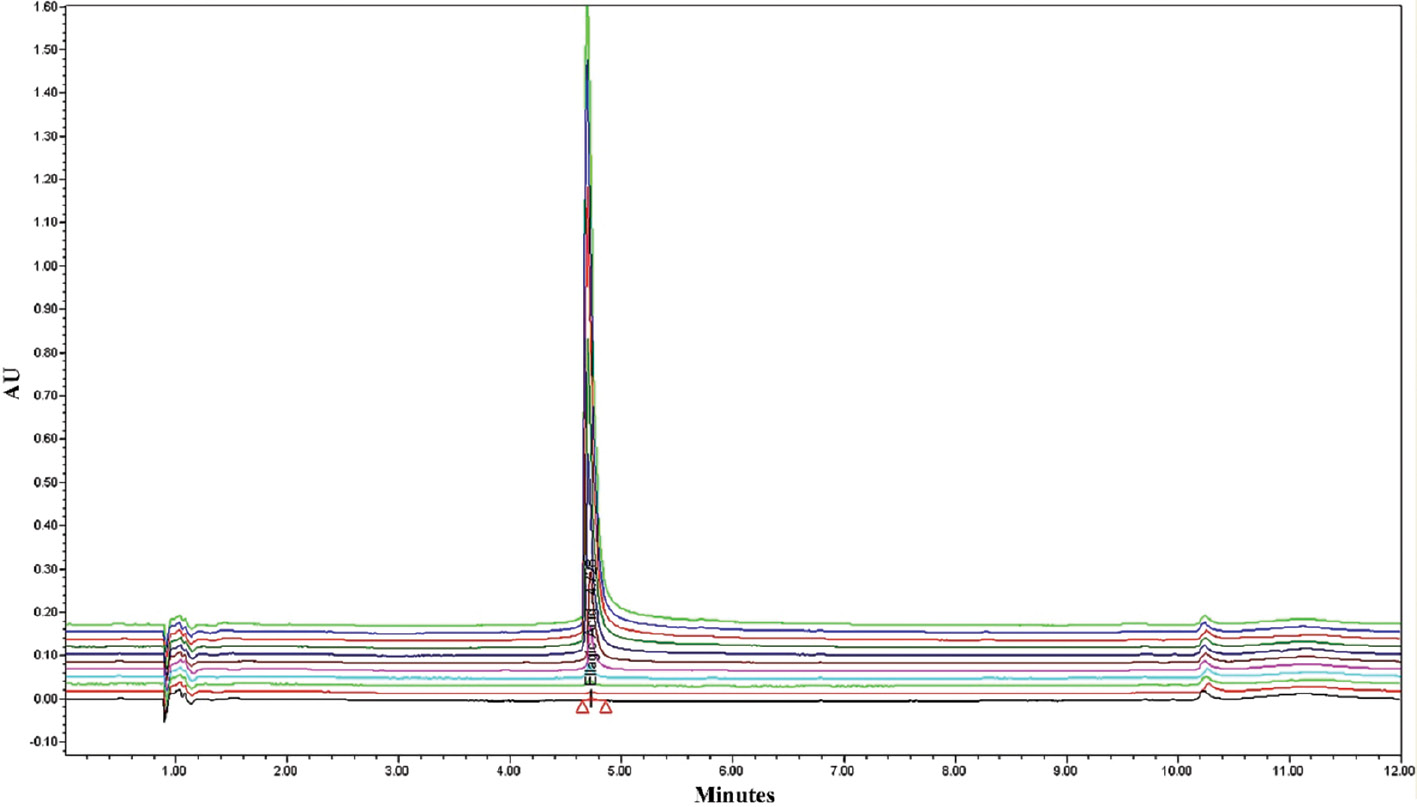
Table 1 Linearity Observations with RSD and Accuracy
| Conc (μg/ml) | Measured Conc (n = 3; μg/ml) | RSD (%) | Accuracy (%) |
|---|---|---|---|
| 5 | 4.96 ± 0.076 | 1.528 | 99.2 |
| 10 | 10.06 ± 0.1758 | 1.747 | 100.6 |
| 25 | 24.93 ± 0.4371 | 1.754 | 99.72 |
| 50 | 50.06 ± 0.8403 | 1.679 | 100.12 |
| 100 | 99.94 ± 0.9218 | 0.9224 | 99.94 |
| 150 | 149.8 ± 0.7271 | 0.4855 | 99.86 |
| 200 | 199.8 ± 0.7612 | 0.3810 | 99.9 |
| 250 | 249.8 ± 0.5953 | 0.2384 | 99.92 |
| 300 | 300.1 ± 0.3570 | 0.1190 | 100.03 |
Table 2 Optimized Conditions of the Bioanalytical Method
| Parameters | Optimized Parameters |
|---|---|
| Chromatograph | Waters 2695 alliance |
| Software | Empower 2 |
| Method | Gradient |
| Column | Zorbax SB C18 (5μ, 4.6 × 150 mm) and Ascentis C18 (5μ, 100 × 4.6 mm |
| Flow rate | 1.0 ml/min |
| Temp. | 30°C |
| Detector | W2996 PDA |
| Wavelength | 254 nm |
| Injection volume | 5.00 μl |
| Mobile phase | Water with 0.1% FA: ACN with 0.08 % FA |
| Run time | 12 min |
Specificity or selectivity
The method was shown to be highly specific and selective without interference of impurity.
Figures 2–4 displayed blank plasma and EA-treated plasma at three QC levels.
Figure 2 Standard EA chromatogram at 50 μg/ml; Rt = 4.728 min.
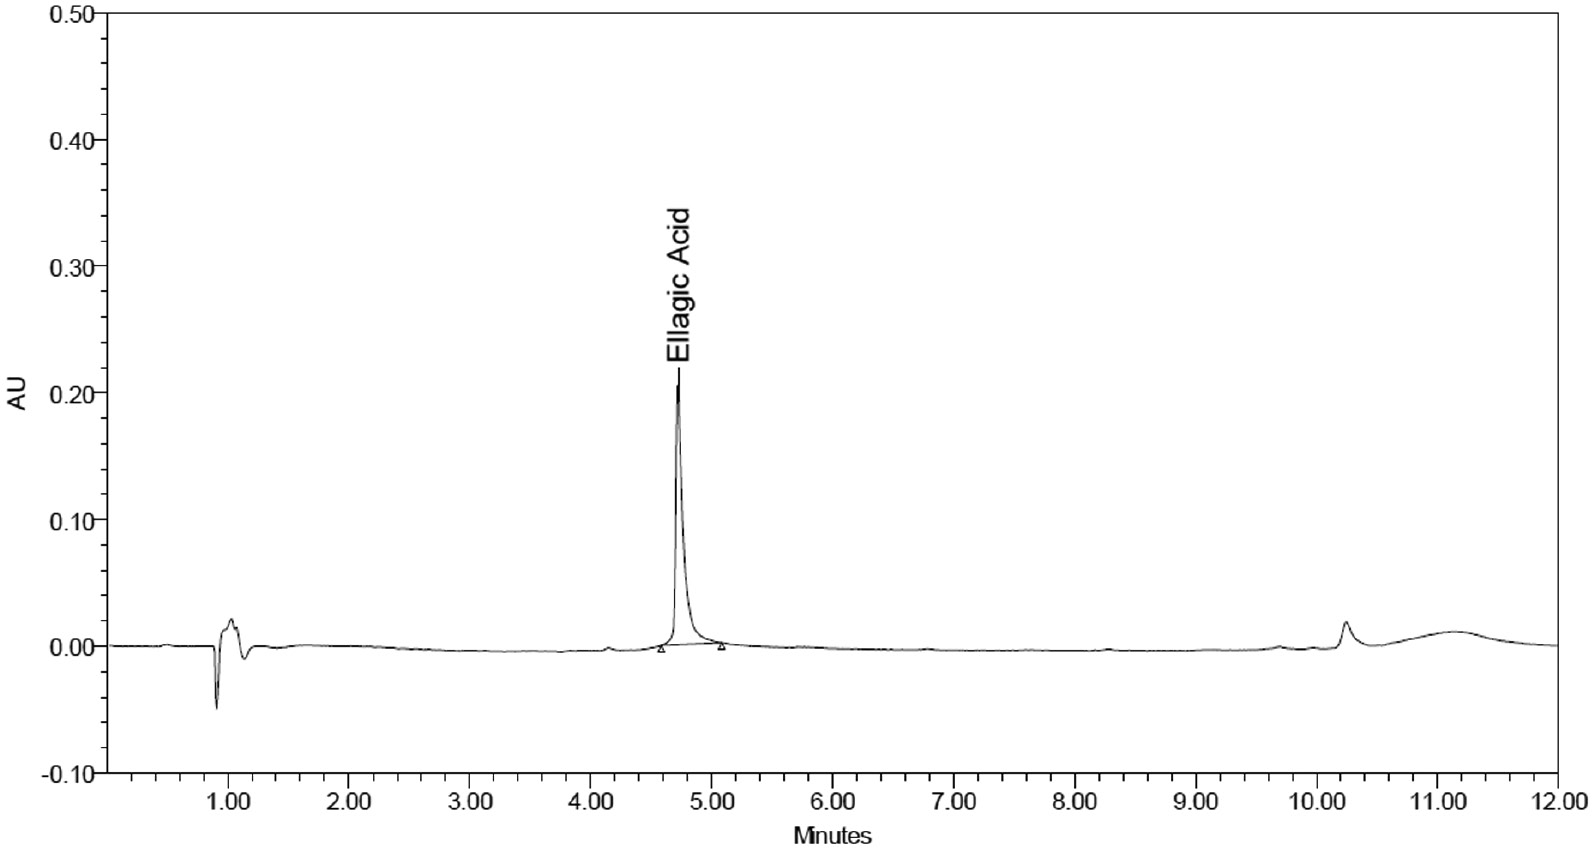
Figure 3 Chromatogram of standard EA at 150 μg/ml; Rt = 4.728 min.
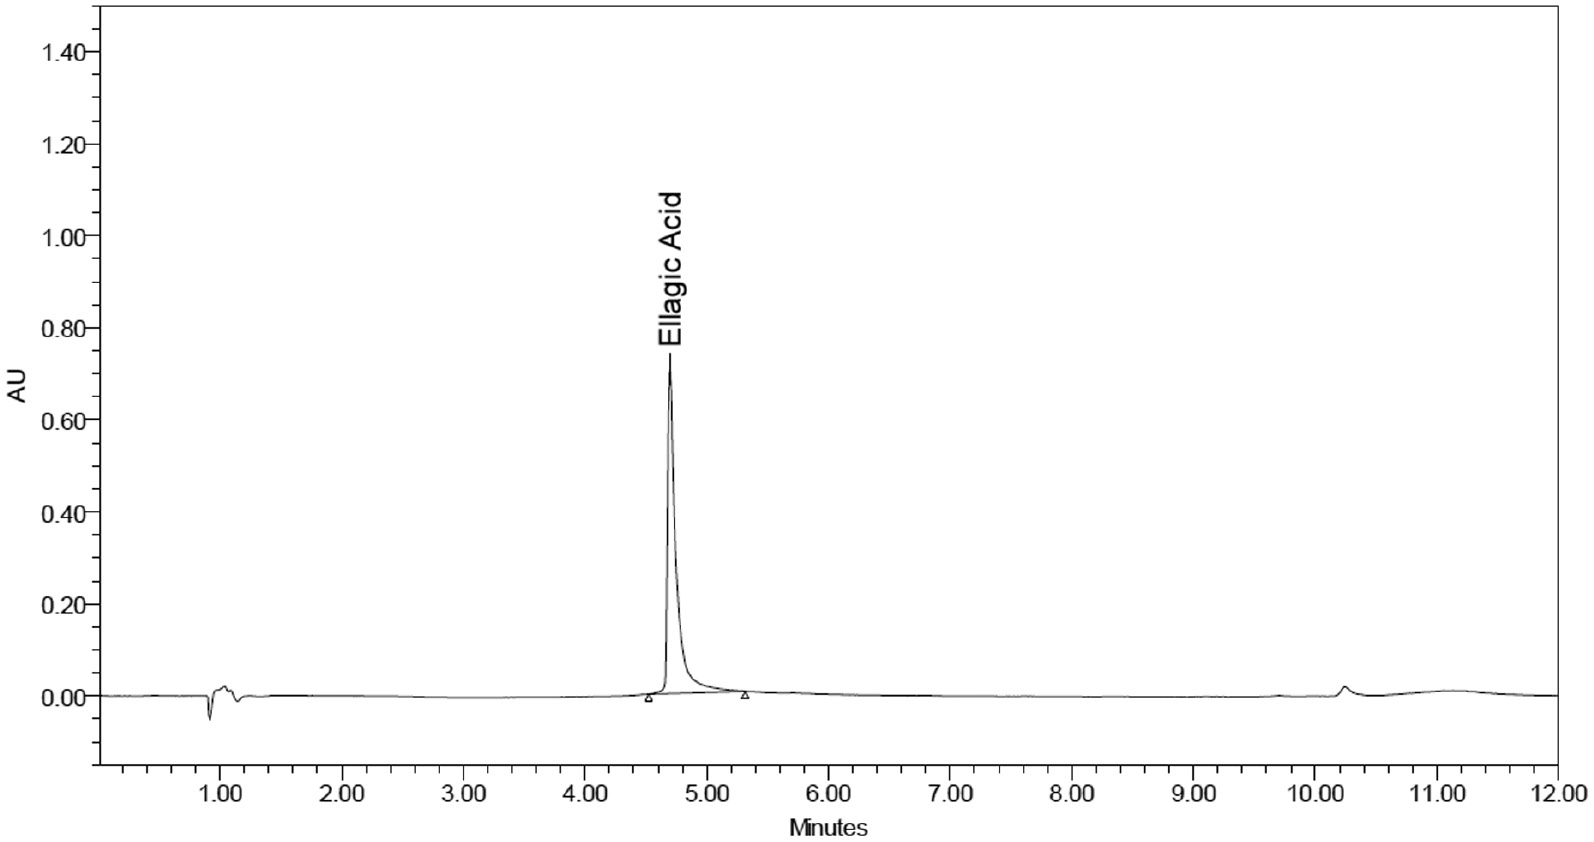
Figure 4 Chromatogram of standard EA at 300 μg/ml; Rt = 4.728 min.
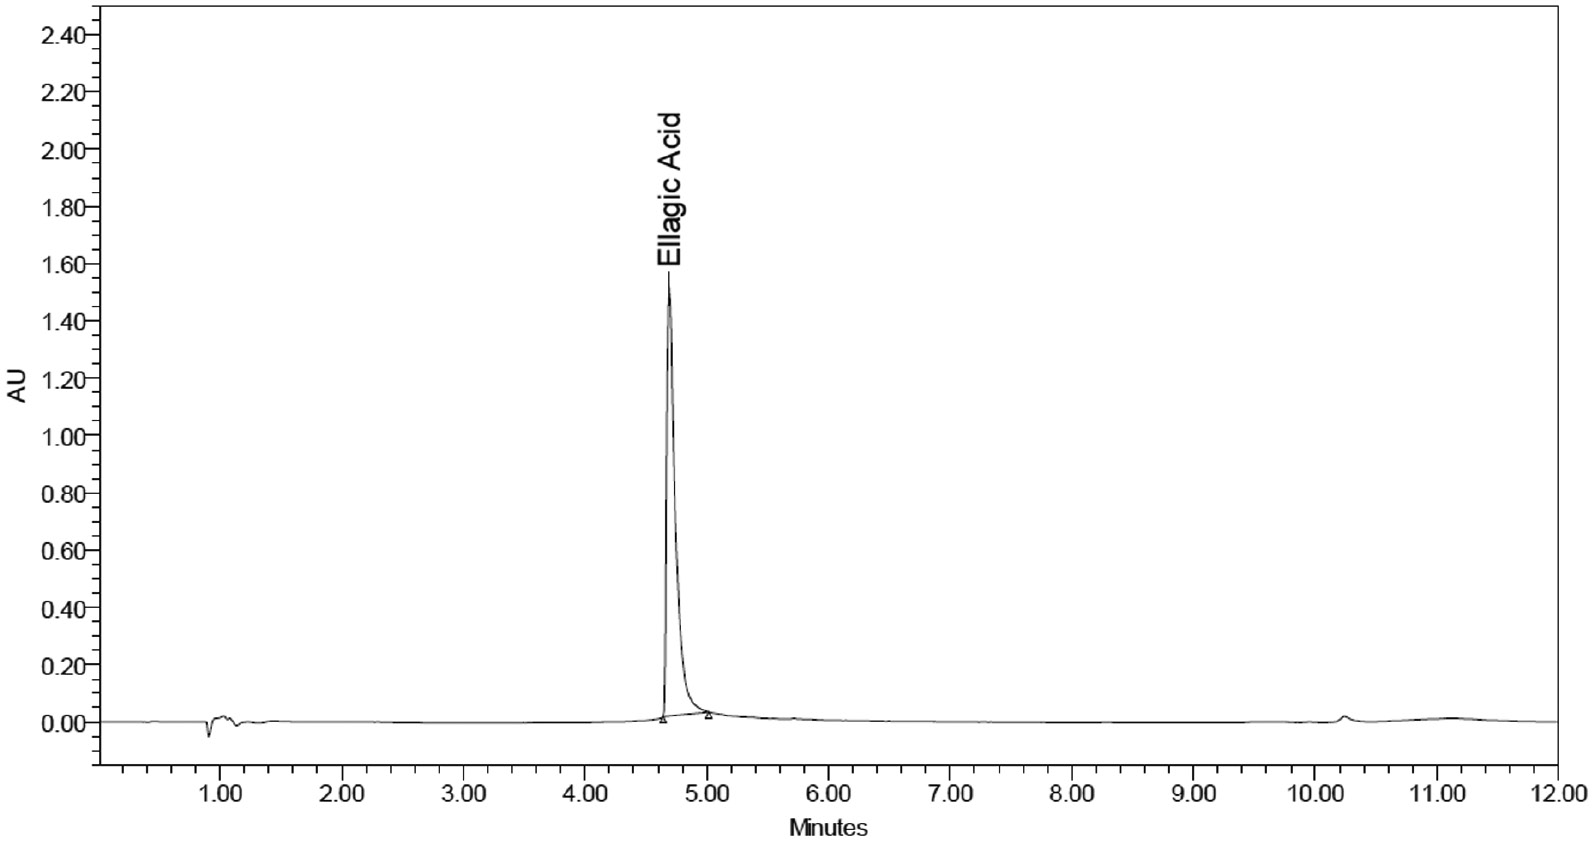
No peaks interfered with the EA retention period (Rt = 4.728 min) based on a comparison of the peaks. This finding showed that there was no interference from other solvents or chemicals used in the development process. It is clear from these findings and chromatograms that rat plasma containing EA does not include any interference from co-eluting peaks. As a result, the technique that was developed was specific in identifying and evaluating EA in plasma [15].
Accuracy and precision
Tables 3 and 4 show the intra- and inter-day precision and accuracy findings for EA in rat plasma at four QC levels based on the developed bioanalytical approach. The accuracy ranged from 98.54%–104.34% and the intraday % RSD was <2%. There was a ≤2% interday % RSD and the accuracy ranged between 95.74% and 99.96 %. These results showed that the suggested bioanalytical approach was accurate, precise, and repeatable [16].
Table 3 Intraday Study Results
| Conc (μg/ml) | Measured Conc (μg/ml) | RSD (%) | Accuracy (%) | |||
|---|---|---|---|---|---|---|
| Morning | ||||||
| 5 (LLOQ) | 5.040 ± 0.05568 | 1.105 | 100.8 | |||
| 50 (LQC) | 50.40 ± 0.4474 | 0.888 | 100.8 | |||
| 150 (MQC) | 149.8 ± 1.201 | 0.802 | 99.86 | |||
| 300 (HQC) | 300.3 ± 0.6067 | 0.202 | 100.1 | |||
| Afternoon | ||||||
| 5 (LLOQ) | 5.217 ± 0.09074 | 1.739 | 104.34 | |||
| 50 (LQC) | 49.27 ± 0.6429 | 1.305 | 98.54 | |||
| 150 (MQC) | 148.2 ± 1.041 | 0.703 | 98.8 | |||
| 300 (HQC) | 297.1 ± 0.8505 | 0.286 | 99.03 | |||
Table 4 Interday Study Results
| Spiked Plasma Conc (μg/ml) | Measured Conc | RSD (%) | Accuracy (%) | |||
|---|---|---|---|---|---|---|
| First day | ||||||
| 5 (LLOQ) | 4.960 ± 0.08888 | 1.792 | 99.2 | |||
| 50 (LQC) | 49.50 ± 0.6611 | 1.335 | 99 | |||
| 150 (MQC) | 149.7 ± 0.6506 | 0.435 | 99.8 | |||
| 300 (HQC) | 299.9 ± 0.4008 | 0.134 | 99.96 | |||
| Second day | ||||||
| 5 (LLOQ) | 4.787 ± 0.09018 | 1.884 | 95.74 | |||
| 50 (LQC) | 48.29 ± 0.7954 | 1.647 | 96.58 | |||
| 150 (MQC) | 147.3 ± 0.8622 | 0.585 | 98.2 | |||
| 300 (HQC) | 298.4 ± 1.573 | 0.527 | 99.46 | |||
Recovery study
Peak areas with and without the plasma were compared to compute the EA recovery. Table 5 presents the results of the recovery study. The recovery rates were 99.59%, 98.19%, and 101.41%. The overall recovery rate for EA was 99.73%, with a total RSD of 1.619%. Endogenous substances inside the biomatrix usually obstruct the examination of drugs in biological specimens. Nevertheless, examination of the gathered information showed that the EA in the plasma sample was not affected by the matrix peak [17].
Table 5 Recovery Study Results
| Replicate Number | LQC (Area) | MQC (Area) | HQC (Area) | |||
|---|---|---|---|---|---|---|
| Unextracted | Extracted | Unextracted | Extracted | Unextracted | Extracted | |
| 1 | 1027000 | 1232896 | 3496369 | 3645697 | 7579593 | 7756792 |
| 2 | 1035000 | 1245623 | 3498570 | 3698756 | 7598649 | 7798654 |
| 3 | 1039123 | 1221344 | 3545979 | 3698654 | 7698745 | 7895643 |
| Mean | 1033708 | 1233288 | 3513639 | 3681036 | 7625662 | 7817030 |
| SD | 6164 | 12144 | 28.29 | 30604 | 64005 | 71226 |
| % RSD | 0.596 | 0.985 | 0.798 | 0.831 | 0.839 | 0.911 |
| % Mean recovery | 101.41 | 98.19 | 99.59 | |||
| Overall % mean recovery | 99.73 | |||||
| Overall SD | 1.615 | |||||
| Overall % RSD | 1.619 | |||||
LOD and LOQ
The LOD (1.564 ± 0.026 μg/ml) indicated that the developed bioanalytical method is very sensitive and able to quantify very low levels of EA from plasma samples with an RSD of 1.654% [18]. The LOQ was 5.015 ± 0.025 μg/ml. This finding demonstrates that the system can detect even small amounts of EA in rat plasma with an RSD of 0.505%.
Ruggedness
Table 6 presents the results of the ruggedness study for EA in rat plasma. Ruggedness was assessed to determine the impact of different operating conditions on the RT and peak area. Spiked EA standard chromatograms at these two concentrations in Wistar rat plasma were analyzed under several operating conditions. No significant differences were detected in RT or concentrations. Additionally, the % RSD was <2%. Thus, the developed method was sufficiently robust to withstand variations in chromatographic conditions, including changes in operators, columns, and sources of reagents and chemicals [15].
Table 6 Ruggedness EA Data
| Condition | Plasma Concentration (μg/ml) | RT (Min.) | RSD (%) | Measured Concentration (μg/ml) | RSD (%) | Accuracy (%) |
|---|---|---|---|---|---|---|
| Operator – 1 | 50 (LQC) | 4.707 ± 0.019 | 0.398 | 48.40 ± 0.882 | 1.821 | 96.8 |
| 300 (HQC) | 4.679 ± 0.034 | 0.722 | 300.0 ± 0.812 | 0.270 | 100 | |
| Operator – 2 | 50 (LQC) | 4.775 ± 0.073 | 1.523 | 49.31 ± 0.781 | 1.584 | 98.62 |
| 300 (HQC) | 4.752 ± 0.072 | 1.521 | 300.5 ± 1.163 | 0.387 | 100.17 | |
| Column – 1 | 50 (LQC) | 4.667 ± 0.078 | 1.672 | 49.41 ± 0.958 | 1.939 | 98.82 |
| 300 (HQC) | 4.671 ± 0.084 | 1.802 | 300.2 ± 0.965 | 0.322 | 100.07 | |
| Column – 2 | 50 (LQC) | 4.703 ± 0.037 | 0.776 | 50.01 ± 0.719 | 1.438 | 100.02 |
| 300 (HQC) | 4.733 ± 0.073 | 1.550 | 299.5 ± 1.450 | 0.484 | 99.83 | |
| Source of reagent and chemicals (Merk, Mumbai) | 50 (LQC) | 4.749 ± 0.024 | 0.506 | 50.45 ± 0.741 | 1.468 | 100.9 |
| 300 (HQC) | 4.717 ± 0.065 | 1.377 | 300.3 ± 0.700 | 0.233 | 100.1 | |
| Source of reagent and chemicals (Qualigens Fine Chemicals, Mumbai) | 50 (LQC) | 4.677 ± 0.030 | 0.650 | 50.36 ± 0.303 | 0.601 | 100.72 |
| 300 (HQC) | 4.713 ± 0.003 | 0.065 | 298.7 ± 1.836 | 0.615 | 99.56 |
Robustness
Table 7 presents the robustness study for EA in rat plasma. To assess robustness, several parameters were changed and the effects on the RT and concentration were measured by peak area. The RT was shortened and the concentration was determined based on peak regions by increasing the flow rate, temperature, and composition of the organic mobile phase. The RT decreased by 1–2 s for every incremental degree increase in column temperature. Temperature has a major impact on solvent viscosity and vapor pressure, yet pressure loss is proportionate to mobile phase thickness [19]. As the temperature rises, the mobile phase density decreases, which led to an increased flow rate. Consequently, with increasing temperature and flow rate, the RT and measured concentration from the peak areas decreased and vice versa. At concentrations of 50 and 300 μg/ml, the RT decreased from 4.728 min to 4.673, 4.706, and 4.635 min with a +10% flow rate and a +5% organic mobile phase. The percent RSD for each parameter variation was approximately 2%. The RT and concentration did not significantly change from the parameters of the conventional chromatographic technique. Therefore, the established bioanalytical technique may be applied in routine laboratory settings and is dependable under the given conditions [20].
Table 7 Robustness Data of EA
| Condition | Plasma Conc (μg/ml) | RT (Min.) | RSD (%) | Measured Conc (μg/ml) | RSD (%) | Accuracy (%) |
|---|---|---|---|---|---|---|
| Flow rate (−10%) | 50 | 4.742 ± 0.012 | 0.260 | 50.45 ± 0.794 | 1.574 | 100.9 |
| 300 | 4.747 ± 0.092 | 1.945 | 302.1 ± 1.502 | 0.497 | 100.7 | |
| Flow rate (+10%) | 50 | 4.706 ± 0.015 | 0.322 | 47.89 ± 0.809 | 1.688 | 95.78 |
| 300 | 4.673 ± 0.019 | 0.396 | 299.0 ± 1.642 | 0.549 | 99.67 | |
| Temperature (−10%) | 50 | 4.779 ± 0.076 | 1.601 | 52.42 ± 0.669 | 1.276 | 104.84 |
| 300 | 4.714 ± 0.047 | 0.993 | 302.5 ± 0.852 | 0.282 | 100.83 | |
| Temperature (+10%) | 50 | 4.686 ± 0.057 | 1.209 | 48.91 ± 0.278 | 0.568 | 97.82 |
| 300 | 4.666 ± 0.049 | 1.051 | 300.9 ± 0.612 | 0.203 | 100.3 | |
| Organic mobile phase (−5%) | 50 | 4.823 ± 0.082 | 1.702 | 51.40 ± 0.995 | 1.935 | 102.8 |
| 300 | 4.789 ± 0.095 | 1.975 | 299.1 ± 1.299 | 0.435 | 99.7 | |
| Organic mobile phase (+5%) | 50 | 4.722 ± 0.061 | 1.299 | 48.67 ± 0.565 | 1.162 | 97.34 |
| 300 | 4.635 ± 0.071 | 1.532 | 298.7 ± 1.834 | 0.614 | 99.57 |
EA stability in rat plasma
Table 8 presents the stability analysis results for EA in rat plasma under various conditions. The % RSD ranged from 0.29% (short-term stability) to 1.96% (long-term stability). The % RSD was <2% of the true value in every stability study. No discernible EA degradation was detected, even after 3 freeze-thaw cycles (4 h at −30°C), a 24-h storage period at 5°C in the auto-sampler tray, and a 10-day storage period at 25°C. These results showed that EA in rat plasma does not change when stored in different ways [15].
Table 8 Stability Study Results
| Type of Stability | Spiked Plasma Conc (μg/ml) | Measured Conc (μg/ml, n = 3; mean ± SD) | RSD (%) | Accuracy (%) |
|---|---|---|---|---|
| Short-term stability (6 h at 25°C) | 50 | 49.73 ± 0.70 | 1.39 | 99.46 |
| 300 | 296.4 ± 0.88 | 0.29 | 98.80 | |
| Long-term stability (10 days at 25°C) | 50 | 46.21 ± 0.90 | 1.96 | 92.42 |
| 300 | 294.0 ± 1.59 | 0.54 | 98.00 | |
| Auto-sampler stability (24 h at 5°C) | 50 | 48.18 ± 0.84 | 1.73 | 96.36 |
| 300 | 289.9 ± 1.79 | 0.62 | 96.63 | |
| Freeze-thaw stability (cycle 3, 4 h at −30°C) | 50 | 48.61 ± 0.76 | 1.56 | 97.22 |
| 300 | 288.7 ± 1.20 | 0.42 | 96.23 | |
| Benchtop stability (Old solution) | 50 | 45.16 ± 0.86 | 1.91 | 90.32 |
| 300 | 289.5 ± 1.06 | 0.364 | 96.50 | |
| Benchtop stability (Fresh solution) | 50 | 48.46 ± 0.85 | 1.76 | 96.42 |
| 300 | 297.7 ± 1.52 | 0.51 | 99.23 |
Conclusion
The current developed and validated a novel buffer-free RP-HPLC method for quantifying EA in rat plasma, which is characterized by simplicity, precision, accuracy, sensitivity, and repeatability. The method met all validation criteria and showed no matrix effect on RT and concentration. Stability tests confirmed that EA remains stable during storage and sample preparation. The method is linear with a high correlation coefficient, making EA ideal for pharmacokinetic, bioequivalence, and therapeutic drug monitoring studies. Advantages include the minimal plasma volume requirement, low limits of quantification and detection, high accuracy, cost-effectiveness, and straightforward preparation. This gradient elution technique effectively analyses complex samples within a 20-min RT free from interference by late-eluting peaks.
Conflicts of interest
The authors declare that they have no competing interests.
References
- Sharifi-Rad J, Quispe C, Castillo CM, Caroca R, Lazo-Vélez MA, et al. Ellagic acid: a review on its natural sources, chemical stability, and therapeutic potential. Oxid Med Cell Longev 2022;2022:3848084. [PMID: 35237379 DOI: 10.1155/2022/3848084]
- Patel RK, Patel VR, Patel MG. Development and validation of a RP-HPLC method for the simultaneous determination of Embelin, Rottlerin and Ellagic acid in Vidangadi churna. J Pharm Anal 2012;2(5):366-71. [PMID: 29403768 DOI: 10.1016/j.jpha.2012.03.001]
- Castelli FA, Rosati G, Moguet C, Fuentes C, Marrugo-Ramírez J, et al. Metabolomics for personalized medicine: the input of analytical chemistry from biomarker discovery to point-of-care tests. Anal Bioanal Chem 2022;414(2):759-89. [PMID: 34432105 DOI: 10.1007/s00216-021-03586-z]
- Ganjage PJ, Tapkir AS, Nipanikar SU, Nagore DH, Pawar PK, et al. Development and validation of a RP-HPLC method for the determination of Ellagic acid in Terminalia bellirica extract and single herb capsule of Terminalia bellirica. Indian J Pharm Educ Res 2018;52(4):s56-s62. [DOI: 10.5530/ijper.52.4s.76]
- Wu Z, Medlicott NJ, Razzak M, Tucker IG. Development and optimization of a rapid HPLC method for analysis of ricobendazole and albendazole sulfone in sheep plasma. J Pharm Biomed Anal 2005;39(1-2):225-32. [PMID: 15878252 DOI: 10.1016/j.jpba.2005.03.010]
- Shaikh SU, Jain VA. Development and validation of a RP-HPLC method for the simultaneous determination of quercetin, ellagic acid and rutin in hydroalcoholic extract of Triphala churna. Int J Appl Pharm 2018;10(3):169-74. [DOI: 10.22159/ijap.2018v10i3.25860]
- Hanpitakpong W, Banmairuroi V, Kamanikom B, Choemung A, Na-Bangchang K. A high-performance liquid chromatographic method for determination of praziquantel in plasma. J Pharm Biomed Anal 2004;36:871-6. [PMID: 15533682 DOI: 10.1016/j.jpba.2004.07.043]
- Dewani AP, Dabhade SM, Bakal RL, Gadewar CK, Chandewar AV, et al. Development and validation of a novel RP-HPLC method for simultaneous determination of paracetamol, phenylephrine hydrochloride, caffeine, cetirizine and nimesulide in tablet formulation. Arabian J Chem 2015;8(4):591-8. [DOI: 10.1016/j.arabjc.2013.09.040]
- Emami J, Ghassami N, Ahmadi F. Development and validation of a new HPLC method for determination of lamotrigine and related compounds in tablet formulations. J Pharm Biomed Anal 2006;40(4):999-1005. [PMID: 16176866 DOI: 10.1016/j.jpba.2005.07.045]
- Gandla K, Lalitha R, Bommakanti S, Suthakaran R, Pallavi K. Development and validation of RP-HPLC method for simultaneous estimation of albendazole and praziqantel in tablet dosage form. Asian J Pharm Anal 2015;5(3):115-8. [DOI: 10.5958/2231-5675.2015.00018.6]
- Sagirli O, Onal A, Toker S, Şensoy D. Simultaneous HPLC analysis of olmesartan and hydrochlorothiazide in combined tablets and in vitro dissolution studies. Chromatographia 2007;66(3):213-8. [DOI: 10.1365/s10337-007-0304-9]
- Gültekin Y, Öztürk N, Filazi A, Deniz A, Korkmaz Ç, et al. Simultaneous determination of albendazole sulfoxide and praziquantel from PLGA nanoparticles and validation of new HPLC method. J Res Pharm 2022;26(6):1608-18. [DOI: 10.29228/jrp.252]
- Tatar E, Gökhan A, Küçükgüzel İ. Development and validation of a RP-HPLC method for quality control of oxantel pamoate, pyrantel pamoat and praziquantel in tablets. Marmara Pharm J 2015;19(1):27-35. [DOI: 10.12991/mpj.2015198607]
- Ware AL, Pekamwar SS. Development and validation of bioanalytical RP-HPLC method for determination of valsartan and development and validation of RP-HPLC method for determination of valsartan in bulk drug and formulation. Indo Am J Pharm Res 2020;11(12):1455-73. [DOI: 10.5281/zenodo.4415373]
- Siva Krishna P, Eswarudu MM, Santhi Priya N, Gayathri B, Srinivasa Babu P. Bioanalytical RP-HPLC method development and validation for the determination of metformin hydrochloride in spiked human plasma. Int J Pharm Sci Rev Res 2023;81(1):165-8. [DOI: 10.47583/ijpsrr.2023.v81i01.028]
- Guidance for Industry. Q2(R1) Validation of analytical procedures: text and methodology Guidance for Industry. U.S. Department of Health and Human Services Food and Drug Administration; 2005.
- Kanala K, Hwisa NT, Chandu BR, Katakam P, Khagga M, et al. Bioanalytical method development and validation of milnacipran in rat plasma by LC-MS/MS detection and its application to a pharmacokinetic study. J Pharm Anal 2013;3(6):481-8. [PMID: 29403859 DOI: 10.1016/j.jpha.2013.03.009]
- D’cruz D, Babu A, Joshy E, Aneesh TP. Bioanalytical method development and validation of Ticagrelor by RP-HPLC. Int J App Pharm 2017;9(3):51-4. [DOI: 10.22159/ijap.2017v9i3.17452]
- Kolimi P, Shankar VK, Shettar A, Rangappa S, Repka MA, et al. Development and validation of HPLC method for efinaconazole: application to human nail permeation studies. AAPS PharmSciTech 2022;23(1):63. [PMID: 35091878 DOI: 10.1208/s12249-021-02196-3]
- Patel KG, Patel AT, Shah PA, Gandhi TR. Multivariate optimization for simultaneous determination of aspirin and simvastatin by reverse phase liquid chromatographic method using AQbD approach. Bull Fac Pharm Cairo Univ 2017;55(2):293-301. [DOI: 10.1016/j.bfopcu.2017.08.003]