Stability Indicating RP-HPLC Method for the Estimation of Impurities in Esomeprazole Gastro-Resistant Tablets by AQbD Approach
1Zuventus Healthcare Limited, Hinjawadi 411057, Pune
*Correspondence to: Vikram Gharge, Zuventus Healthcare Limited, Plot No. P-2, SBM, Ground Floor (Part-B) & First Floor, I.T.B.T. Park, Phase –II, MIDC, Hinjawadi 411057, Pune, E-mail: Vikram.Gharge@zuventus.com
Received: April 26 2024; Revised: May 9 2024; Accepted: May 22 2024; Published Online: July 1 2024
Cite this paper:
Gharge V, Gadhe A, Mohite V et al. Stability Indicating RP-HPLC Method for the Estimation of Impurities in Esomeprazole Gastro-Resistant Tablets by AQbD Approach. BIO Integration 2024; 5: 1–11.
DOI: 10.15212/bioi-2024-0018. Available at: https://bio-integration.org/
Download citation
© 2024 The Authors. This is an open access article distributed under the terms of the Creative Commons Attribution License (https://creativecommons.org/licenses/by/4.0/). See https://bio-integration.org/copyright-and-permissions/
Abstract
Background: Esomeprazole (ESO) gastro-resistant tablets (40 mg) are sold under the brand name, Zosa, which effectively manages conditions associated with the overproduction of gastric acid, including peptic ulcer disease and Zollinger-Ellison syndrome. The present study quantifies impurities in esomeprazole using advanced analytical techniques known as analytical quality by design with high-performance liquid chromatography.
Methods: Buffer selection (pH 7.6) and mobile phase composition (75:25 v/v) were optimized utilizing a YMC C18 column (150 mm × 4.6 mm; particle size, 3 μm) with a flow rate of 1.0 mL/min. The analyte was monitored with a UV/PDA detector at a wavelength of 280 nm. The stability-indicating nature of the method was confirmed based on forced degradation studies. The method validation was performed per ICH guidelines. Linearity, specificity, limit of detection, limit of quantification, precision, accuracy, solution stability, and robustness parameters were validated.
Results: All validation parameters were within an acceptable range. Excellent linearity with correlation coefficient values > 0.99 was achieved across the quantification limit. The solution stability study demonstrated no significant increase in percent impurity over a 24-h period. Analytical quality by design was instrumental in defining the design range for buffer pH and mobile phase composition, ensuring robust method performance. It was confirmed that 75% buffer solution, 25% acetonitrile, and pH 7.6 were the ideal conditions for determination of ESO impurities.
Conclusion: The validated method provides a reliable tool for accurately quantifying impurities in ESO tablet formulations.
Keywords
Esomeprazole, ICH guidelines, impurities, omeprazole N-oxide, stability, validation.
Introduction
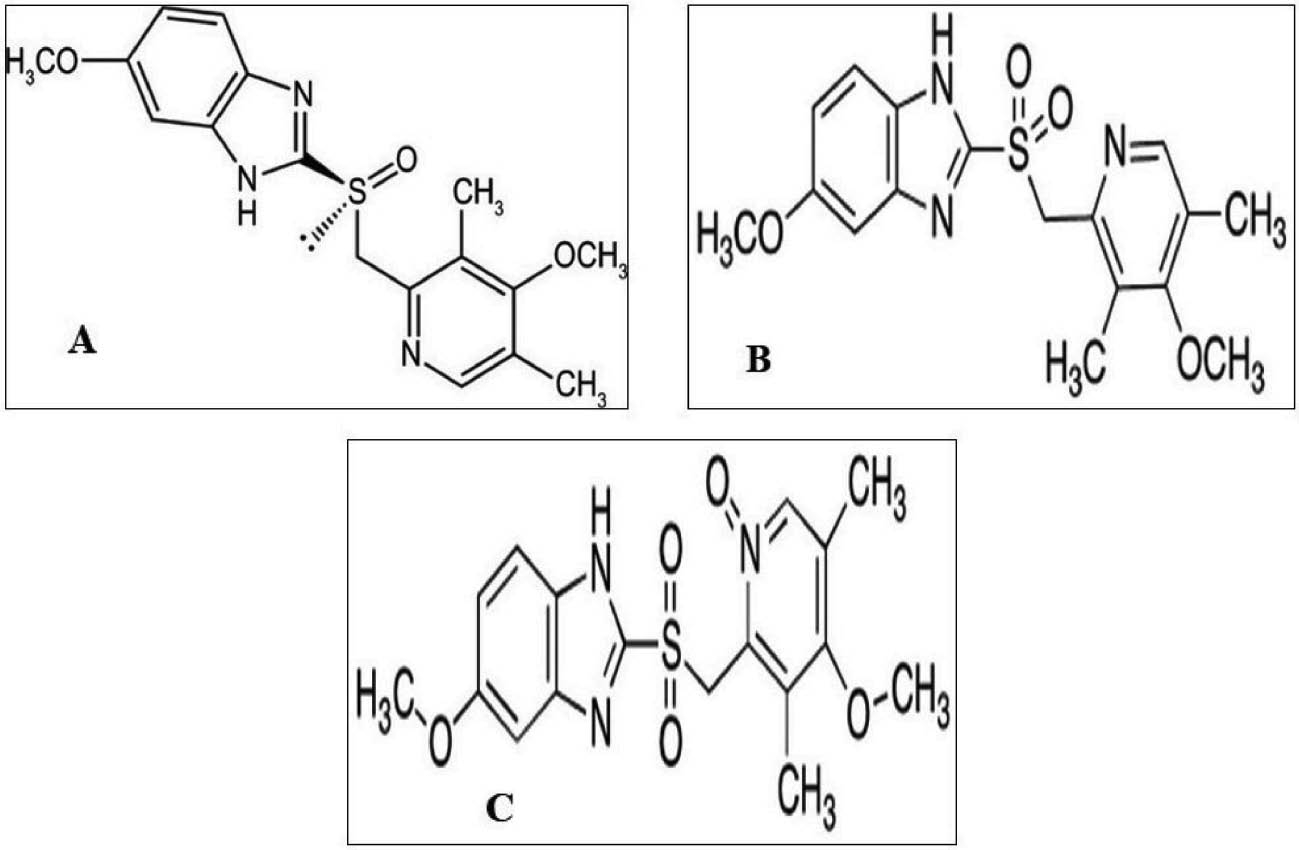
Esomeprazole (ESO) is a cost-effective pharmacotherapy for non-steroidal anti-inflammatory drug-associated ulceration, and Zollinger-Ellison syndrome [1]. ESO inhibits the secretion of gastric acid by blocking the action of gastric H+/K+-ATPase. Compared to omeprazole and other racemic proton pump inhibitors, the ESO pharmacokinetic profile offers better acid control [2–4]. An S-isomer of omeprazole (esomeprazole magnesium trihydrate) contains magnesium, bis[5-methoxy-2-[[(4-methoxy-3,5-dimethyl-2-pyridinyl) methyl] sulfinyl] [1H- benzimidazole] is shown in Figure 1A [5]. Several UV-spectrophotometry [6–7], HPLC [8–12], and HPTLC [13] analytical methods are available in the literature for estimation of ESO in single form as well as in combination with other acid pump inhibitors. The official United States Pharmacopoeia (USP) NF monograph for ESO drug substances specifies the high-performance liquid chromatography (HPLC) method for ESO detection and estimation together with various impurities [14] (Figure 1B, C).
Figure 1 Structure of esomeprazole (A); Structure of omeprazole impurity A (B); Structure of omeprazole N-oxide impurity (C).
ESO drug substances and drug products are official in the Indian Pharmacopoeia (IP) [15]. However, the IP does not mention any tests to detect impurities in ESO drug products. The analytical method for the estimation of ESO impurities is available for the capsule dosage form. There is currently no official method for the estimation of ESO impurities from the tablet dosage form. In the Indian market ESO Gastro-resistant tablets (40 mg) are sold under the brand name, Zosa. Zosa tablets effectively manage conditions associated with the overproduction of gastric acid, including peptic ulcer disease and Zollinger-Ellison syndrome. With the efficacy in reducing gastric acid production and providing symptomatic relief, Zosa tablets have gained significant traction among healthcare professionals and patients alike. The demand for Zosa tablets is consistently high, reflecting the prevalence of acid-related disorders in the Indian population and the effectiveness of Zosa in managing these conditions. Therefore, there is a need for a simple and robust analytical method to determine ESO impurities in tablet dosage forms within a short time frame.
Ensuring the safety and efficacy of drug therapy requires meticulous impurity profiling of drug products. Forced degradation studies (FDSs) have a relevant role in the development of stability-indicating methods. Additionally, it is advantageous to comprehend the inherent stability of drug products. Thus, the stability-indicating method is preferred due to precision, accuracy, and robustness. HPLC serves as one of the fundamental analytical techniques in pharmaceutical sciences. HPLC enables precise and reliable quantification of impurities, thereby facilitating rigorous evaluation and characterization of drug products.
The adoption of analytical quality by design (AQbD) methodologies aids in managing variability and enhancing the performance of analytical methods. AQbD is a scientific approach focused on risk assessment. AQbD facilitates the development of analytical methods by systematically identifying and controlling critical variables that impact method attributes. This process aims to achieve superior method performance, ruggedness, flexibility, and robustness, thereby enabling continuous improvement [16]. A robust HPLC method can be developed using various AQbD tools by identifying critical method attributes (CMAs) to assess risk and optimizing and developing the method through the design of experiments (DoEs). By utilizing DoEs, the method operable design region can be established, which allows for the determination of acceptable ranges for factors affecting method performance. Furthermore, incorporating a control strategy and assessment of risk ensures the identification and mitigation of potential risks throughout the method development process. The AQbD method provides confidence in method accuracy and reliability, while continuous method monitoring enables real-time performance assessment and potential adjustments [17]. The present work implemented AQbD principles in optimizing mobile phase composition and pH to identify and detect impurities in ESO products by developing an in-house validated HPLC method to manufacture products with export potential.
Experimental
Chemicals and reagents
Omeprazole N-oxide and omeprazole-related compound A were used as USP reference standard impurities and sourced from Zuventus Healthcare Ltd. Pune. Buffer components like monobasic sodium phosphate and anhydrous dibasic sodium phosphates were obtained from Zuventus Healthcare Ltd. Pune. Phosphoric acid was used as a pH adjuster, and acetonitrile HPLC grade was used as an organic solvent for chromatographic separations in HPLC obtained from Zuventus Healthcare Ltd. Pune. HPLC grade milli-Q water was used to prepare all solutions. Zosa Tablets (Esomeprazole Gastro-resistant Tablets [40 mg]) were provided by Zuventus Healthcare Ltd. Pune. All analytical grade chemicals and solvents used were provided by Zuventus Healthcare Ltd. (Hinjawadi, Pune, India).
Instrumentation
The HPLC system (Waters Pacific Pte Ltd., Singapore) used in this study was equipped with a Yamazen multi-layered pack C18 column (150 mm × 4.6 mm; particle size, 3 μm). The waters-HPLC series is comprised of quaternary channels, which refer to the pump system typically consisting of four solvent channels, a degasser, an auto-injector, and a UV-detector. The photo-diode array (PDA) detector was connected to Empower 3 software (Waters Corporation, Milford, USA) to monitor the output signal.
Chromatographic conditions
Impurity separation was accomplished through the utilization of an isocratic mobile phase comprised blend of buffer and acetonitrile and acetonitrile in a volumetric ratio of 75:25 [18]. A Yamazen multi-layered pack C18 column at ambient temperature with a flow rate of 1.0 mL min−1 was used. The sample analysis was performed at 280 nm using a PDA detector with a 50-μL injection volume and a 45-min run time.
Methods
Buffer preparation
Monobasic sodium phosphate (0.006 M) and anhydrous dibasic sodium phosphate (0.032 M) were dissolved in 1000 mL of water and mixed well under continuous stirring. The solution (250 mL) was diluted with water up to 1000 mL and the pH was adjusted to 7.6 with phosphoric acid. The solution was thoroughly mixed.
Mobile phase preparation
The mobile phase was meticulously prepared by combining acetonitrile and buffer at a 25:75 ratio.
Diluent preparation
An optimized diluent was prepared by mixing acetonitrile and buffer in a 25:75 volumetric ratio.
System suitability solution preparation
Esomeprazole magnesium (0.04 mg mL−1), omeprazole N-oxide (0.04 mg mL−1), and omeprazole-related compound A (0.04 mg mL−1) were prepared in the diluent.
Sample solution
The tablets were crushed and powder equivalent to 40 mg of ESO was weighed accurately and transferred into a 250-mL flask. Nearly 170 mL of diluent was added and sonicated for 15 min. The solution was filled to the designated mark with the diluent and thoroughly mixed. The solution then underwent filtration through a 0.45-μm membrane filter. The initial 5 mL of filtrate was discarded and the remaining solution was utilized for analysis [19].
FDS
The drug substance or product is usually subjected to a variety of stress conditions, including heat, light, humidity, acid/base hydrolysis, oxidation, and photolysis, in forced degradation experiments. Drug products and placebos were kept in different conditions, such as acid (0.1 M HCl for 15 min at room temperature), alkali (0.1 M NaOH for 60 min at 60°C), oxidative stress (0.03% H2O2 for 10 min at room temperature), and heat at 60°C for 24 h. Placebo and drug products were exposed to 1.2 million lux h and near UV at 200-watt hrs m−2 for the photostability condition. To observe the humidity, samples were kept at 40°C/75% relative humidity for 24 h. The intent was to create approximately 10% of degradation under at least one stress condition [20].
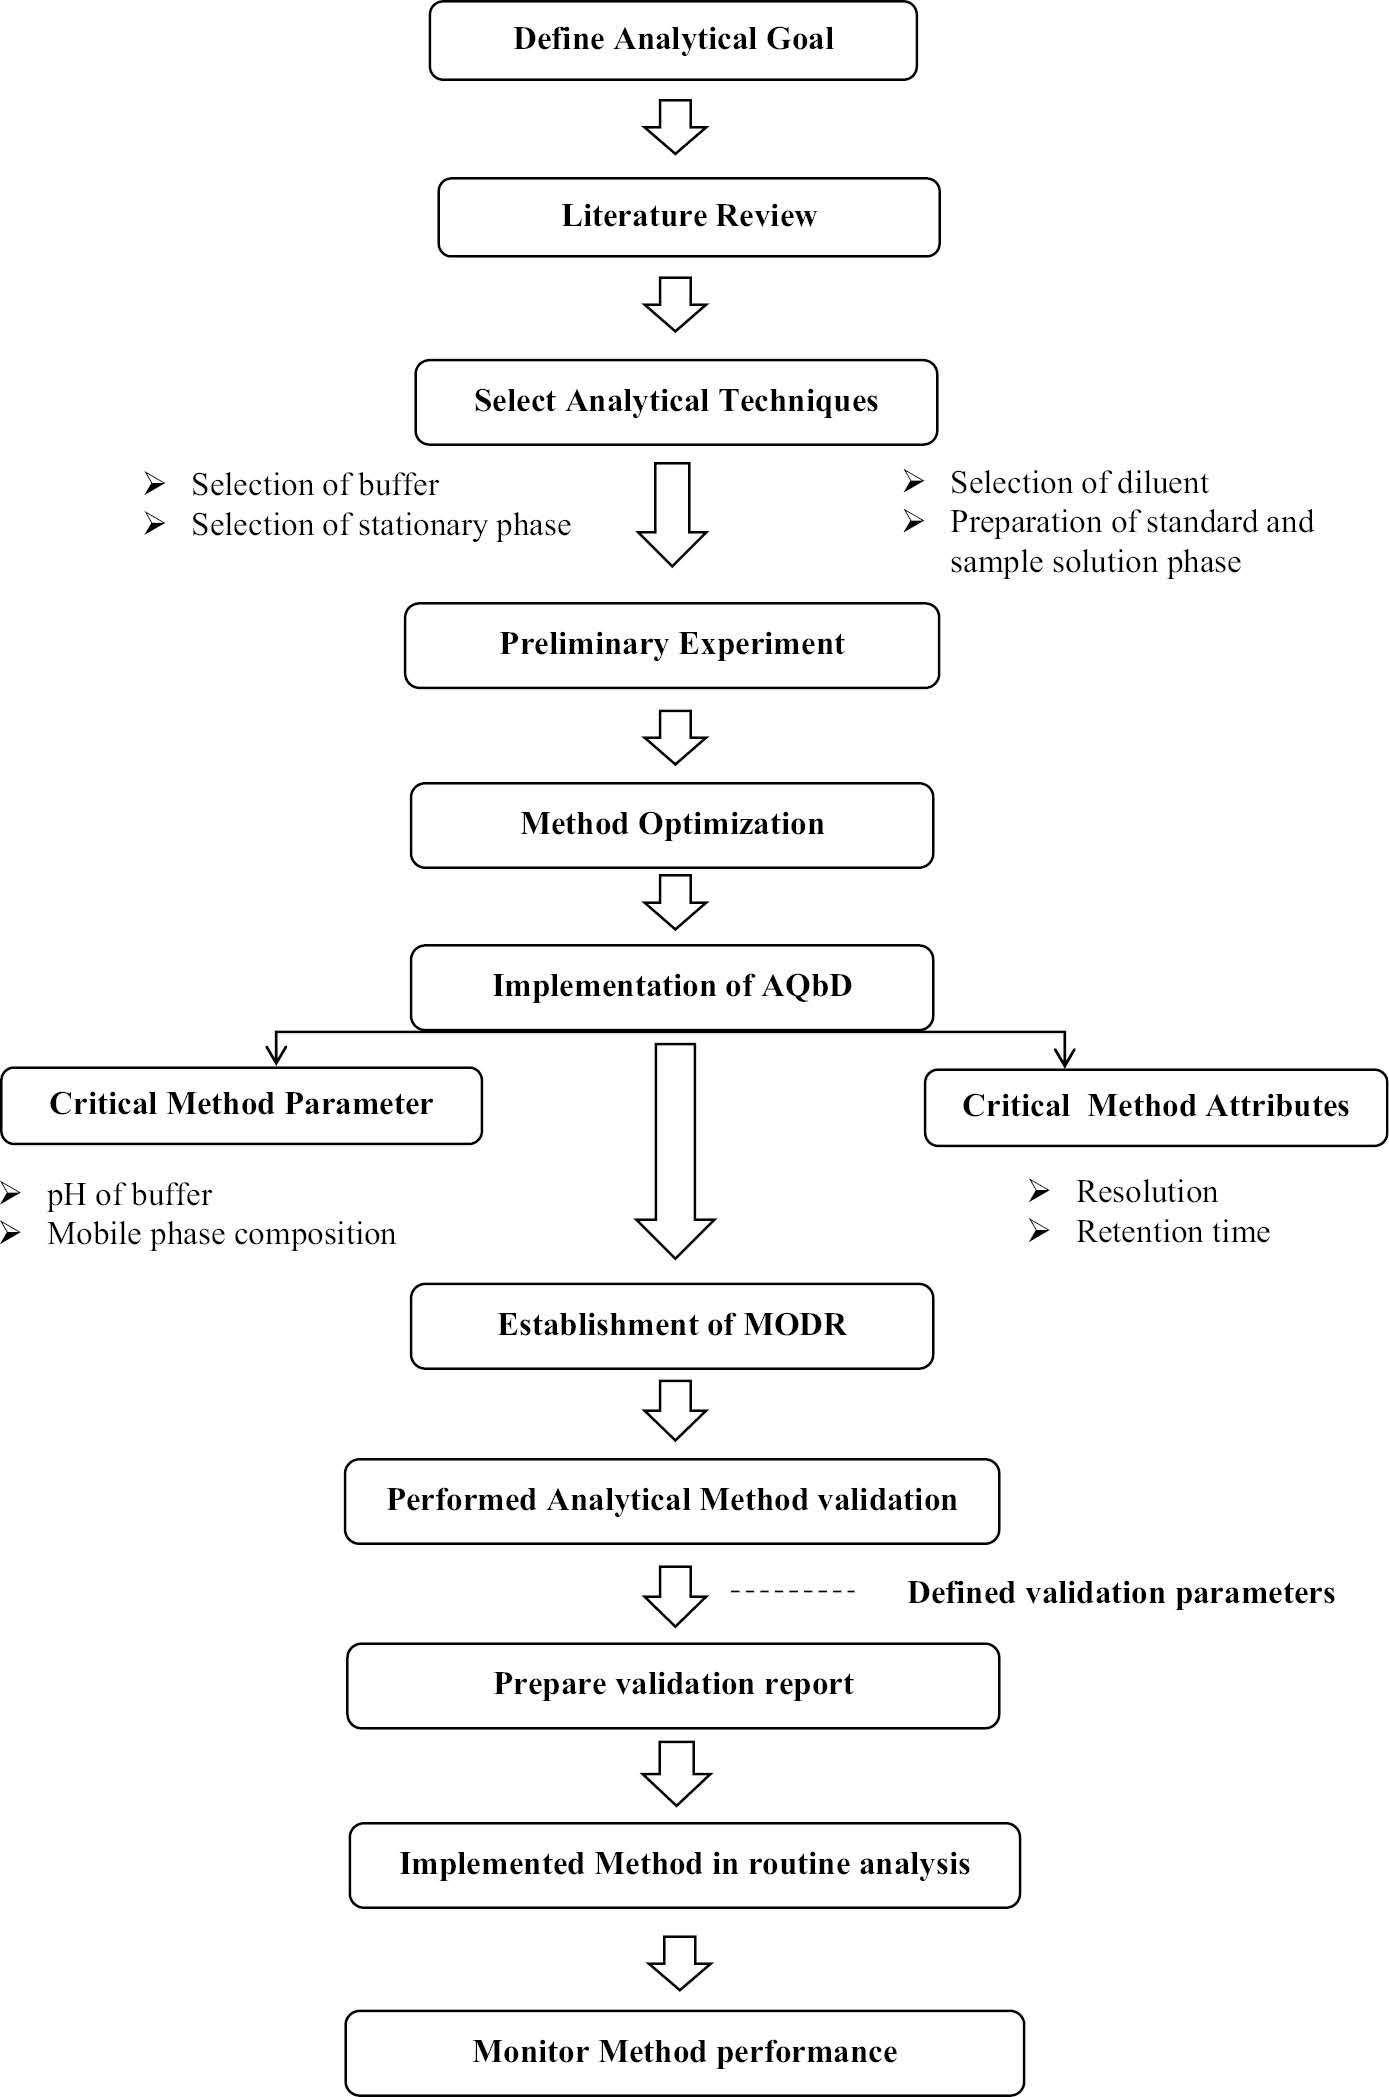
Analytical method development and validation (Figure 2)
Figure 2 Schematic diagram of methodology.
Method validation
In accordance with ICH requirements, the optimized HPLC technique was validated for robustness, specificity, linearity, precision, limit of detection, accuracy, and limit of quantification [21–23].
Specificity
Studies on forced degradation, including acid and base, oxidation, photolysis, heat, and humidity samples, were carried out to ascertain the specificity of the technique. Peak purity was used to confirm interference of the placebo and other degradation peaks.
Linearity and range
The standard and mixture of all impurity stock solutions with a concentration of 0.05 mg mL−1 were utilized to demonstrate the linearity of the optimized procedure. The stock solutions were further diluted for 6 different concentrations of esomeprazole and associated impurities in the diluent, ranging from 0.00001–0.0012 mg mL−1.
LOD and LOQ
The calibration curve method and signal-to-noise ratio (S/N) were used to determine the LOD and LOQ values for esomeprazole and associated contaminants. The following formulae (1 and 2) were used to derive LOD and LOQ, respectively:
 (1)
(1)
 (2)
(2)
Precision
To ensure reproducibility, six different samples were extracted from a homogeneous mixture and subjected to analysis. The percentage relative standard deviation (RSD) values of the six impurity sample results were used to calculate the analysis precision. The analysis was performed again on separate days to verify the method ruggedness (intermediate precision).
Accuracy
Accuracy was demonstrated with the spiking test solution at the following concentrations LOQ %, 50%; 100%; and 150%, The concentration levels (LOQ%, 50%, 100%, and 150%) were repeated in triplicate.
Solution stability
The blank, placebo, system suitability, and test solutions of ESO gastro-resistant tablets (40 mg) were prepared according to the analytical method. The test and standard solutions were stored at 15°C up to 24 h. The test solutions were analysed at the initial, and 8, 16, and 24 h time points. The percent impurity from the initial time period to 24 h was calculated.
Robustness
By purposefully altering the chromatographic conditions within and around the optimal parameters, robustness was established. Based on the robustness study method the operable design space was defined, which involves determining if the method can continue to produce reliable results despite deliberate changes to the parameters. Robustness analyses aid in the identification of crucial technique parameters and the permissible ranges, enabling improved control as well as understanding of the method performance. Potential risks can be proactively evaluated and reduced by conducting robustness studies within the framework of the DoE.
Optimization using CCD
The dependent variables were resolution (Y1) and retention time (Y2), while the pH of the buffer solution (A) and the composition of the mobile phase (B) were independent variables (Table 1).
Table 1 Variables and Levels
| Variable | (−1) Low Level | (0) Medium Level | (+1) High Level |
|---|---|---|---|
| Independent variables | |||
| A: pH of buffer solution | 7.2 | 7.6 | 8.0 |
| B: Mobile phase composition (%) | 73:27 | 75:25 | 77:23 |
| Dependent Variables | |||
| Y1: Resolution | |||
| Y2: Retention time | |||
Before method validation, the optimized chromatographic conditions underwent a risk assessment process using the DoEs [24]. Optimization was carried out using data from screening experiments. The same variables investigated in the screening experiments were examined again but within a narrower range to pinpoint the optimal settings. The results were analysed based on specific peak responses with performance criteria set to achieve resolution between all peaks. AQbD principles were used to develop a suitable method for the determination of ESO and known impurities [25, 26].
In the current method the critical method parameters are the pH of the buffer solution and the composition of the mobile phase. The central composite design was executed using Design Expert software (Stat-Ease Inc., Minneapolis, USA) for the DoE studies [27].
Result and Discussion
Method development strategy and optimization of chromatographic conditions
The primary objective of this study was to develop a simple stability-indicating technique for assessing impurities in ESO via HPLC, achieving optimal resolution and minimizing run time. Spectrophotometric methods for determining ESO and related impurities in pharmaceutical formulations pose challenges in specificity, particularly due to the presence of diverse excipients in the placebo. Hence, the simple reversed-phase high-performance liquid chromatography (RP HPLC) impurity method is favored in quality control settings for the ability to deliver reproducible and precise results swiftly [28]. Several development trials were conducted using an isocratic method, combining buffer (pH 7.6) and acetonitrile at a ratio of 70:30 v/v. However, in this trial, the resolution between impurities and placebo was found to be unsatisfactory. To reduce run time, the concentration of the mobile phase was optimized through repeated runs. Various compositions of the mobile phase were tested to achieve optimal resolution and peak symmetry. Based on spectral data analysis, the detection wavelength was set at 280 nm for impurity detection in the samples [27]. Following preliminary chromatographic optimization, a DoE study was conducted to confirm that the optimized conditions are suitable for quantifying ESO impurities in tablet dosage forms. For the separation and estimation of ESO and related compounds, method development was started by selecting buffer (pH 7.6) and mobile phase composition [MPC] (75:25 v/v), which evaluated system suitability parameters (i.e., retention time [11.4 min] and resolution [6.46]). The result from the replicates runs were satisfactory and after the forced degradation analysis no interference was observed in the placebo peaks, and the impurities were resolved from each other.
The optimized chromatographic conditions of the analytical method development are summarised in Table 2.
Table 2 Optimised Chromatographic Conditions
| Sr. No | Parameters | Conditions |
|---|---|---|
| 1 | HPLC | Waters |
| 2 | Column | YMC C18 column (150 mm × 4.6 mm; particle size, 3 μm) |
| 3 | Wavelength | 280 nm |
| 4 | pH of buffer solution | 7.6 |
| 5 | Mobile phase | Phosphate buffer pH 7.6: Acetonitrile (75:25 v/v ratio) |
| 6 | Run time | 45 min |
| 7 | Injection volume | 50 μl |
| 8 | Flow rate | 1 ml/min |
FDS
Forced degradation is used in pharmaceutical development and analysis to intentionally induce the degradation of a drug substance or product under exaggerated conditions. These studies help assess the stability, degradation pathways, and impurity profiles of the drug substance or product ensuring drug safety and efficacy. FDSs provide necessary and valuable information about the inherent stability of any drug substance and its degradation behaviour under different exaggerated conditions [29].
Under ideal chromatographic conditions, the spiked impurity sample was injected, and system suitability parameters were assessed. Additionally, the forced degradation analysis was run to confirm that placebo peaks were interfering. Figure 3 displays individual chromatograms of the ESO molecules and Table 3 presents the findings of the forced degradation investigation.
Figure 3 (A) Chromatogram of omeprazole N-oxide impurity; (B) Chromatogram of omeprazole-related compound A.
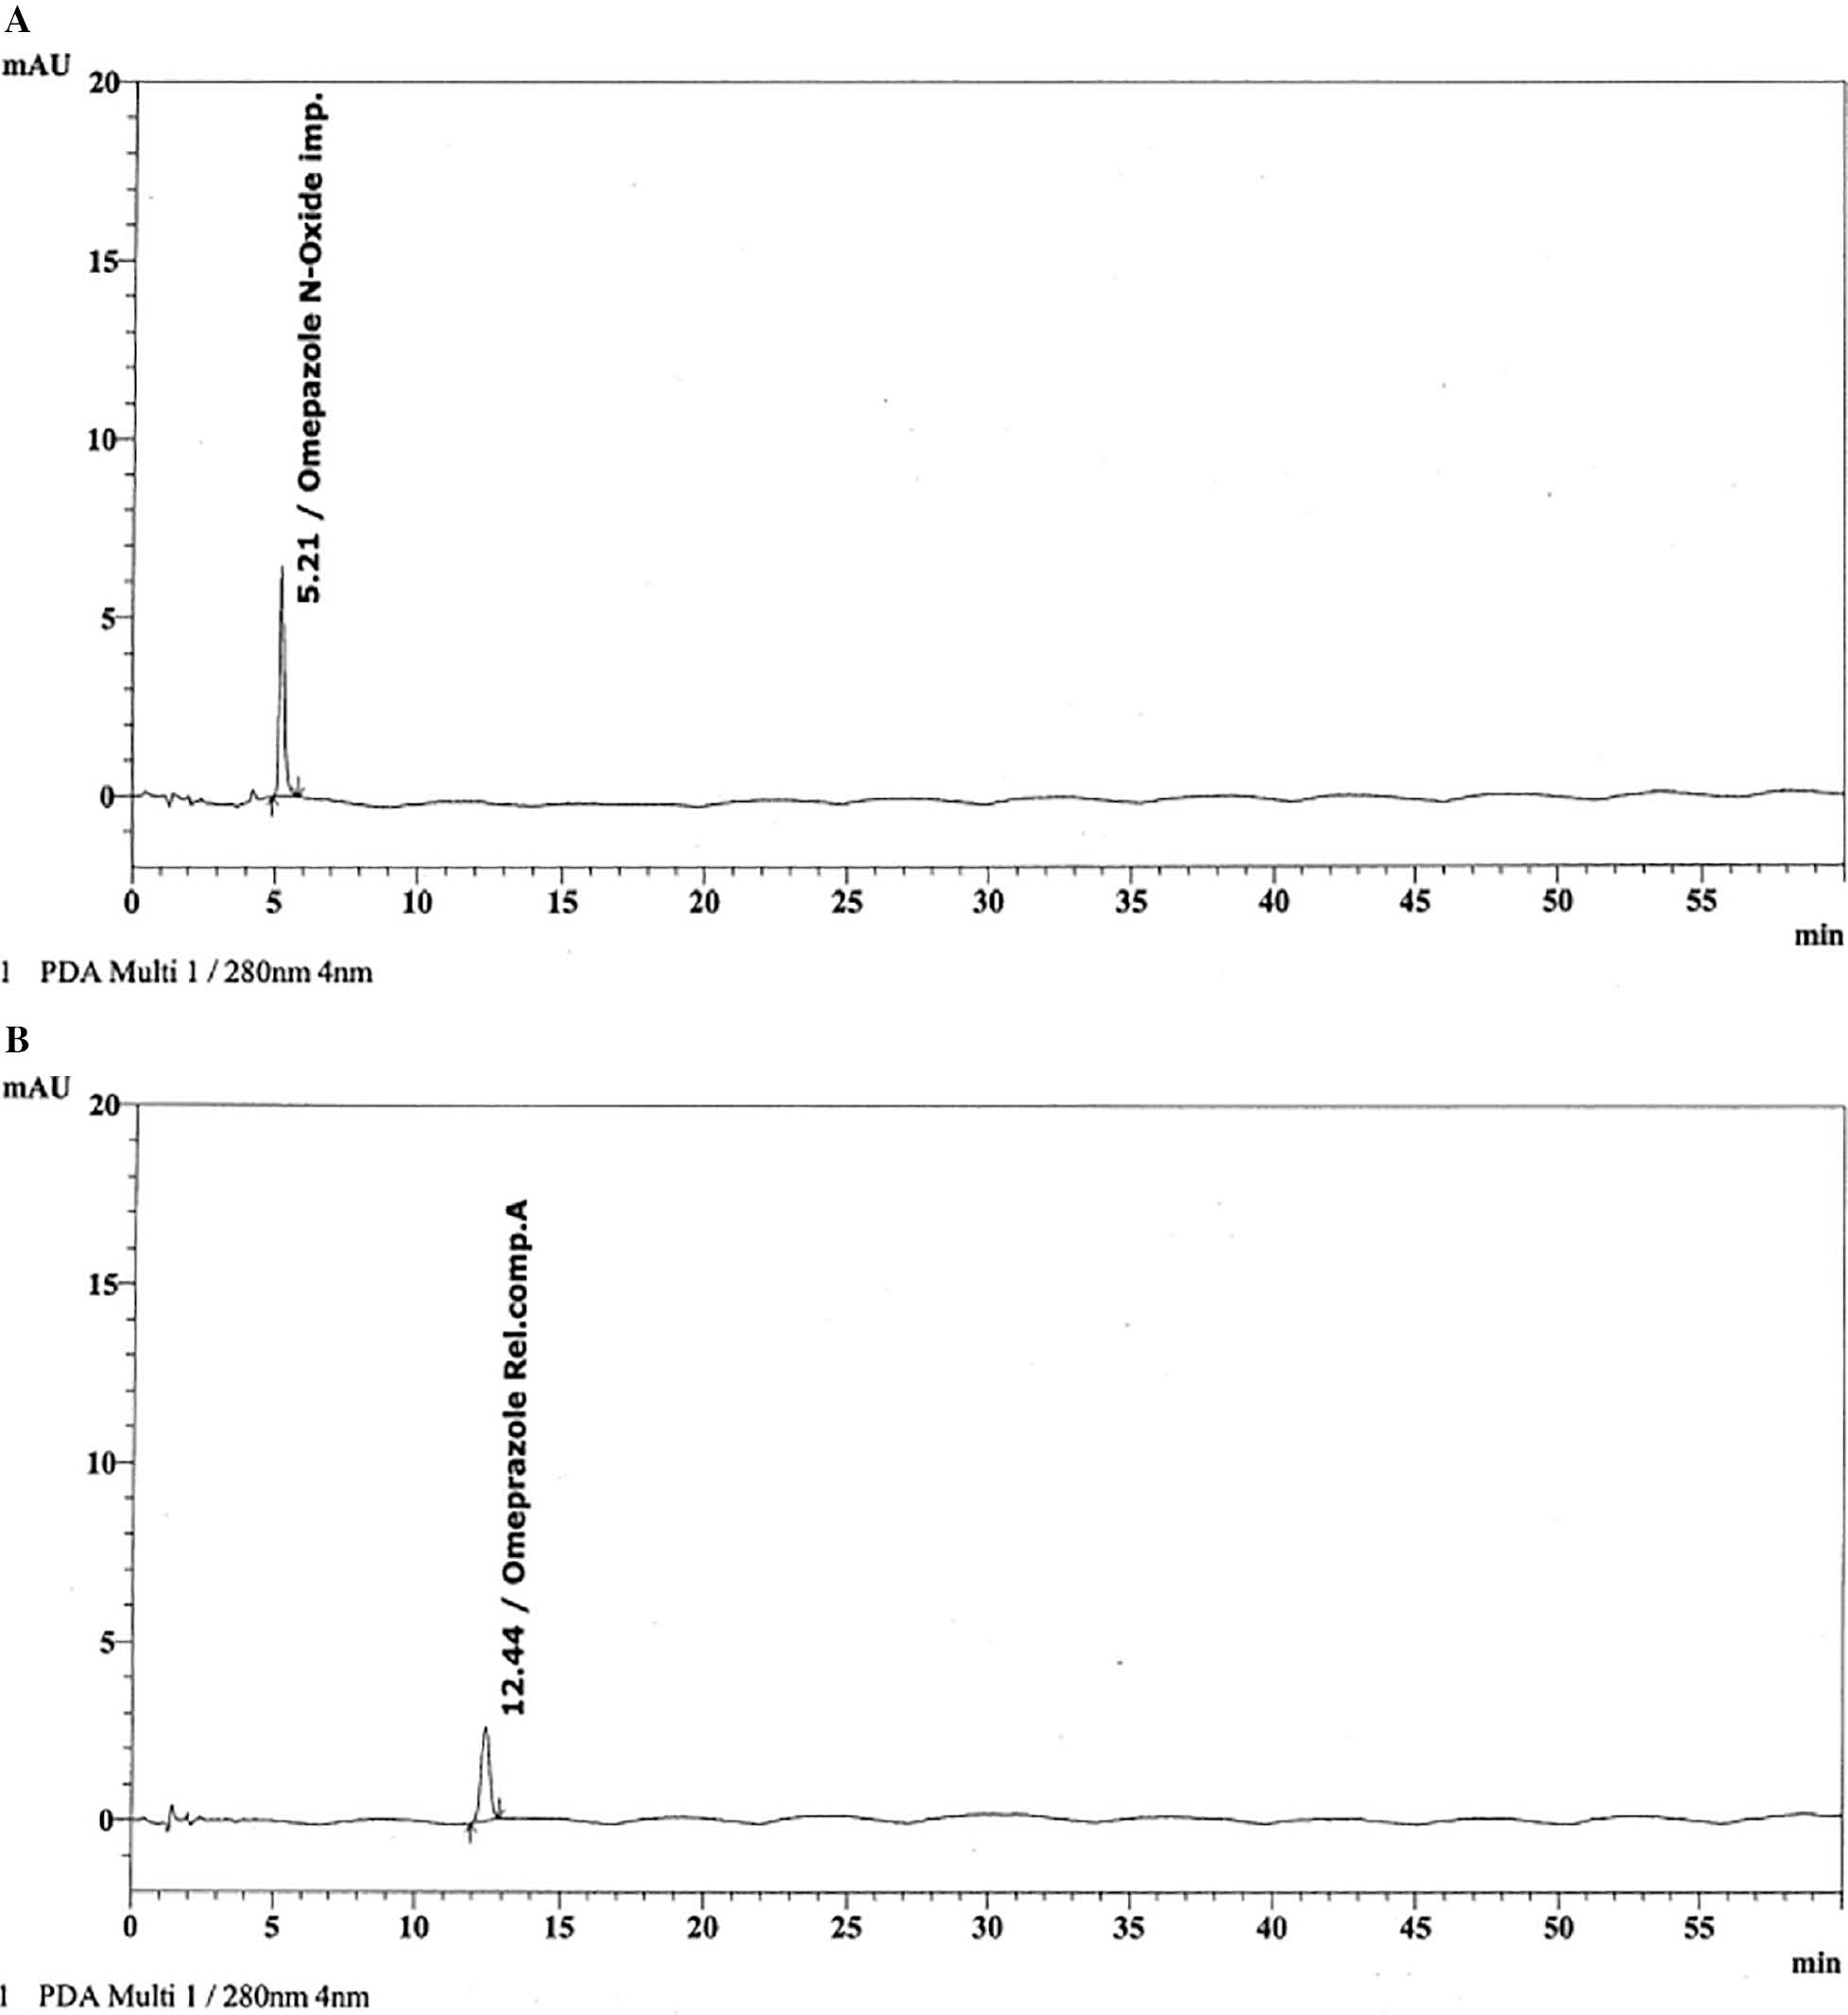
Table 3 Degradation Study Results for Drug Product
| Sr. No. | Stress Conditions | % Total Impurities | Peak Purity Index |
Single Point Threshold | Peak Purity Criteria of Esomeprazole Peak |
|---|---|---|---|---|---|
| 1 | As such sample | 0.285 | 1.000000 | 0.999990 | Pass |
| 2 | Acid degradation: 0.1 M HCl at room temperature for 15 min | 0.467 | 1.000000 | 0.999990 | Pass |
| 3 | Alkali degradation: 0.1 M NaOH in a water bath at 60°C for 60 min | 0.629 | 1.000000 | 0.999990 | Pass |
| 4 | Oxidation degradation: 0.03% H2O2 at room temperature for 10 min | 13.187 | 1.000000 | 0.999990 | Pass |
| 5 | Heat degradation (solid-state): Expose the sample at 60°C for 24 h | 0.236 | 1.000000 | 0.999990 | Pass |
| 6 | Humidity degradation: Expose the sample at 75% RH for 24 h | 0.253 | 1.000000 | 0.999989 | Pass |
| 7 | Photolytic degradation: 1.2 million lux hours and near UV at 200-watt hrs/m2 | 0.294 | 1.000000 | 0.999990 | Pass |
Method validation
The method validation adhered to the guidelines outlined by ICH for validating analytical methods. The objectives of these validations were to confirm the method reliability and efficacy in consistently delivering accurate and precise results.
Specificity
One important aspect that must be evaluated is specificity, which is mandatory as per regulatory ICH Q2(R1) guidelines. The guidelines emphasize how crucial it is that the process be specific to the target analyte and unaffected by other components of the sample. The process ability to identify and measure the target analyte without the interference of matrix elements is ensured by its specificity [30]. The ESO and spiked impurities were recorded for peak purity presented in Table 4 and the chromatogram is shown in Figure 4. In all the conditions the peak purity was passed.
Figure 4 Typical chromatogram of impurity spiked test solution.
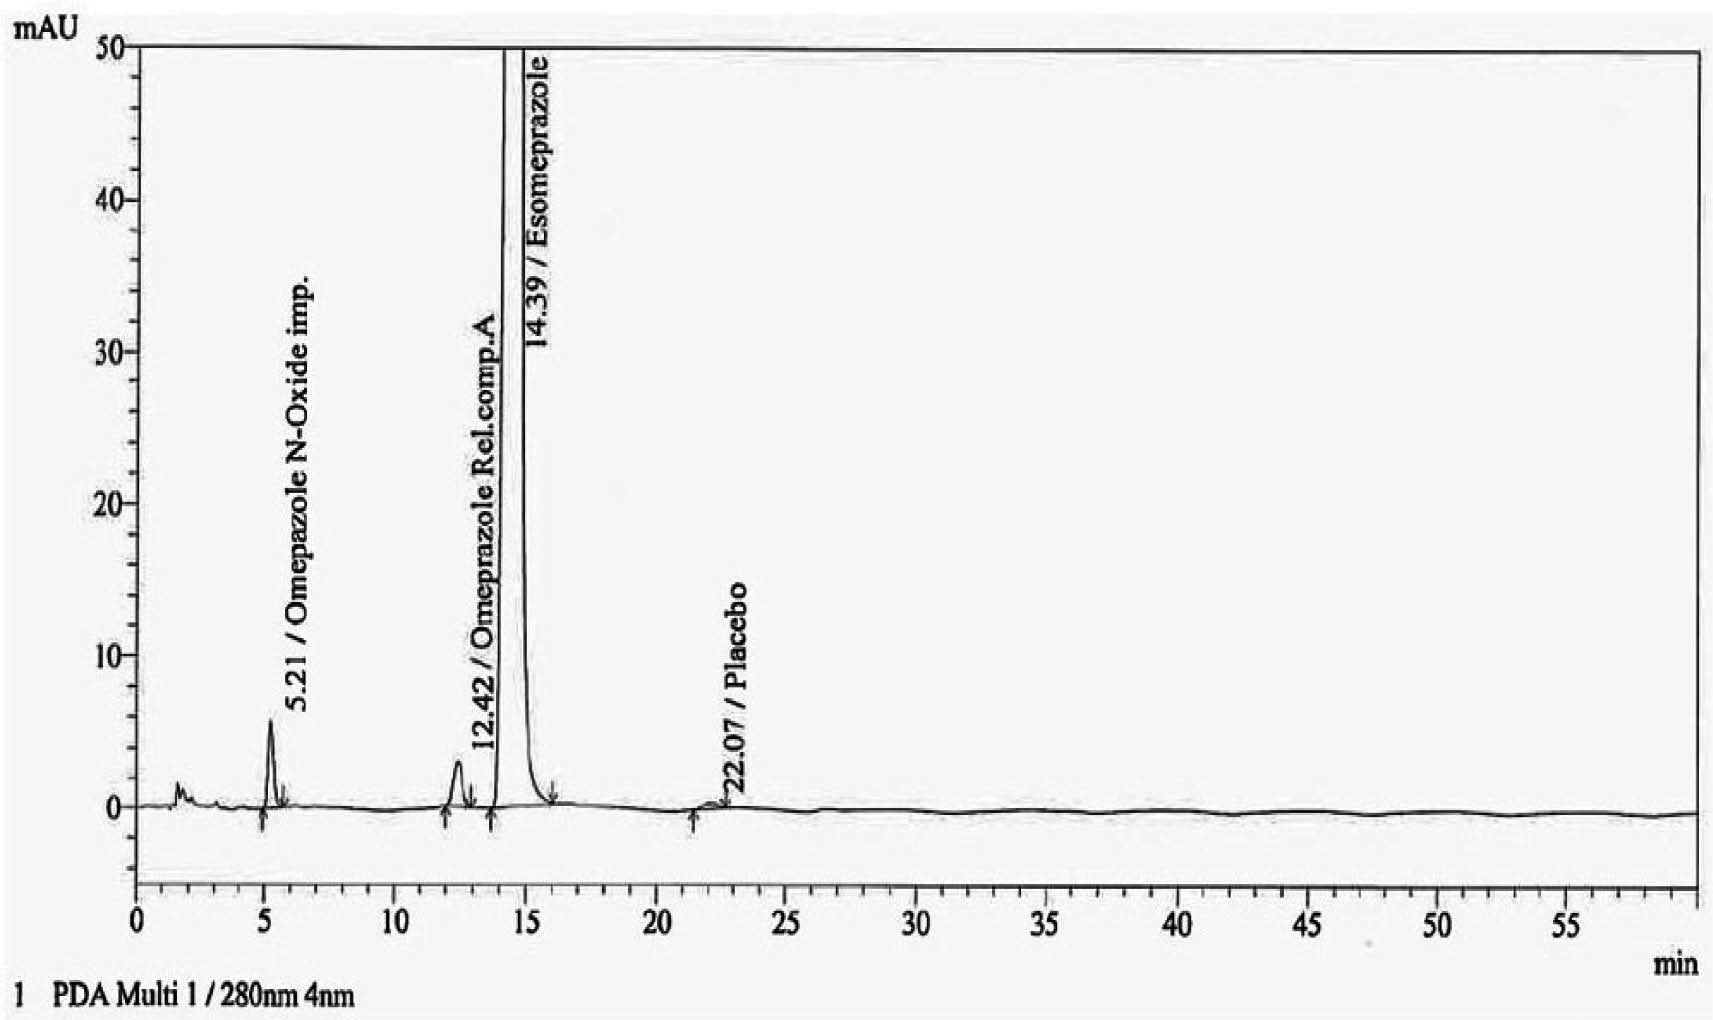
Table 4 Peak Purity of Test Solution and Impurities
| Sample Details | Retention Time | Peak Purity Index | Single Point Threshold |
|---|---|---|---|
| Impurity spike test solution for (40 mg) tablets | |||
| Omeprazole N-oxide | 5.211 | 0.999998 | 0.993094 |
| Omeprazole-related compound A | 12.417 | 1.000000 | 0.979934 |
| Esomeprazole | 14.394 | 1.000000 | 0.999970 |
| Test solution for (40 mg) tablets | |||
| Esomeprazole | 14.386 | 1.000000 | 0.999973 |
Linearity and range
For omeprazole N-oxide, omeprazole-related compound A, and ESO, the developed method was shown to be linear in the concentration ranges of 0.00002–0.00118, 0.00008–0.00121, and 0.00008–0.00122 mg mL−1, respectively. The correlation coefficient (R) for omeprazole N-oxide, omeprazole compound A, and ESO was 1.0000, 0.9999, and 0.9999, respectively, which was within limits; hence, the method was considered to be linear (Table 5).
Table 5 Linearity, LOD, LOQ, and Precision of Esomeprazole and Other Impurities
| Parameters | Omeprazole N-Oxide | Omeprazole-Related Compound A |
Esomeprazole |
|---|---|---|---|
| Linearity | |||
| Range (mg mL−1) | 0.00002–0.00118 | 0.00008–0.00121 | 0.00008–0.00122 |
| Correlation coefficient (R) | 1.0000 | 0.9999 | 0.9999 |
| LOD and LOQ | |||
| LOD (mg mL−1) | 0.00001 | 0.00004 | 0.00004 |
| LOQ (mg mL−1) | 0.00002 | 0.00008 | 0.00008 |
| Precision | |||
| Repeatability (% RSD) | 2.53 | 5.64 | |
| Intermediate precision (% RSD) | 3.59 | 4.20 | |
LOD and LOQ
As per ICH guidelines, there are three distinct approaches (visual evaluation, S/N ratio, and slope method) that can be used to determine the LOD and LOQ for a given analytical method. In the current study we selected the S/N ratio. LOD and LOQ are essential criteria in the development of HPLC methods that characterize the method sensitivity. The lowest amount of an analyte that can be accurately identified at a S/N of 3:1 is known as the LOD. The LOD is the lowest concentration of the analyte that is distinguishable, but not usually precisely quantified.
The LOQ is the smallest quantity of an analyte that can be accurately measured with a 10:1 S/N [23]. The developed method is exceptionally sensitive and can detect minute amounts of analyte from the test samples because of the extremely low LOD and LOQ values, as mentioned in Table 5.
Precision
A precision study evaluates the capacity of an analytical method to reliably produce results with a high level of repeatability and reproducibility, making a precision study an essential part of method validation. Through the assessment of potential differences arising from many sources during the analytical process, precision offers valuable insights regarding the method reliability [23]. The lower percentage Relative Standard Deviation (RSD) in a precision study indicates that the method demonstrates good recovery values and is considered accurate. The precision for the analysis of each impurity was shown to be satisfactory (Table 5).
Accuracy
The accuracy study is a crucial component of method validation because the accuracy study offers a thorough evaluation of the method capacity to provide findings that accurately represent the real values of the analytes under investigation. This important feature ensures that the process can yield unbiased, dependable outcomes, which add to the analytical process overall validity and reliability [23]. All recovery results found within the specified limits (i.e., the percent recovery should be between 90.0 and 110.0 for the 50%–150% level and the RSD of percent recovery should be <10.0% (Table 6).
Table 6 Recovery Study Results of Impurities
| Parameters | Omeprazole N-Oxide | Omeprazole-Related Compound A |
|---|---|---|
| Accuracy (% recovery) | ||
| LOQ (%Mean) | 110 | 109.21 |
| LOQ (%RSD) | 0.0 | 7.52 |
| 50% (%Mean) | 104.86 | 108.48 |
| 50% (%RSD) | 0.42 | 0.59 |
| 100% (%Mean) | 103.16 | 99.28 |
| 100% (%RSD) | 0.36 | 1.74 |
| 150% (%Mean) | 104.25 | 97.91 |
| 150% (%RSD) | 0.08 | 1.07 |
Solution stability
Solution stability is crucial in analytical method development and validation for reliable results. Solution stability ensures accuracy, precision, and consistency over time, and is vital for method validation and regulatory compliance. Instability can lead to erroneous measurements and affect storage conditions, which impacts product quality in industries, such as the pharmaceutical industry. Stability studies guide appropriate storage and quality control measures, especially for long-term analysis [31]. Overall, maintaining solution stability is fundamental for preserving integrity, meeting regulatory standards, and ensuring the credibility of analytical results across diverse sectors. As shown in Table 7, the initial impurity of omeprazole N-oxide and omeprazole-related compound A was 0.021% and 0.134%, respectively. At the end of 24 h there was no significant increase in percent impurity. The study confirms the stability of the solution for 24 h.
Table 7 Solution Stability Results of Omeprazole N-Oxide and Omeprazole-Related Compound A
| Parameters | Omeprazole N-oxide | Omeprazole-Related Compound A |
|---|---|---|
| % Impurities in sample up to 24 h | ||
| Initial | 0.021 | 0.134 |
| After 8 h | 0.022 | 0.169 |
| After 16 h | 0.023 | 0.190 |
| After 24 h | 0.022 | 0.197 |
Robustness
The development of an analytical technique employing HPLC places significant importance on robustness as a crucial parameter [32]. This study determines the method ability to tolerate small changes in experimental parameters, including pH and MPC. Remarkably, the dependent variables under investigation were not compromised by changes in the composition of the mobile phase and pH.
Optimization trials using CCD
CCD was used to develop and optimize the analytical method for the estimation of impurities of ESO. The dependent and independent factors were already captured and discussed in the experimental section and were considered to optimize and validate the analytical method. All optimization trial results are shown in Table 8.
Table 8 Optimisation Trial Results of CCD
| Run | Factor | Dependent Variables | ||
|---|---|---|---|---|
| pH (A) | Mobile Phase Composition (MPC) (Buffer: Acetonitrile) |
Resolution (Y1) | Retention Time (Min) (Y2) | |
| 1 | 7.2 | 73:27 | 1.34 | 8.9 |
| 2 | 8.0 | 73:27 | 7.50 | 8.2 |
| 3 | 7.2 | 77:23 | 2.25 | 16.0 |
| 4 | 8.0 | 77:23 | 10.56 | 15.2 |
| 5 | 7.2 | 75:25 | 1.73 | 11.9 |
| 6 | 8.0 | 75:25 | 8.06 | 10.6 |
| 7 | 7.6 | 73:27 | 5.54 | 8.7 |
| 8 | 7.6 | 77:23 | 7.73 | 16.5 |
| 9 | 7.6 | 75:25 | 6.46 | 11.4 |
Resolution refers to the separation of two adjacent peaks or components in a chromatogram in HPLC method development. Resolution is a critical parameter because resolution indicates how well the HPLC system distinguishes and separates different analytes within a mixture. A higher resolution value indicates better separation between peaks [23]. Achieving good resolution is essential in HPLC method development to ensure accurate quantification and identification of individual components in a sample. In the current study a higher resolution was observed with an increase in pH and buffer concentration in the MPC. The highest resolution of 10.56 was found at pH 8. A similar observation was noted for the MPC. The effect of pH on the resolution is presented in Figure 5.
Figure 5 Increase in pH of the buffer and mobile phase composition leads to increase in resolution. (A) Contour plot (B) 3D plot (C) Factorial plot resolution.
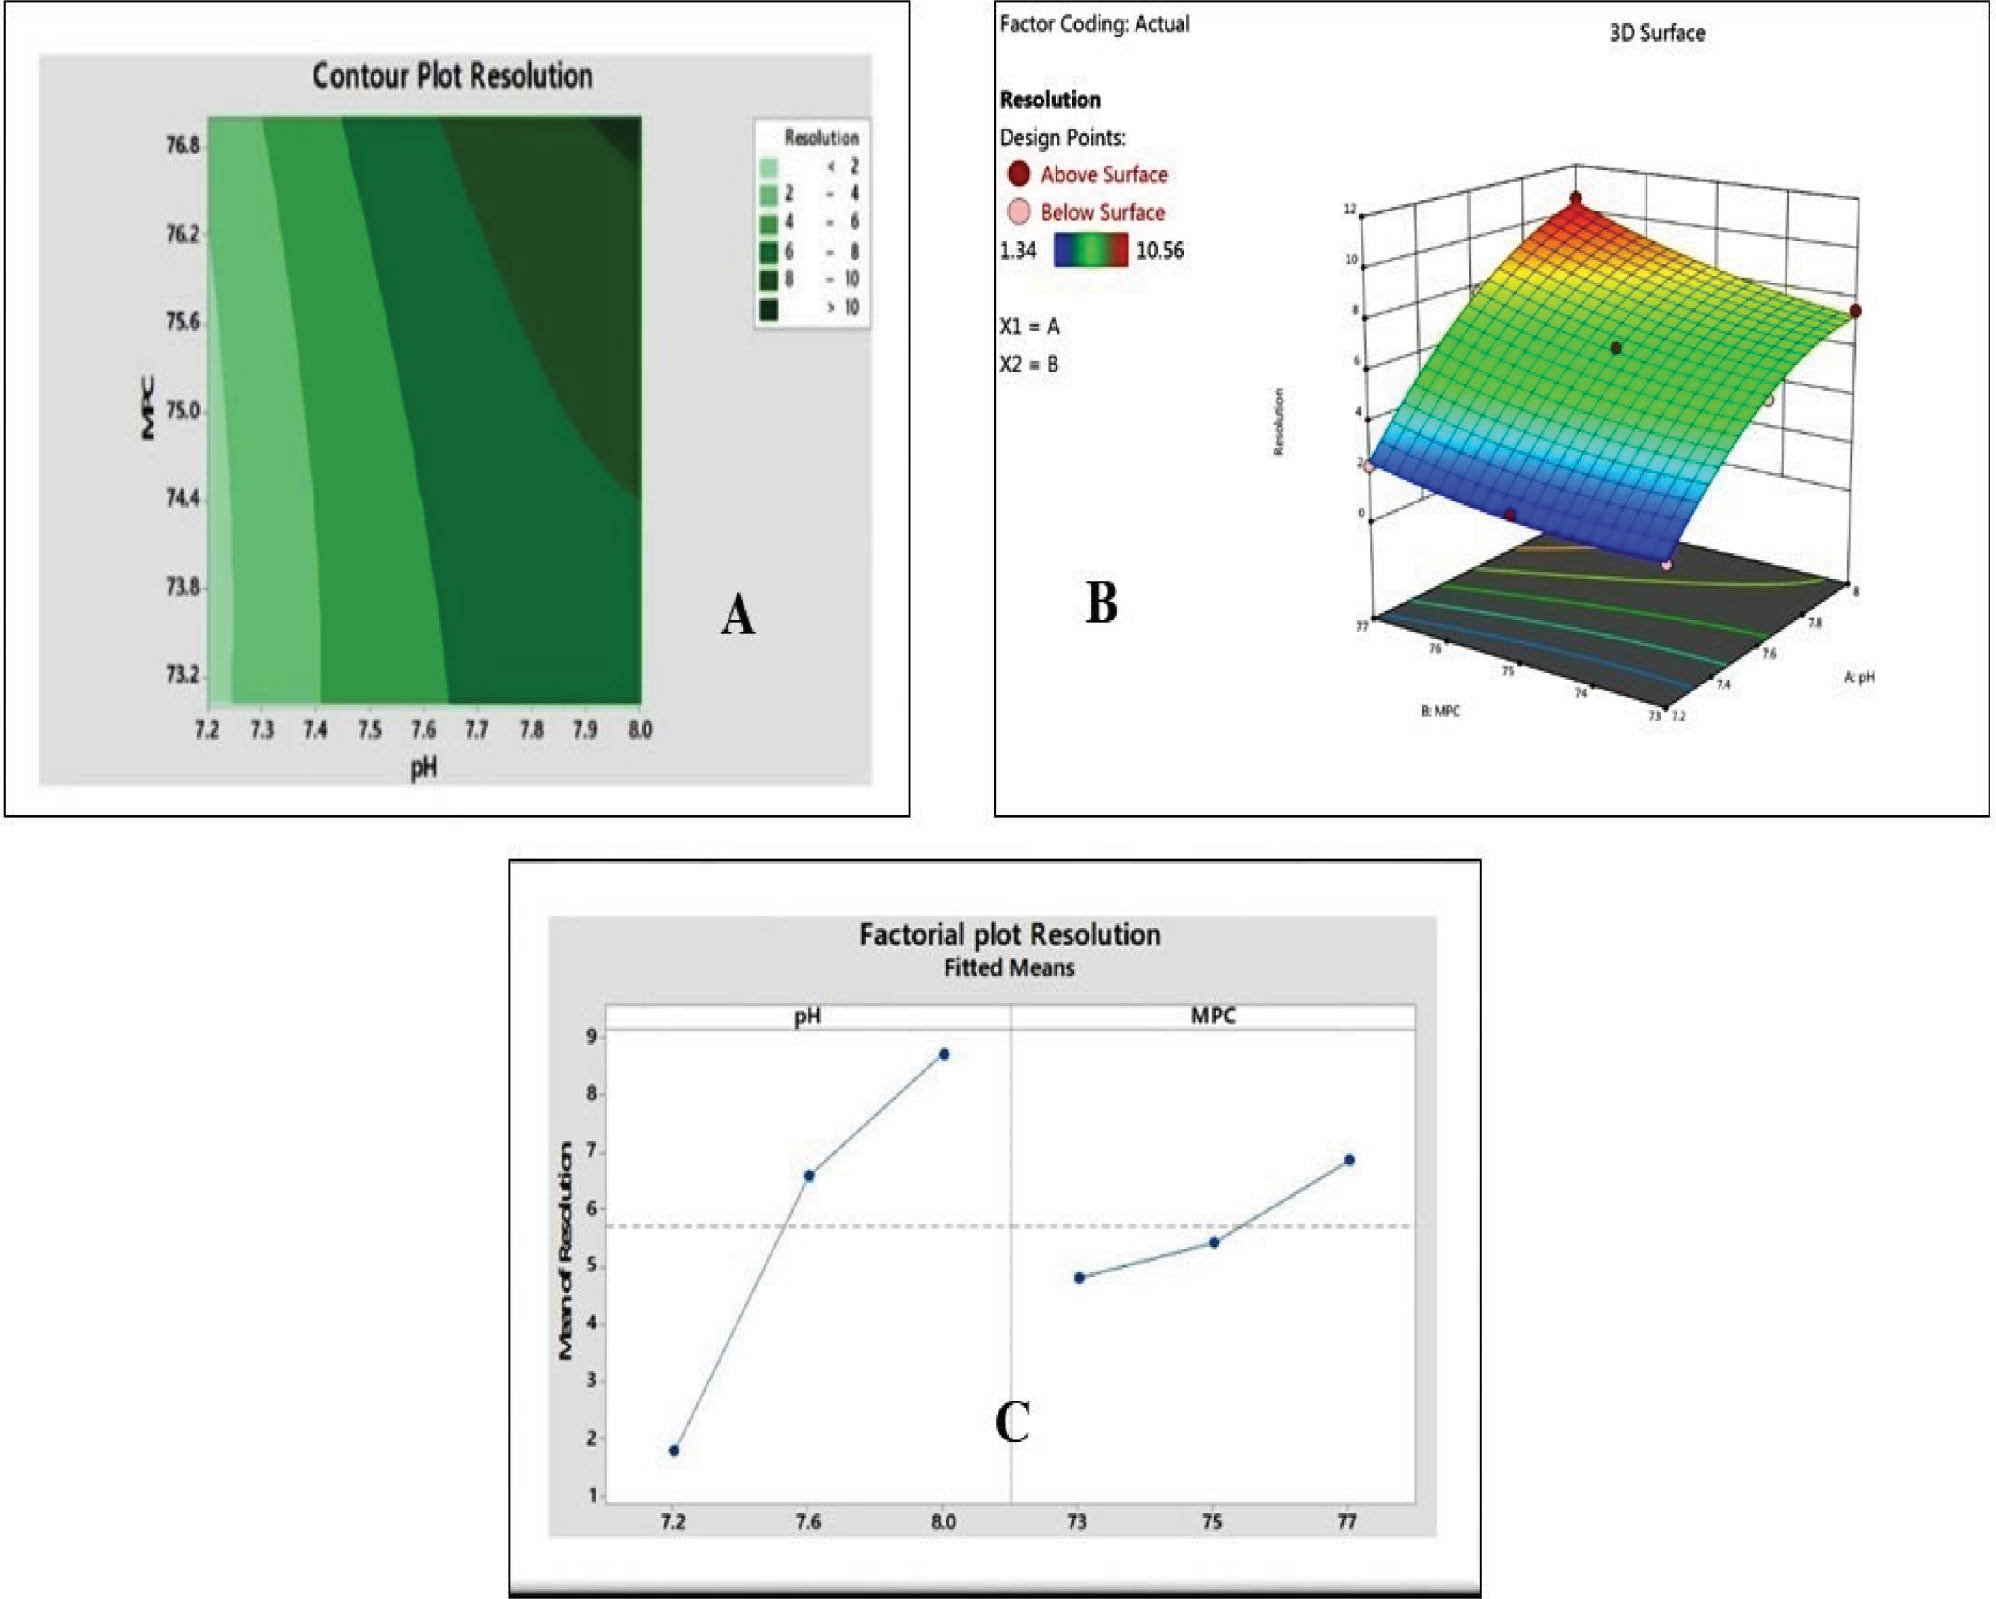
Retention time is crucial while developing an HPLC method. Retention time is an important parameter that represents how long it takes a solute to go through a chromatographic column and reach the detector [33, 34]. Retention time is important because it may reveal important things about how the chemicals in a sample are separated and identified. Analysts may improve HPLC methods to separate target molecules more effectively with respect to resolution, selectivity, and overall efficiency by understanding and controlling retention times. In a variety of analytical applications, such as pharmaceutical analysis, environmental monitoring, and quality control in companies, this is crucial for producing reliable and precise findings [35, 36]. In the current study, a higher RT was observed with an increase in pH and buffer concentration in the MPC.
Using the DoE approach, we identified the MODR for our chromatographic method. We discovered a buffer composition of 75%–77% and pH 7.6 yielded optimal results, as shown in Figure 6.
Figure 6 (A) Method operable design range; (B) response optimizer.
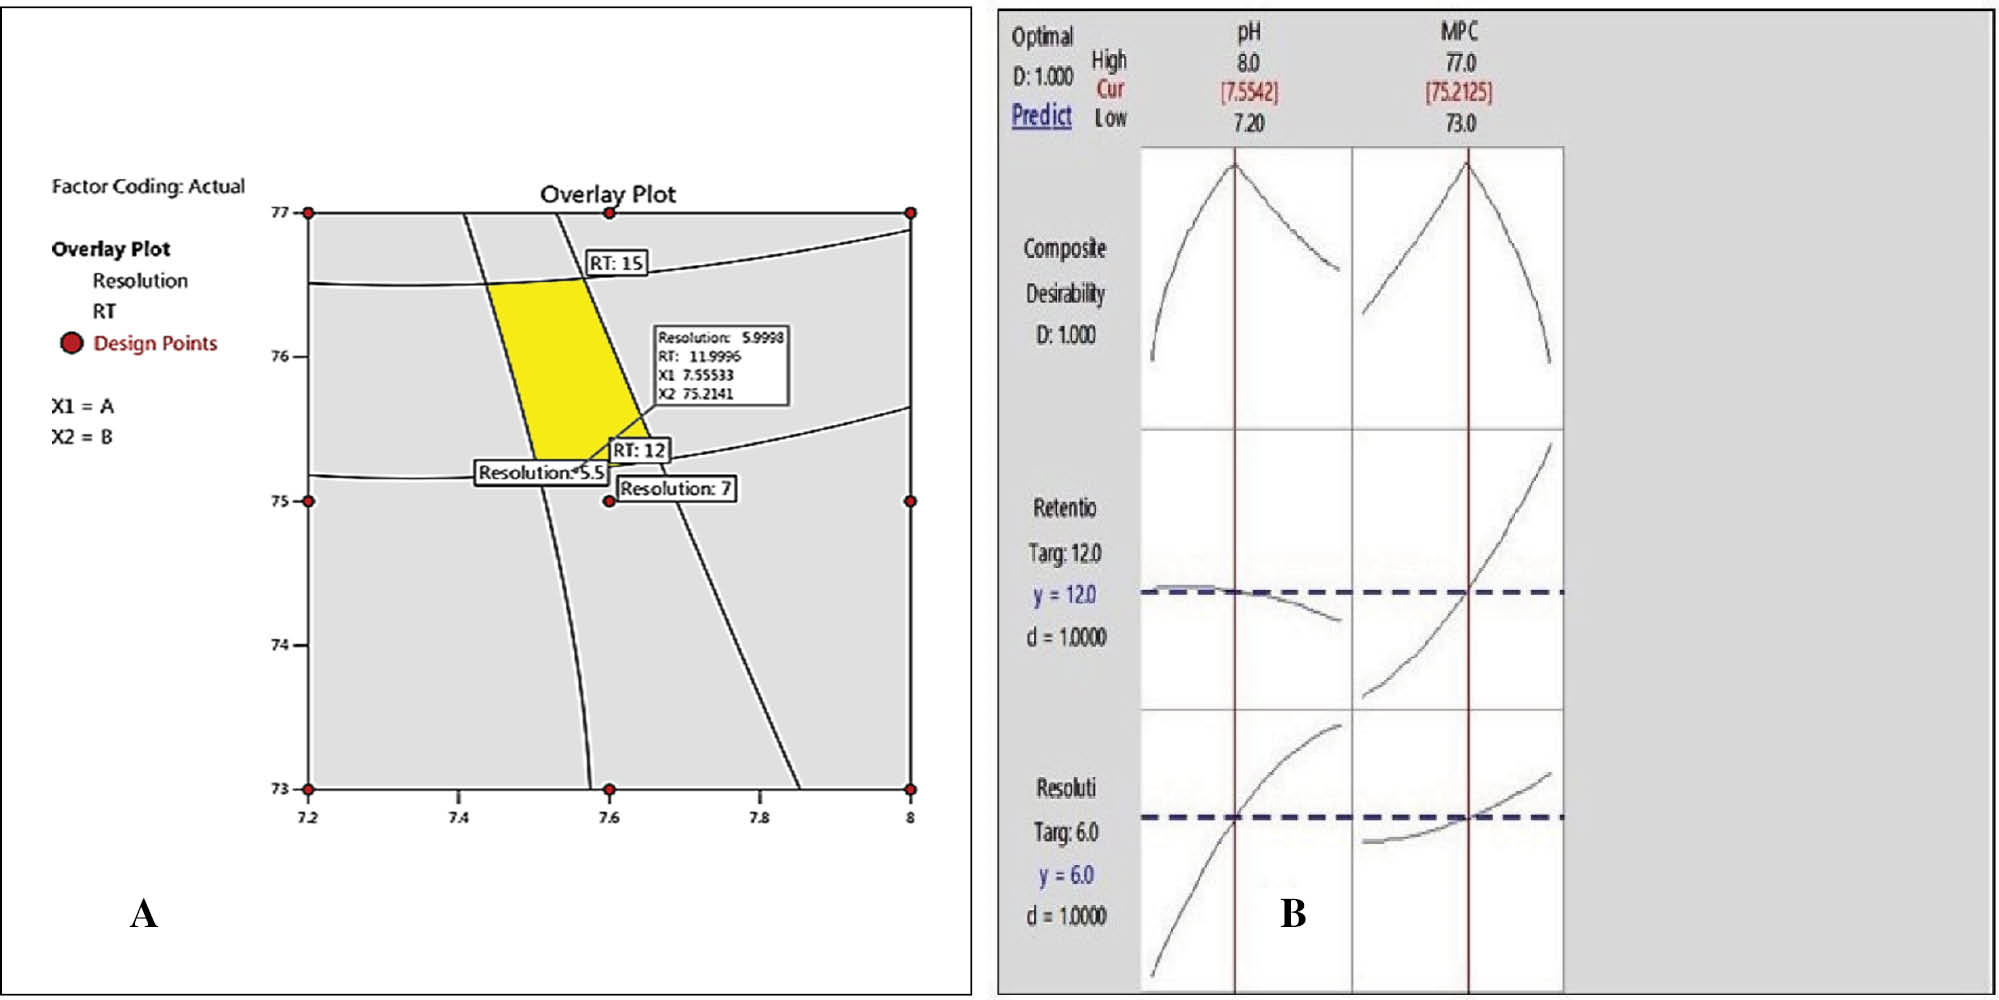
By using Design Expert software, we confirmed that a 75% buffer solution, 25% acetonitrile, and pH 7.6 were the ideal conditions. This led to successful peak resolution and established parameters like RT, relative retention rime, and relative response factor, which ensures a reliable and robust method. The implementation of DoE was instrumental in optimizing the method and achieving accurate outcomes.
Conclusion
The AQbD approach is indispensable for optimizing a stable and reliable RP-HPLC method to detect impurity degradation in ESO. By using DoE, we thoroughly assessed chromatographic conditions, which minimalized potential risks. Method validation covered precision, linearity, specificity, robustness, ruggedness, accuracy, LOD, and LOQ. This validated method effectively supports the routine analysis of ESO impurities and degradation products in tablet formulations. These findings offer crucial insight to analysts, aiding in the early detection of potential issues during ESO analysis and facilitating the application of corrective measures.
Acknowledgement
The authors are grateful to Zuventus Healthcare Ltd. for providing laboratory facilities for this research work.
Conflicts of interest
The authors declare that they have no competing interests.
Author contributions
Vikas Mohite was responsible for the study conception, design, and data collection. Analysis was performed by Sushma Kakade, Vitthal Dighe, and Shubham Bhange. Data interpretation was performed by Dr. Vikram Gharge and Balasaheb Jadhav. The crucial intellectual ideas have been revised and written by Anil Gadhe.
References
- Jain DK, Jain N, Charde R, Jain N. The RP-HPLC method for simultaneous estimation of esomeprazole and naproxen in binary combination. Pharm Methods 2011;2(3):167-72. [PMID: 23781450 DOI: 10.4103/2229-4708.90356]
- Andersson T, Hassan-Alin M, Hasselgren G, Röhss K, Weidolf L. Pharmacokinetic studies with esomeprazole, the (S)-isomer of omeprazole. Clin Pharmacokinet 2001;40:411-26. [PMID: 11475467 DOI: 10.2165/00003088-200140060-00003]
- Scott LJ, Dunn CJ, Mallarkey G, Sharpe M. Esomeprazole: a review of its use in the management of acid-related disorders. Drugs 2002;62(10):1503-38. [PMID: 12093317 DOI: 10.2165/00003495-200262100-00006]
- Li XQ, Andersson TB, Ahlström M, Weidolf L. Comparison of inhibitory effects of the proton pump-inhibiting drugs omeprazole, esomeprazole, lansoprazole, pantoprazole, and rabeprazole on human cytochrome P450 activities. Drug Metab Dispos 2004;32(8):821-7. [PMID: 15258107 DOI: 10.1124/dmd.32.8.821]
- Patel D, Patel N, Vaishy R, Patel V, Solanki C, et al. Development and validation of RP-HPLC method for simultaneous estimation of aspirin and esomeprazole magnesium in tablet dosage form. J Chem 2013;2013:1-2. [DOI: 10.1155/2013/751940]
- Gawande VV, Chandewar AV. Spectroscopic estimation of esomeprazole magnesium in solid dosage form. Int J Pharm Technol 2010;2(3):617-22.
- Prabu SL, Shirwaikar A, Shirwaikar A, Kumar CD, Joseph A, et al. Simultaneous estimation of esomeprazole and domperidone by UV spectrophotometric method. Indian J Pharm Sci 2008;70(1):128-31. [PMID: 20390100 DOI: 10.4103/0250-474X.40351]
- Önal A, Öztun ÇA. Development and validation of high performance liquid chromatographic method for the determination of esomeprazole in tablets. J. Food Drug Anal 2006;14(1):8. [DOI: 10.38212/2224-6614.2503]
- Reddy PS, Sait S, Vasudevmurthy G, Vishwanath B, Prasad V, et al. Stability indicating simultaneous estimation of assay method for naproxen and esomeprazole in pharmaceutical formulations by RP-HPLC. Der Pharma Chemica 2011;3(6):553-64.
- Shetty R, Subramanian G, Kumar AR, Pandey S, Udupa N. Estimation of esomeprazole in human plasma by reverse phase high performance liquid chromatography. Indian Drugs 2005;42(3):158-61.
- Patel BH, Suhagia BN, Patel MM, Patel JR. Determination of pantoprazole, rabeprazole, esomeprazole, domperidone and itopride in pharmaceutical products by reversed phase liquid chromatography using single mobile phase. Chroma 2007;65:743-8. [DOI: 10.1365/s10337-007-0220-z]
- Zanitti L, Ferretti R, Gallinella B, La Torre F, Sanna ML, et al. Direct HPLC enantioseparation of omeprazole and its chiral impurities: application to the determination of enantiomeric purity of esomeprazole magnesium trihydrate. J Pharm Biomed Anal 2010;52(5):665-71. [PMID: 20338705 DOI: 10.1016/j.jpba.2010.02.021]
- Kumar SA, Harish A, Debnath M, Krishna NS, Saravanan J, et al. A new, simple and accurate method development and validation for simultaneous estimation of esomeprazole and itopride in pharmaceutical dosage form by using RP–HPLC. Res J Pharm Technol 2014;7(2):221-8.
- United States Pharmacopoeia. National formulary (USP42-NF-38). 2016. pp. 1714-1715.
- Indian Pharmacopoeia. Pharmacy council of India, Ghaziabad. 2018, Vol. 2, pp. 1984.
- Teasdale A, Elder D, Harvey J, Spanhaak S. Impurities in new drug substances and new drug products. ICH Q3A/B: key guidelines in the general impurity management process. In: Teasdale A, Elder D, Nims RW, editors. ICH quality guidelines: an implementation guide. Wiley Online Library; 2017. pp. 167-98.
- Borman P, Nethercote P, Chatfield M, Thompson D, Truman K. The application of quality by design to analytical methods. Pharm Tech 2007;31(12):142-52.
- Dongala T, Katakam LN, Palakurthi AK, Katari NK. RP-HPLC stability indicating method development and validation of pseudoephedrine sulfate and related organic impurities in tablet dosage forms, robustness by QbD approach. Anal Chem Lett 2019;9(5):697-710. [DOI: 10.1080/22297928.2019.1696701]
- Murakami FS, Cruz AP, Pereira RN, Valente BR, Silva MA. Development and validation of a RP-HPLC method to quantify omeprazole in delayed release tablets. J Liq Chromatogr Relat Technol 2007;30(1):113-21. [DOI: 10.1080/10826070601034485]
- Blessy MR, Patel RD, Prajapati PN, Agrawal YK. Development of forced degradation and stability indicating studies of drugs—a review. J Pharm Anal 2014;4(3):159-65. [PMID: 29403878 DOI: 10.1016/j.jpha.2013.09.003]
- Raman NV, Mallu UR, Bapatu HR. Analytical quality by design approach to test method development and validation in drug substance manufacturing. J Chem 2015;1-8. [DOI: 10.1155/2015/435129]
- Walfish S. Analytical methods: a statistical perspective on the ICH Q2A and Q2B guidelines for validation of analytical methods. BioPharm Int 2006;19(12):1-6.
- ICH Harmonised Tripartite Guideline. Validation of analytical procedures: text and methodology Q2(R1). 2005;1(20):5.
- Politis SN, Colombo P, Colombo G, Rekkas DM. Design of experiments (DoE) in pharmaceutical development. Drug Dev Ind Pharm 2017;43(6):889-901. [PMID: 28166428 DOI: 10.1080/03639045.2017.1291672]
- Karmarkar S, Garber R, Genchanok Y, George S, Yang X, et al. Quality by design (QbD) based development of a stability indicating HPLC method for drug and impurities. J Chromatogr Sci 2011;49(6):439-46. [PMID: 21682993 DOI: 10.1093/chrsci/49.6.439]
- Orlandini S, Pinzauti S, Furlanetto S. Application of quality by design to the development of analytical separation methods. Anal Bioanal Chem 2013;405:443-50. [PMID: 22941176 DOI: 10.1007/s00216-012-6302-2]
- Subramanian VB, Katari NK, Dongala T, Jonnalagadda SB. Stability-indicating RP-HPLC method development and validation for determination of nine impurities in apixaban tablet dosage forms. Robustness study by quality by design approach. Biomed Chromatogr 2020;34(1):e4719. [PMID: 31634417 DOI: 10.1002/bmc.4719]
- Urmi KF, Nawaz MS, Islam SA. Analytical quality by design approach to RP-HPLC method development and validation for simultaneous estimation of esomeprazole and naproxen in modified-release dosage form. Futur J Pharm Sci 2022;8:1-6. [DOI: 10.1186/s43094-021-00396-z]
- Ghotekar SV, Vishal NK. Stress testing/forced degradation studies and experimental approach for stress studies in analytical chemistry. Int J Sci Res Chem 2020;5(3):24-8.
- Ravisankar P, Navya CN, Pravallika D, Sri DN. A review on step-by-step analytical method validation. IOSR J Pharm 2015;5(10):7-19.
- Shrivastava S, Deshpande P, Daharwal SJ. Key aspects of analytical method development and validation. J Ravishankar Uni 2018;31(1):32-9. [DOI: 10.52228/JRUB.2018-31-1-6]
- Patel KG, Patel AT, Shah PA, Gandhi TR. Multivariate optimization for simultaneous determination of aspirin and simvastatin by reverse phase liquid chromatographic method using AQbD approach. Bull Fac Pharm Cairo Univ 2017;55(2):293-301. [DOI: 10.1016/j.bfopcu.2017.08.003]
- Shankar VK, Wang M, Ajjarapu S, Kolimi P, Avula B, et al. Analysis of docosanol using GC/MS: Method development, validation, and application to ex vivo human skin permeation studies. J Pharm Anal 2022;12(2):287-92. [PMID: 35582396 DOI: 10.1016/j.jpha.2021.08.004]
- Žuvela P, Skoczylas M, Jay Liu J, Bączek T, Kaliszan R, et al. Column characterization and selection systems in reversed-phase high-performance liquid chromatography. Chem Rev 2019;119(6):3674-729. [PMID: 30604951 DOI: 10.1021/acs.chemrev.8b00246]
- Sun L, Jin HY, Tian RT, Wang MJ, Liu LN, et al. A simple method for HPLC retention time prediction: linear calibration using two reference substances. Chin Med 2017;12:16. [PMID: 28642805 DOI: 10.1186/s13020-017-0137-x]
- Kolimi P, Shankar VK, Shettar A, Rangappa S, Repka MA, et al. Development and validation of HPLC method for efinaconazole: application to human nail permeation studies. AAPS PharmSciTech 2022;23(1):63. [PMID: 35091878 DOI: 10.1208/s12249-021-02196-3.