Combined Analysis of Single Cell and Spatial Transcriptome Reveals Regulation of Anti-human TREM2 Agonist Monoclonal Antibody on the Functional Status of Microglia and Identification of Key Subsets and Biomarkers
1Shandong University of Traditional Chinese Medicine, Jinan, China
2Dezhou Municipal Hospital of Traditional Chinese Medicine, Dezhou, China
3Henan Medical University, Xinxiang, China
4Shanghai University of Traditional Chinese Medicine, Shanghai, China
aThis author is the first author.
*Correspondence to: Zhiheng Lin, Shanghai University of Traditional Chinese Medicine, Shanghai, China. E-mail: linzhiheng@shutcm.edu.cn
Received: October 9 2025; Revised: December 24 2025; Accepted: January 21 2026; Published Online: March 1 2026
Cite this paper:
Sun L, Lin J, Song C et al. Combined Analysis of Single Cell and Spatial Transcriptome Reveals Regulation of Anti-human TREM2 Agonist Monoclonal Antibody on the Functional Status of Microglia and Identification of Key Subsets and Biomarkers. BIO Integration 2026; 7: 1–15.
DOI: 10.15212/bioi-2025-0179. Available at: https://bio-integration.org/
Download citation
© 2026 The Authors. This is an open access article distributed under the terms of the Creative Commons Attribution License (https://creativecommons.org/licenses/by/4.0/). See https://bio-integration.org/copyright-and-permissions/
Abstract
Background: Alzheimer’s disease (AD) is a neurodegenerative disorder and the leading cause of dementia worldwide. Microglia, as central nervous system (CNS) resident macrophages, are key to AD pathology. Indeed, microglia aggregation around amyloid-β (Aβ) deposits is an AD hallmark. Triggering receptor expressed on myeloid cells 2 (TREM2) regulates microglial function. TREM2 boosts microglial responses to AD pathologic damage, drives homeostatic activation, and modulates protective pathways. Anti-human TREM2 agonist monoclonal antibody (hT2AB) serves as an alternative TREM2 ligand and has therapeutic potential in TREM2-mutant mouse models. The current study combined single-cell RNA sequencing (scRNA-seq) and spatial transcriptomics to clarify hT2AB molecular and cellular mechanisms in improving AD and analyze microglial dynamics in hT2AB-treated groups during AD progression. Key functional subpopulations and core biomarkers were identified through pseudo-time analysis, cell communication analysis, and transcription factors (TFs) with a focus on the differentiation process of microglia towards a therapeutic phenotype, providing a theoretical basis and potential targets for optimizing AD treatment.
Methods: scRNA-seq, spatial transcriptomics, and deconvolution analysis depicted microglia in AD. Differentially expressed genes underwent enrichment analyses. Pseudotemporal analysis demonstrated microglial dynamic differentiation paths during AD progression and post-hT2AB treatment. The CellChat package constructed the cell communication network. Finally, pySCENIC analysis identified key TFs in key subpopulations.
Results: Seven functionally heterogeneous microglial subpopulations were identified with the C2 subpopulation highly expressed in the hT2AB group subpopulation. The proposed temporal sequence analysis revealed two distinct microglial cell differentiation trajectories, both originating from the C6 and C7 subpopulations and extending in different directions starting from the C2 subpopulation. Lineage1-related subpopulations (C7-C6-C4-C2-C1-C5) when combined with pathway activity scoring were confirmed to align with microglial transformation toward protective phenotypes. This study also identified core biomarkers that were highly expressed in the C2 subpopulation (the critical turning subpopulation of two trajectories). In addition, this study combined the spatial transcriptome data of AD mouse brain tissue sections, providing direct evidence for the spatial distribution of key cell subpopulations and pathways.
Conclusion: This study identified the C2 microglial subpopulation as the key effector regulated by hT2AB in AD pathology. hT2AB was confirmed to guide microglia toward protective differentiation, providing cell-level direct evidence for the therapeutic effect. The results deepen our understanding of AD brain microglial heterogeneity and the hT2AB mechanism of action, offering reliable evidence for developing new AD biomarkers and optimizing TREM2-targeted therapies, and is expected to improve AD clinical outcomes.
Keywords
Alzheimer’s disease; anti-human TREM2 agonist monoclonal antibody; scRNA-seq; spatial transcriptomics.
Introduction
Alzheimer’s disease (AD) [1, 2] is a neurodegenerative disorder marked by an insidious onset and relentlessly progressive course. Clinically, AD is characterized by cognitive impairment, gradual memory loss, and a steady decline in the ability to perform daily activities, all of which profoundly diminish the quality of life. The incidence of AD continues to rise with the acceleration of global population aging, making AD one of the leading causes of disability and mortality among older adults. This trend imposes a significant burden on families, healthcare systems, and the broader socio-economic landscape. Epidemiologic data indicate that approximately 57 million people worldwide were living with dementia in 2021, which is projected to surge to 131.5 million by 2050. As the most important subtype of dementia, AD accounts for 60%–70% of all dementia cases [3]. In addition, data from the Global Burden of Disease (GBD) database showed that the burden of AD has been increasing in the past 20 years, especially in the elderly population in areas with a higher sociodemographic index (SDI) [4, 5]. AD is mainly divided into two categories: early-onset familial hereditary AD, which mostly occurs before 65 years of age and is caused by pathogenic gene mutations (e.g., APP and PSEN1/2) with a clinical proportion of approximately 1%; and late-onset sporadic AD, the most common type of clinical AD, with an age of onset after 65 years in most cases and the risk of onset increasing significantly with age [6]. AD can be divided into a preclinical stage (pathologic changes without obvious symptoms), a mild cognitive impairment stage (mild cognitive impairment but does not affect daily life), and a dementia stage (severe impairment of cognition and activities of daily living). These stage provide an important basis for early intervention and monitoring of the disease [7]. The currently recognized core pathologic mechanisms include chronic inflammation of the central nervous system (CNS), abnormal deposition of β-amyloid (Aβ) to form senile plaques, and hyperphosphorylation of tau protein to form neurofibrillary tangles [8]. These pathologic changes will gradually destroy the structure and function of neurons, eventually leading to neuronal death and cognitive impairment. It is worth noting that microglia, as the inherent macrophages of the CNS, have a key role in the pathologic process underlying AD. Microglia can sense pathologic signals, such as Aβ deposition, and are activated and participate in maintaining homeostasis of the CNS by phagocytosing pathologic substances and regulating neuroinflammation.
In recent years disease modification therapy for the pathologic mechanism underlying AD has gradually become a focus of research activity, including Aβ-targeted therapy, tau protein-targeted therapy, and neuroinflammatory regulation. Studies have shown that lecanemab reduces the early-stage AD amyloid protein markers and improves Aβ deposition in the brain [9]. The antisense oligonucleotide (ASO), BIIB080, can significantly reduce the total and phosphorylated tau protein levels in the CNS and the drug tolerance is good [10]. NAD supplements reduced neuroinflammation in an AD transgenic mouse model through cGAS-STING to regulate the immune response and reduce inflammation damage to neurons [11]. Although research involving AD has been transformed into multi-dimensional exploration and new therapeutic targets and candidate drugs have emerged in an endless stream, the treatment of AD still faces many difficulties and there is an urgent need to explore new research directions.
Microglia are the core regulatory cells in the pathologic process underlying AD, the functional status of which is closely related to the progression of disease. Microglia often accumulate around Aβ plaques in the brains of AD patients. Microglia clear Aβ deposits through phagocytosis and wrap plaques to form a physical barrier and prevent the spread of amyloid fibrils to the surrounding brain tissue, thereby exerting neuroprotective functions [12]. Microglia undergo transformation from a steady state-to-an activated state under the action of pathologic stimuli, such as Aβ deposition and elevated inflammatory factors, in which disease-associated microglia (DAM) is a key subtype of activated microglia. Multiple studies have confirmed that DAM limits the accumulation of neurotoxic substances by enhancing the ability to remove Aβ and other misfolded proteins, and at the same time, regulate the local inflammatory microenvironment and maintain homeostasis of the neuronal survival microenvironment. DAM has an important protective role in regulating AD and other neurodegenerative diseases. Based on these findings, targeted induction or enhancement of microglial activation is thought to be a therapeutic strategy with potential transformation value, providing a new strategy for immune intervention of AD.
Myeloid trigger receptor 2 (TREM2) is a member of the immunoglobulin superfamily. TREM2 has a central regulatory role in biological processes, such as immune regulation, inflammatory responses, and phagocytosis. TREM2 is closely related to AD risk. In addition, TREM2 is closely related to the proliferation, survival, and aggregation of microglia in neurologic lesions and can maintain the metabolic health of microglia [13]. Mechanistic studies have shown that TREM2 is a key regulatory molecule for the differentiation of microglia into the mature DAM phenotype, which can promote the phagocytosis and inflammatory regulation of microglia by activating downstream signaling pathways [14, 15]. TREM2 dysfunction, such as the TREM2 CV or TREM2 R47H mutation, can lead to impaired ligand binding ability, which not only significantly increases AD risk (some mutations can double the risk) but also inhibits microglia activation and aggravates pathologic damage. In contrast, TREM2 agonists, such as the anti-human TREM2 agonist monoclonal antibody (hT2AB), can be used as an alternative ligand for TREM2. hT2AB effectively restores the activation ability of microglia in an AD mouse model carrying the TREM2 mutation. This effect provides a potential therapeutic direction for AD patients with abnormal TREM2 function [16].
The effects of treatment conditions, such as hT2AB treatment, on the functional status of microglia in AD brains and activation status of microglia after treatment were analyzed. Single-cell RNA sequencing (scRNA-seq) [17–21] and spatial transcriptomic (ST) techniques were combined, the purpose of which was to systematically demonstrate the cellular heterogeneity and microenvironment characteristics in the AD brain. As a result, the key microglial subsets sensitive to hT2AB were accurately identified, the regulatory mechanism underlying microglial differentiation towards the beneficial direction of AD treatment was further explored, and potential biomarkers that drive microglia to transform into protective functional phenotypes were screened. Among the potential biomarkers, the key node C2 subpopulation of the two differentiated trajectories deserves particular attention. This study not only provides a new perspective for elucidating the pathogenesis underlying AD but also lays a foundation for the development of precise AD treatment strategies and provides multiple possibilities for clinical transformation. In the future it is expected to develop new AD diagnostic markers based on research findings to guide individualized treatment decisions to better cope with the pathologic complexity and clinical challenges of AD.
Methods
Single-cell sequencing data filtering
The scRNA-seq [22, 23] data used in this study were obtained from the GEO database (GSE156183). Samples, including GSM4726197-GSM4726220, were used. The data included CV, KO, and R47H genotype mice and each mouse was divided into the IgG control and hT2AB treatment groups. ST data were downloaded from the 10× Genomics website (https://www.10xgenomics.com/ [accession number GSM5291793]). Data processing was first performed using R software (v4.3.0) and Seurat software (v4.3.0). DoubletFinder (v2.0.3) was used to eliminate double cells. We eliminated the low-quality cells and polyploid cells and selected the high-quality cells suitable for analysis according to the following strict criteria: nFeature counts between 300 and 7500; nCount between 500 and 60,000; mitochondrial content < 25%; and red blood cell content < 5%. A total of 90,671 filtered cells were retained for further analysis. All data were obtained from public databases and no ethical approval was required.
Cell subpopulation identification
The NormalizeData function in the Seurat R package was used for normalization. The FindVariableFeatures function was applied to identify the top 2000 highly variable genes (HVGs). The ScaleData function was used for standardization. The RunPCA function was used to perform principal component analysis (PCA), which reduced the dimensionality of HVGs, resulting in 30 principal components (PCs). The Harmony package (v1.2.0) was used to reduce batch effects. The Cell Cycle Features function was used to calculate cell cycle phases. A 1.2 resolution was selected based on the quantitative evaluation index. Clustering was performed using FindNeighbors and FindClusters, and the Uniform Manifold Approximation and Projection (UMAP) was applied for visualization. The FindNeighbors and FindClusters functions were utilized for cell clustering. The FindAllMarkers function (parameter, “logfc.threshold = 0.25” and “min.pct = 0.25”) was used and the relevant literature was consulted to identify potential differentially expressed genes (DEGs) and marker genes.
AUCell analysis
AUCell analysis was performed to determine the activity of pathway-related gene sets in cell populations within the scRNA-seq dataset, thereby identifying cells expressing active gene sets.
Pathway and enrichment analysis
Pathway analysis was performed using the clusterProfiler R package (v4.6.2) for Kyoto Encyclopedia of Genes and Genomes (KEGG) and Gene Ontology (GO) enrichment analysis. GO analysis described genes in three categories: biological process (BP); molecular function (MF); and cellular component (CC) [23]. Gene Set Enrichment Analysis (GSEA) [24] was also performed using clusterProfiler package.
Tissue preference analysis
Odds ratios (ORs) and Ro/e indices were calculated to evaluate the distribution and preference of different cell types across tissues. OR values were used to compare subpopulation distributions between tissues, while the Ro/e index quantitatively assessed tissue enrichment to identify tissue-preferential cell populations.
PySCENIC analysis
Single-cell regulatory network inference and clustering (SCENIC) involved co-expression analysis, target gene motif enrichment, and regulon activity evaluation. pySCENIC (v0.12.1), a Python-based implementation of SCENIC, was used to construct gene regulatory networks through co-expression and motif analysis. GRNBoost was applied to calculate co-expression networks and RcisTarget was used for regulon identification. The AUCell algorithm was then used to assess TF activity in each cell.
Pseudotime cell differentiation analysis
CytoTRACE (v0.3.3) was first used to evaluate differentiation potential and investigate subpopulation differentiation during AD progression. Monocle (v2.24.0) was then used to infer cellular differentiation trajectories during disease progression. Finally, Slingshot (v2.8.0) in the R package was applied to construct tree-like structures depicting cell differentiation trajectories and lineage branching.
Cell–cell communication
CellChat (v1.6.1) was used to examine intercellular interactions, focusing on signaling pathways and ligand–receptor pairs. Interactions with a P < 0.05 were considered statistically significant.
ST data analysis
The sample with registration number GSM5291793 was read and preliminary processing was performed with the Seurat R package (v4.3.0). The SCTransform function was used for data normalization. The RunPCA function was used to reduce the dimension. Construction of the SNN graph mainly depends on the first 30 PCA components displayed through the SpatialFeaturePlot function. In addition, the analysis was performed through the Multimodal Intersection Analysis (MIA) framework using the Robust Cell Type Decomposition (RCTD) method. The SpaceXR software package (v2.2.1) was also used for performing deconvolution analysis on cell types.
Analysis of the Multiview Intercellular SpaTial (MISTy) modeling framework
MISTy [25] detected spatial distribution patterns of different cell types or molecular markers in tissue sections to reveal neighboring relationships and potential interactions. MISTy analyzed interactions from multiple perspectives, including intra-, juxta-, and para-view.
Statistical analysis
All analyses were performed using R software (v4.3.0) and Python (v3.9.19). Wilcoxon rank-sum tests and Pearson correlation analyses were used in the current study. A P-value < 0.05 was considered statistically significant.
Results
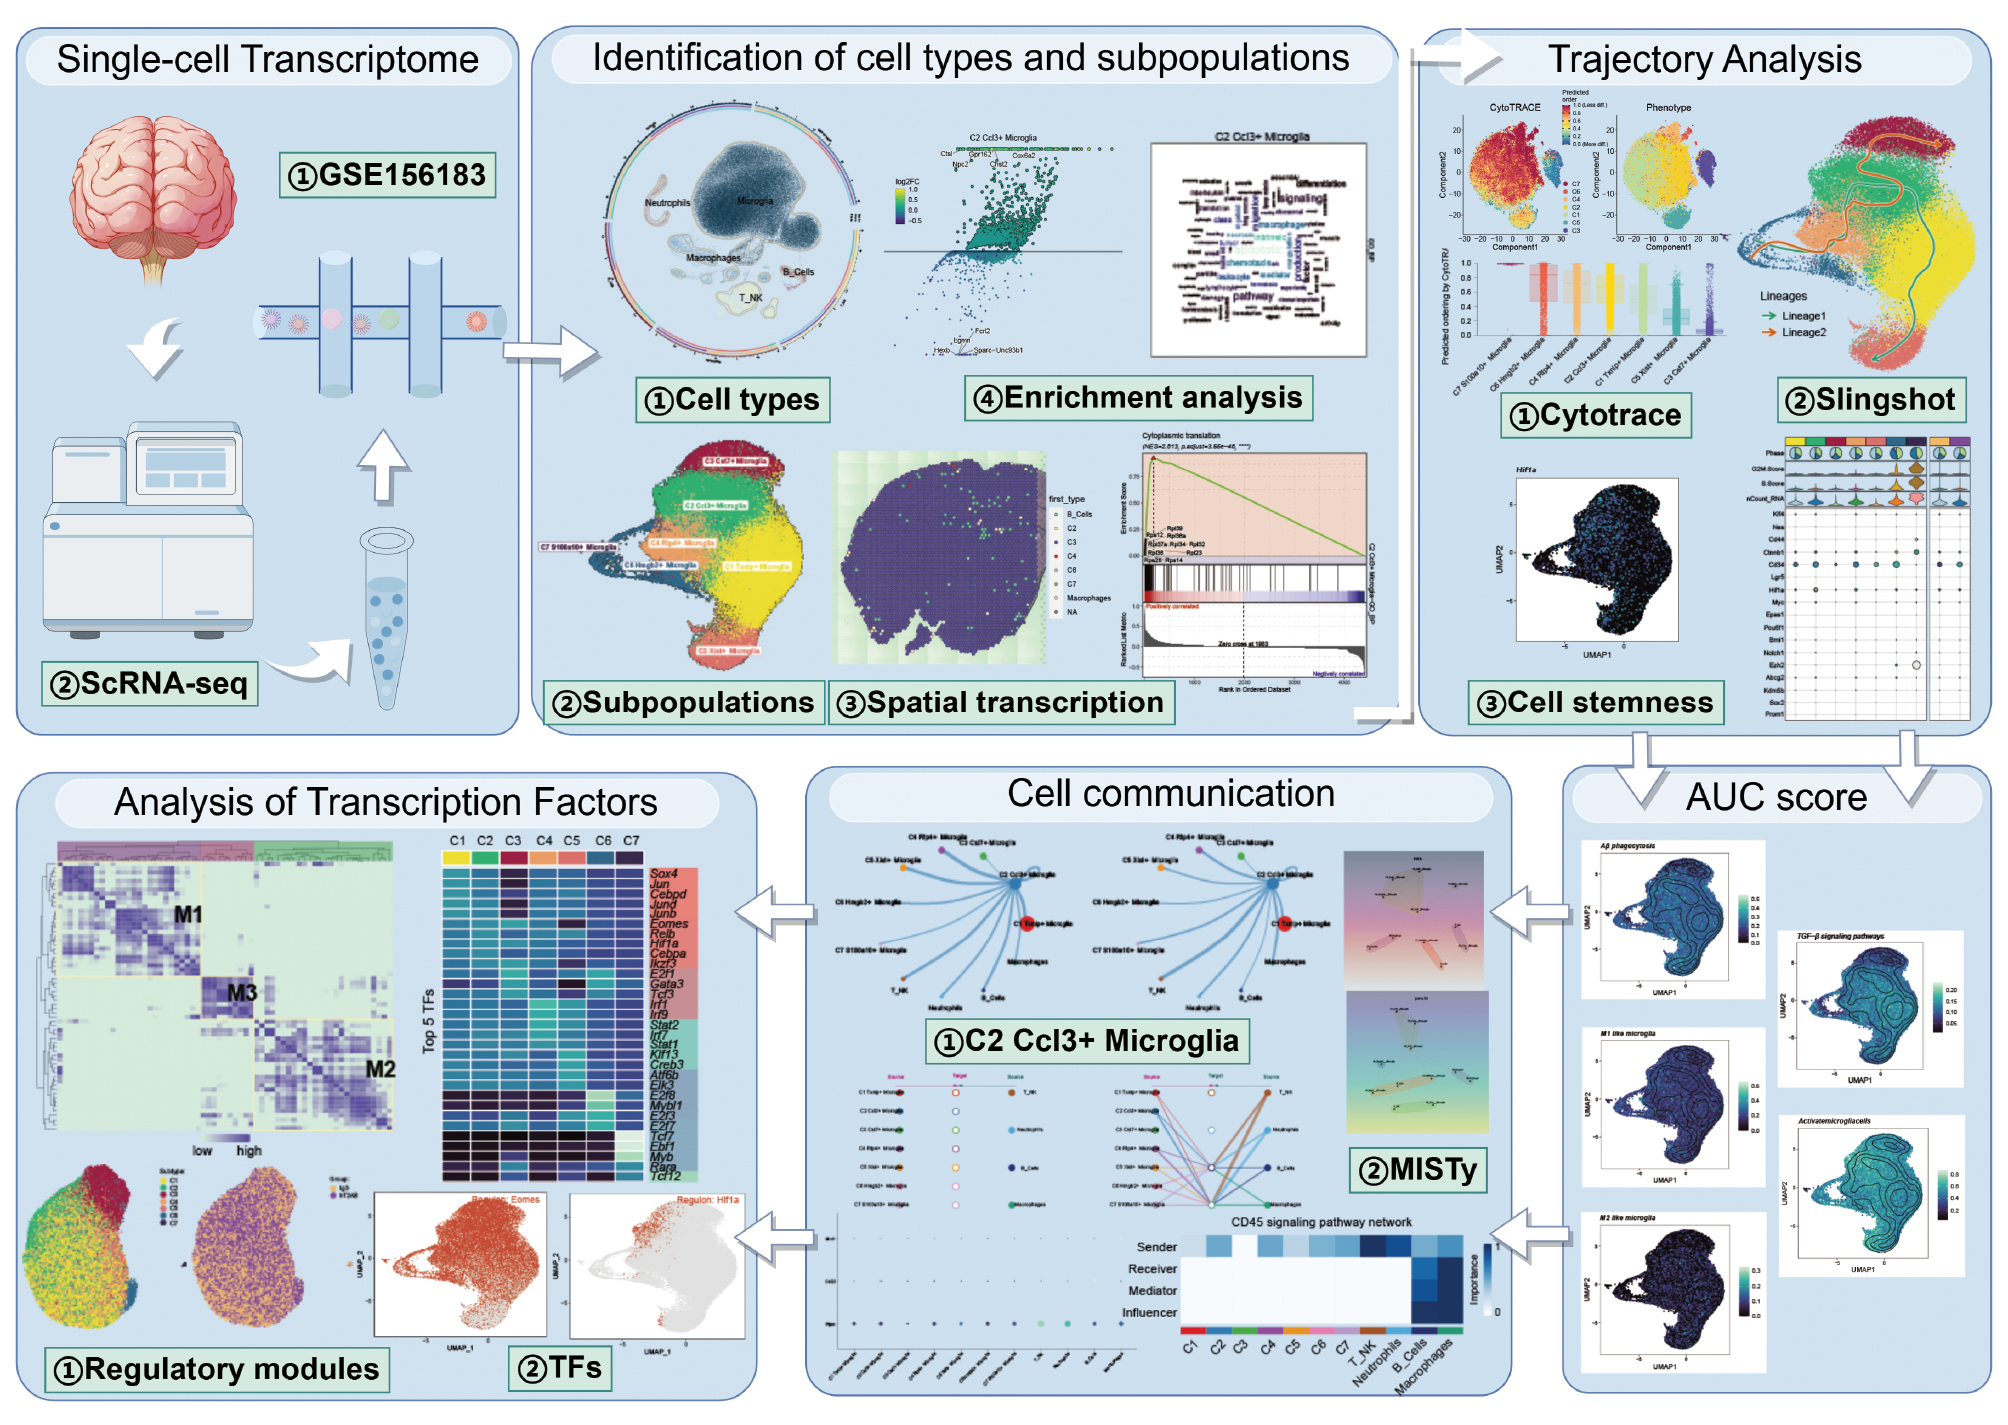
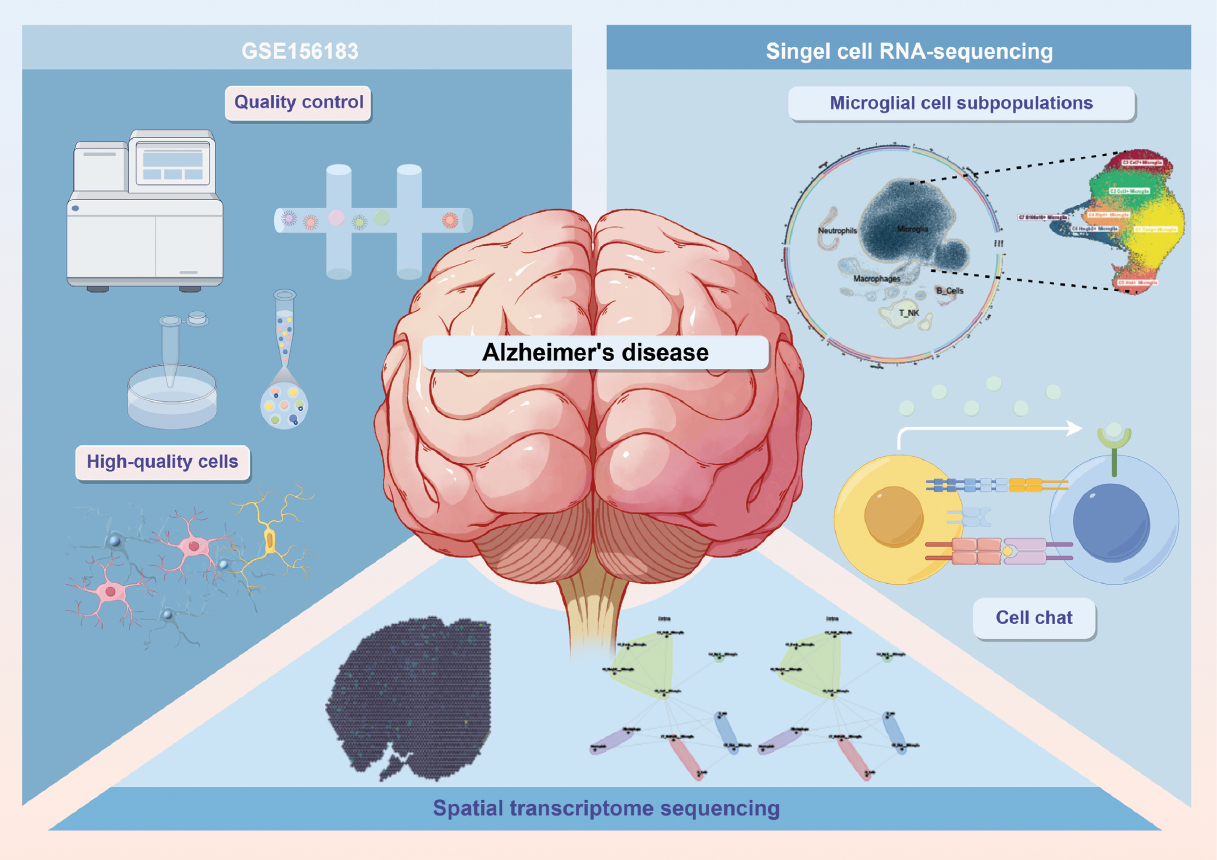
The dataset was analyzed to reveal the complex single-cell landscape of AD. The research methods were shown in Figure 1.
Figure 1 Flowchart.
Identification of the main cell types in AD
The data in GSE156183, which included GSM4726197-GSM4726220, were analyzed first. The cells were classified into five cell types (B cells, microglia, neutrophils, macrophages, and T and NK cells (T-NK cells) through UMAP dimensionality reduction clustering. The Cell Stemness AUC, nCount RNA, G2/M.Score, and S.Score were shown in Figure 2A. The cells were collected from 5XFAD mouse models (endothelial Trem2 knockout). These mice carry one of the two human TREM2 variants (CV and R47H). The KO samples refer to the samples with TREM2 gene knockout. The proportion of the five cell types in different samples (CV, KO, and R47H) and different groups (lgG and hT2AB) were shown below. lgG was the control group and hT2AB was the treatment group. Microglia were dominant in both groups (Figure 2B). In addition, the key genes of each cell type in AD, in which microglia were mainly expressed as Hexb, Olfml3, P2ry12, Sparc, and Tmem119 (Figure 2C, D), are described in detail.
Figure 2 AD group identification. A. The circular graph shows the five cell types obtained through dimensionality reduction clustering, including B cells, microglia, neutrophils, macrophages, and T-NK. The UMAP plots are arranged clockwise from the upper left and show cell stemness AUC, nCount RNA, S.Score, and G2/M.Score. B. The stacked bar graphs shows the distribution of each cell type expression in different groups and samples. The groups include lgG and hT2AB, and the samples include CV, KO, and R47H. Group: dark yellow represents IgG and dark purple represents hT2AB. Phase: green represents the G1 phase, light red represents the G2M phase, and light purple represents the S phase. Cell type: light yellow represents T-NK cells, brown represents neutrophils, dark red represents B cells, dark green represents microglia, and blue represents macrophages. C. Bubble plots display the key genes of each cell type. The color indicates the data normalization and the size of the points corresponds to the fraction of cells in the group. D. The UMAP plot shows the distribution of the five key microglia marker genes. E. Volcano plots show the up- and down-regulated DEGs in B cells, microglia, neutrophils, macrophages, and T-NK cells. F. Heatmap shows the GOBP enrichment of B cells, microglia, neutrophils, macrophages, and T-NK cells. G. GSEA plots show the upregulated biological pathways in microglia. H. The heatmap shows the top five metabolic pathways of microglia, sorted according to AUCell. I, J. The UMAP and bar plots show the distribution and expression of the top five metabolic pathways of microglia.
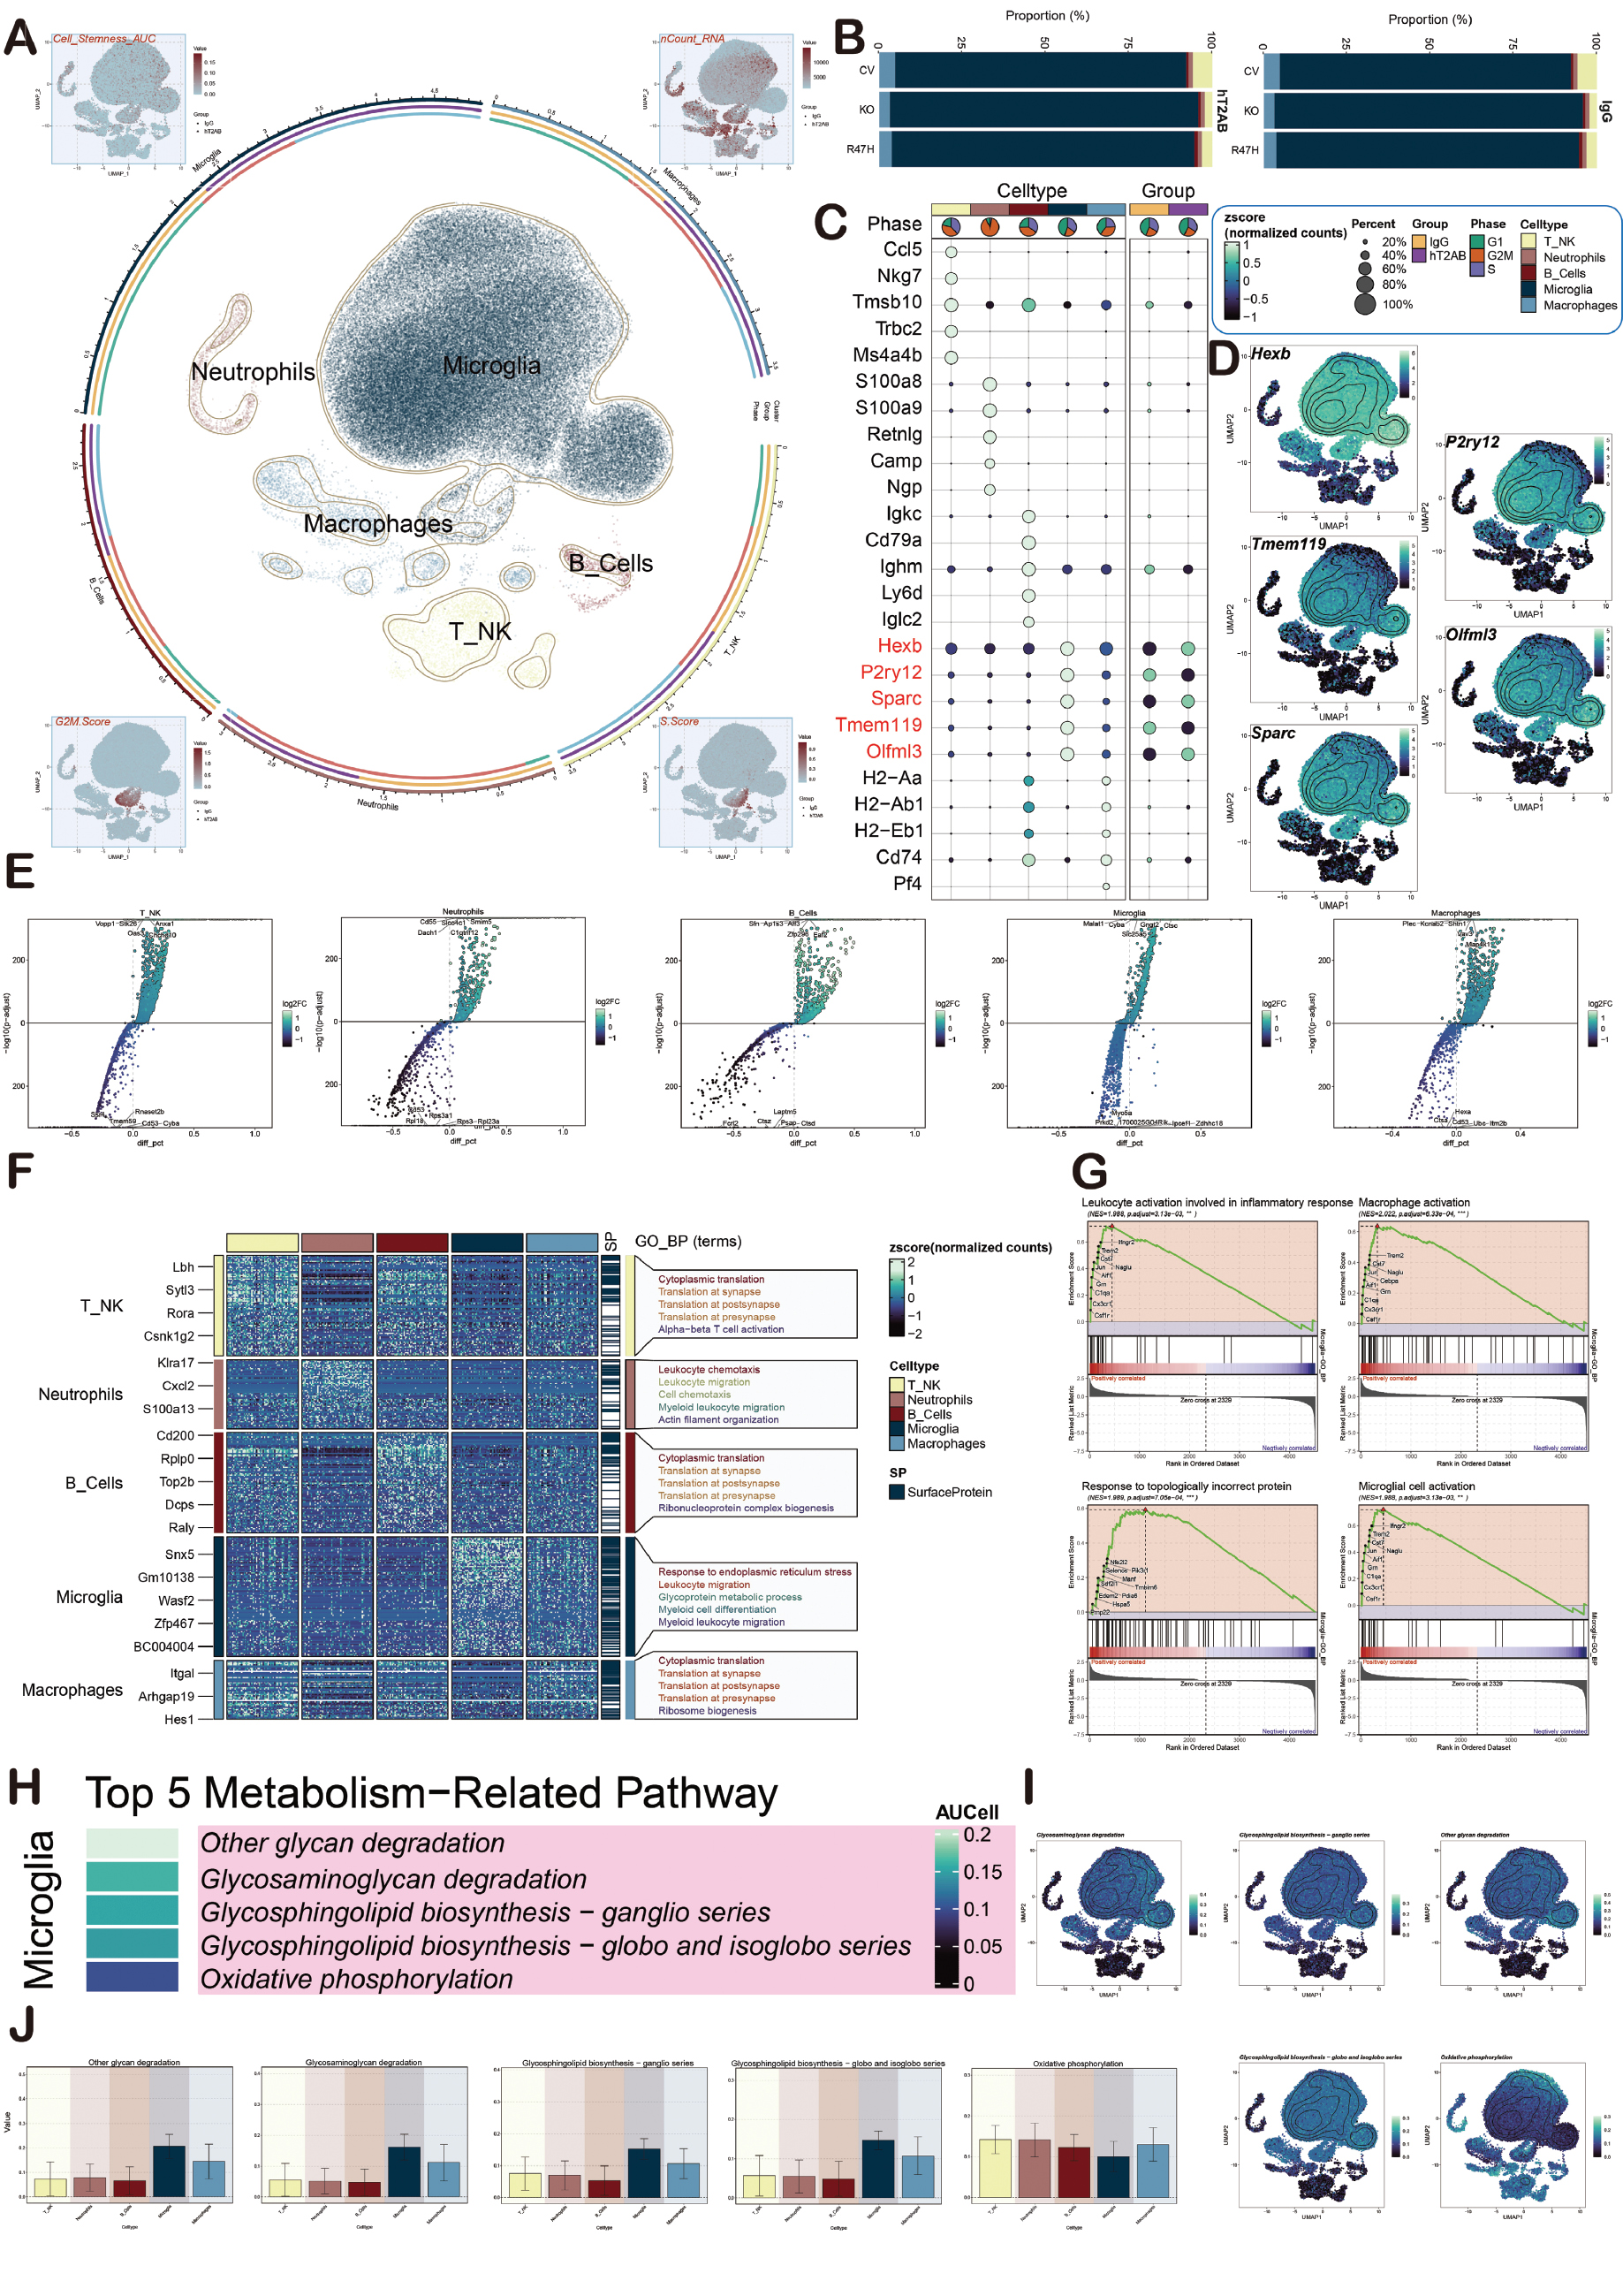
The DEGs of the cell types were presented to understand the functional enrichment of different cell subpopulations in AD (Figure 2E). Then, the heatmap showed the main enriched pathways of these cell subpopulations (Figure 2F). The GSEA plots showed that the main enriched pathways of microglia were leukocyte activation involved in inflammatory responses, macrophage activation, response to topologically incorrect protein, and microglial cell activation. These enriched pathways indicated that microglia have an important role in AD progression (Figure 2G). Microglia were shown to be highly expressed in other glycan degradation, glycosaminoglycan degradation, and glycosphingolipid biosynthesis-ganglio series after analyzing the metabolic-related pathways of each cell type (Figure 2H-J).
An in-depth single-cell visualization analysis of microglia was performed due to the significant role of microglia in AD. UMAP dimensionality reduction clustering was first performed to divide microglia into seven cell subpopulations, including C1 Txnip+, C2 Ccl3+, C3 Cst7+, C4 Rtp4+, C5 Xist+, C6 Hmgb2+, and C7 S100a10+ microglia (Figure 3A). In addition, the Seurat cluster, group, and orig.ident of these cells was revealed (Supplementary Figure 1A). The C7 subpopulation was not considered in the subsequent research because the C7 subpopulation was a small number of cells. Among the key expressed genes of the seven cell subpopulations, the C2 subpopulation mainly highly expressed Apoe, Ccl4, Ccl3, Lpl, and Cd83. It was notable that these genes were all related to microglial activation (Figure 3B). We also present the nFeature, nCount, Cell Stemness AUC, G2/M Score, and S score of these cell subpopulations (Figure 3C). Next, the proportion of the seven cell subpopulations in different groups (IgG and hT2AB) was presented in bar charts. The C2, C4, and C6 subpopulation were more prevalent in the hT2AB group, while the C6 subpopulation mainly expressed a high proliferation state (Figure 3D).
Figure 3 Identification of microglia. A. The UMAP plot shows the seven cell subpopulations obtained through dimensionality reduction clustering of microglia, including C1 Txnip+, C2 Ccl3+, C3 Cst7+, C4 Rtp4+, C5 Xist+, C6 Hmgb2+, and C7 S100a10+ microglia. The sectional diagrams of each subpopulation are also shown. B. The heatmap plot shows the marker genes of the seven cell subpopulations and the color indicates the data normalization. The color gradually changed from dark-to-light and the score increases accordingly. C. The UMAP plot shows the expression of nFeature RNA, nCount RNA, Cell Stemness AUC, G2/M.Score, and S.Score in microglia. D. The stacked bar graphs show the proportion of the seven cell subpopulations in different groups (lgG and hT2AB). The percentages of the seven cell subpopulations in different groups (lgG and hT2AB) are presented. Purple represents the hT2AB group, yellow represents the lgG group. E. The Ro/e score is used to assess the group preference of seven cell subpopulations and the results show that C2, C4, and C6 are mainly expressed in the hT2AB group (left). The box plot shows that the C2 subpopulation is mainly expressed in the hT2AB group (right). F. Volcano plots display the DEGs that are significantly up- and down-regulated in the seven cell subpopulations. G. Word cloud charts show enrichment of the 7 cell subpopulations. H. GSEA graphs show the upregulated pathways in the C2 subpopulation. I. Enrichment analysis graphs display the main functions in the seven cell subpopulations.
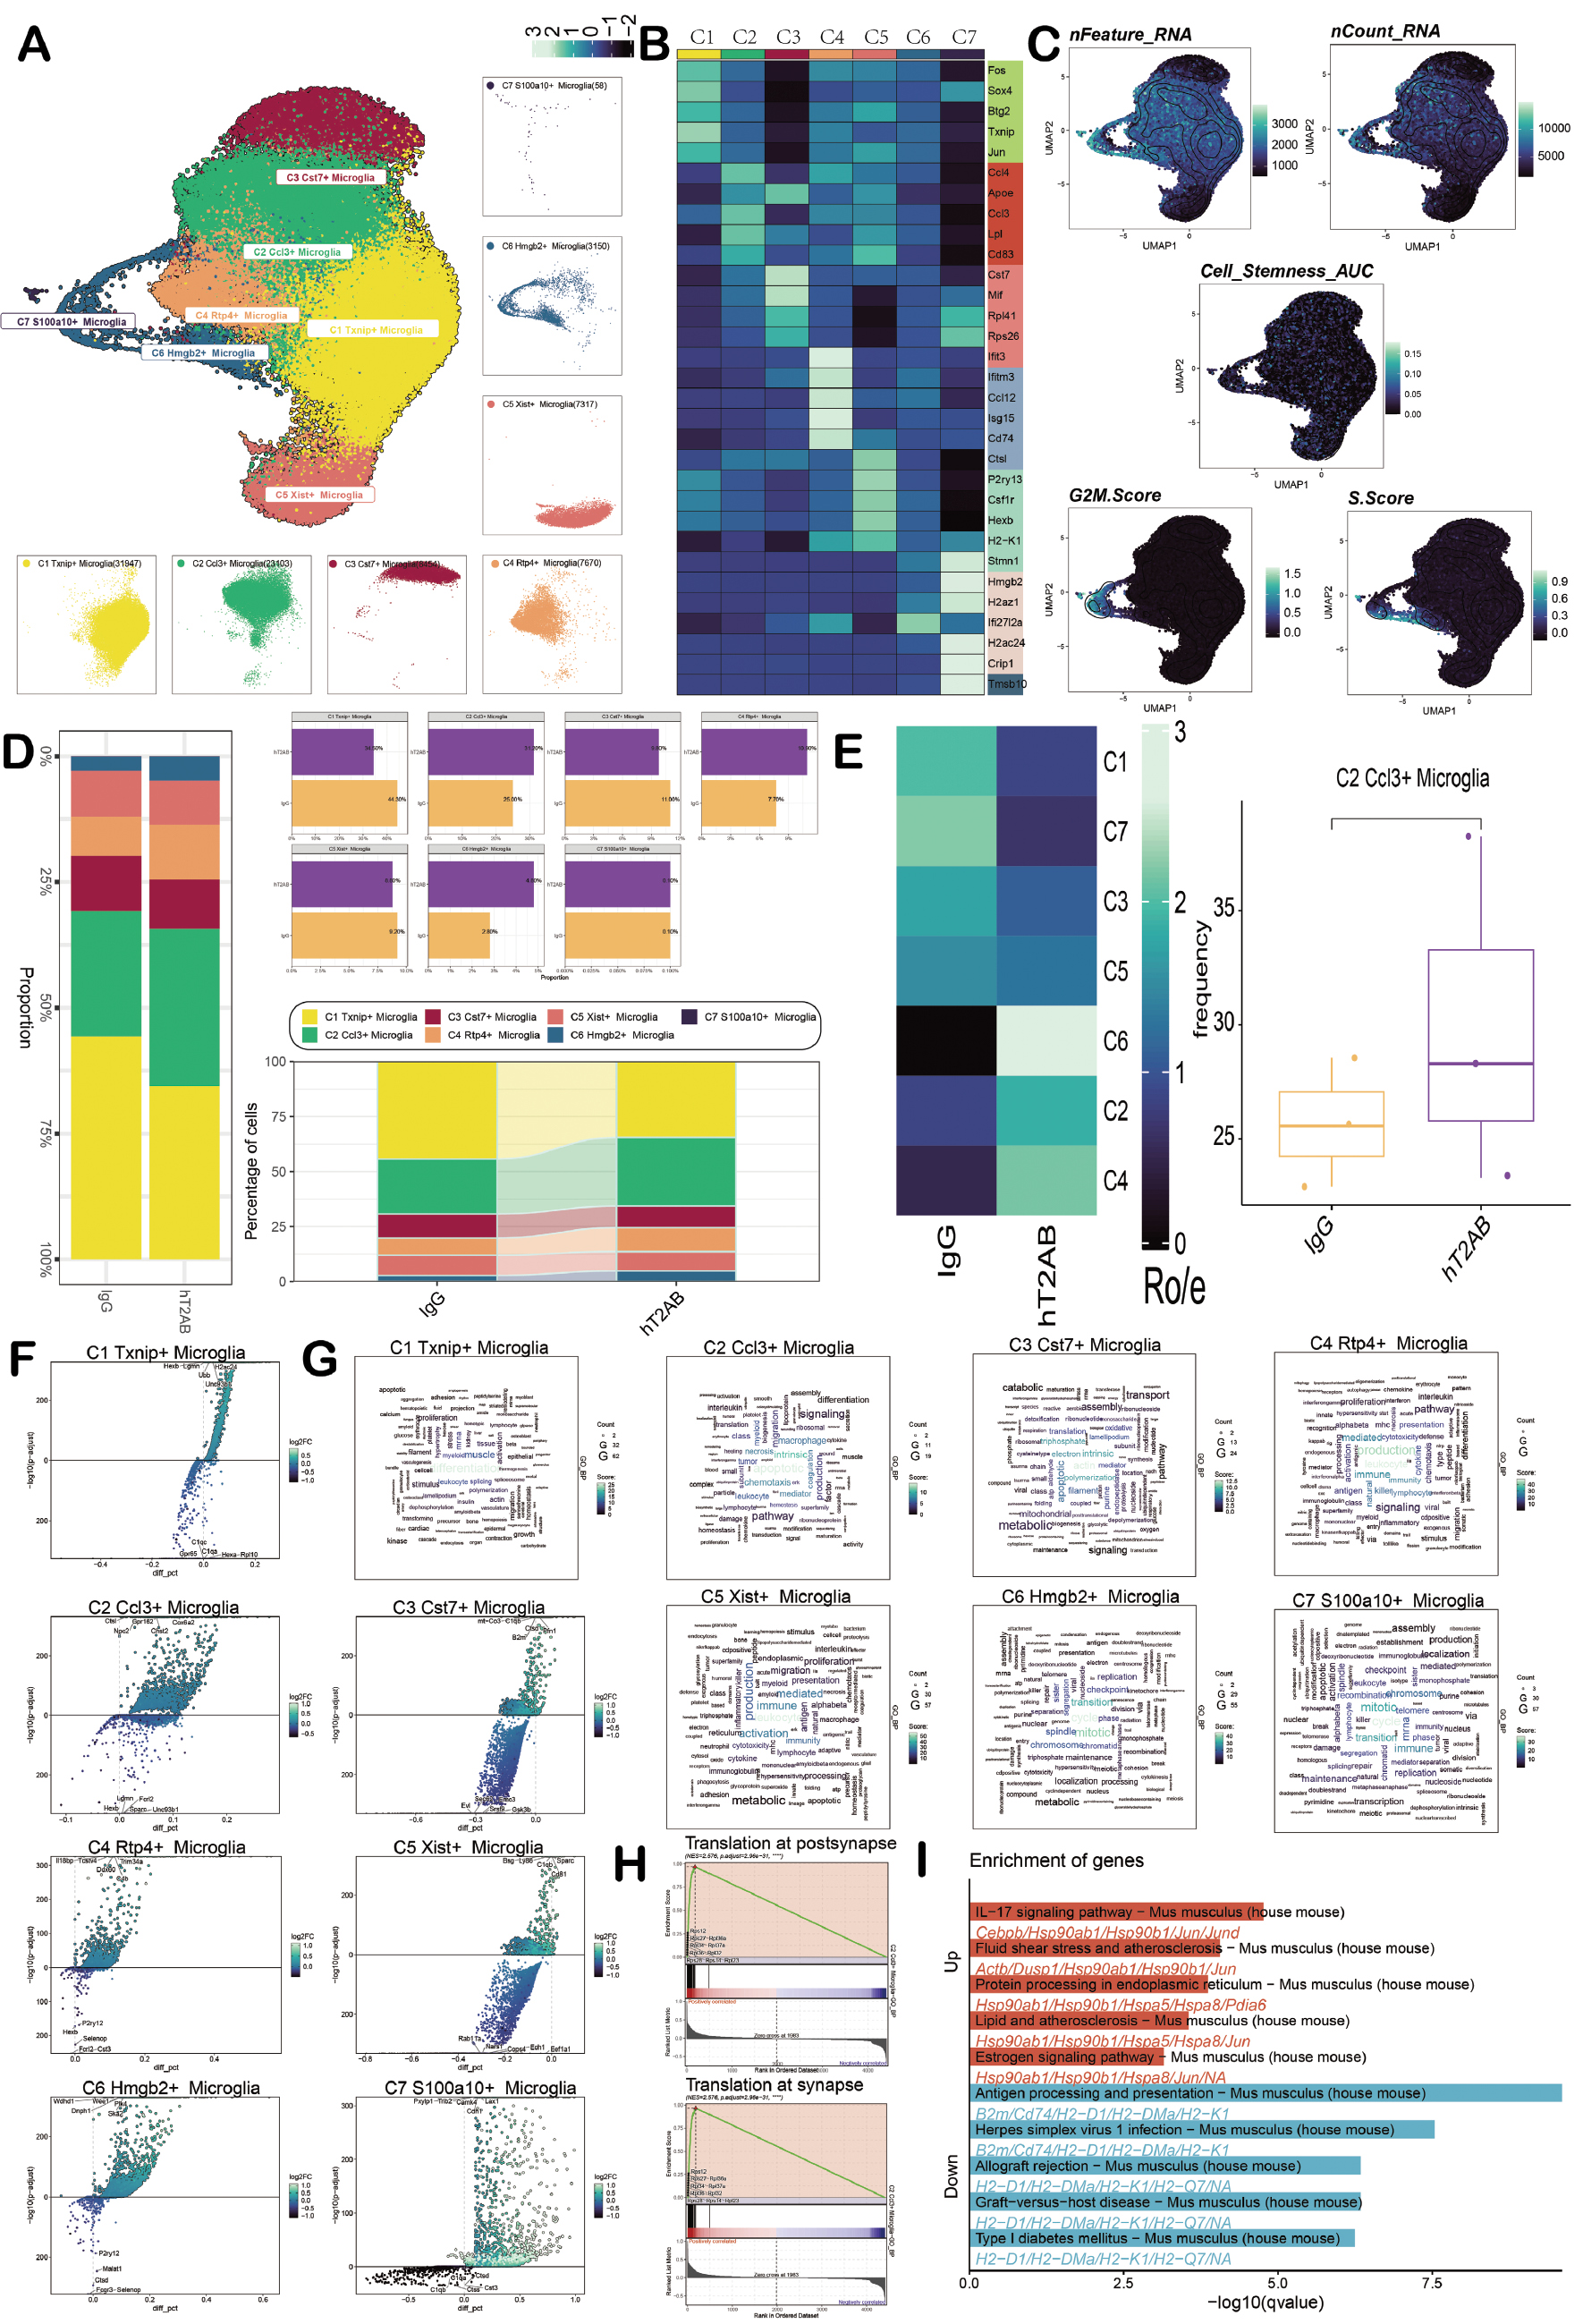
The heatmap and box plot showed that the C2, C4, and C6 subpopulations were highly expressed in the hT2AB group (Figure 3E). The DEGs of these subpopulations are first presented through volcano plots to understand the functional enrichment of the seven cell subpopulations (Figure 3F). The main pathways enriched by these cell subpopulations are displayed through the word clouds, where C1 was differentiation, C2 was apoptotic and chemotactic, C3 was actin and electron intrinsic, C4 was production and leukocytes, C5 was leukocytes and immune, C6 was cycle and mitosis, and C7 was cycle and mitosis (Figure 3G). The GSEA plots showed that the C2 subpopulation was mainly upregulated in pathways, such as translation at synapse and post-synapse (Figure 3H). The C2 subpopulation was mainly enriched in functions, such as the IL-17 signaling pathway-Mus musculus and protein processing in endoplasmic reticulum-Mus musculus (Figure 3I).
Pseudotime differentiation of microglia
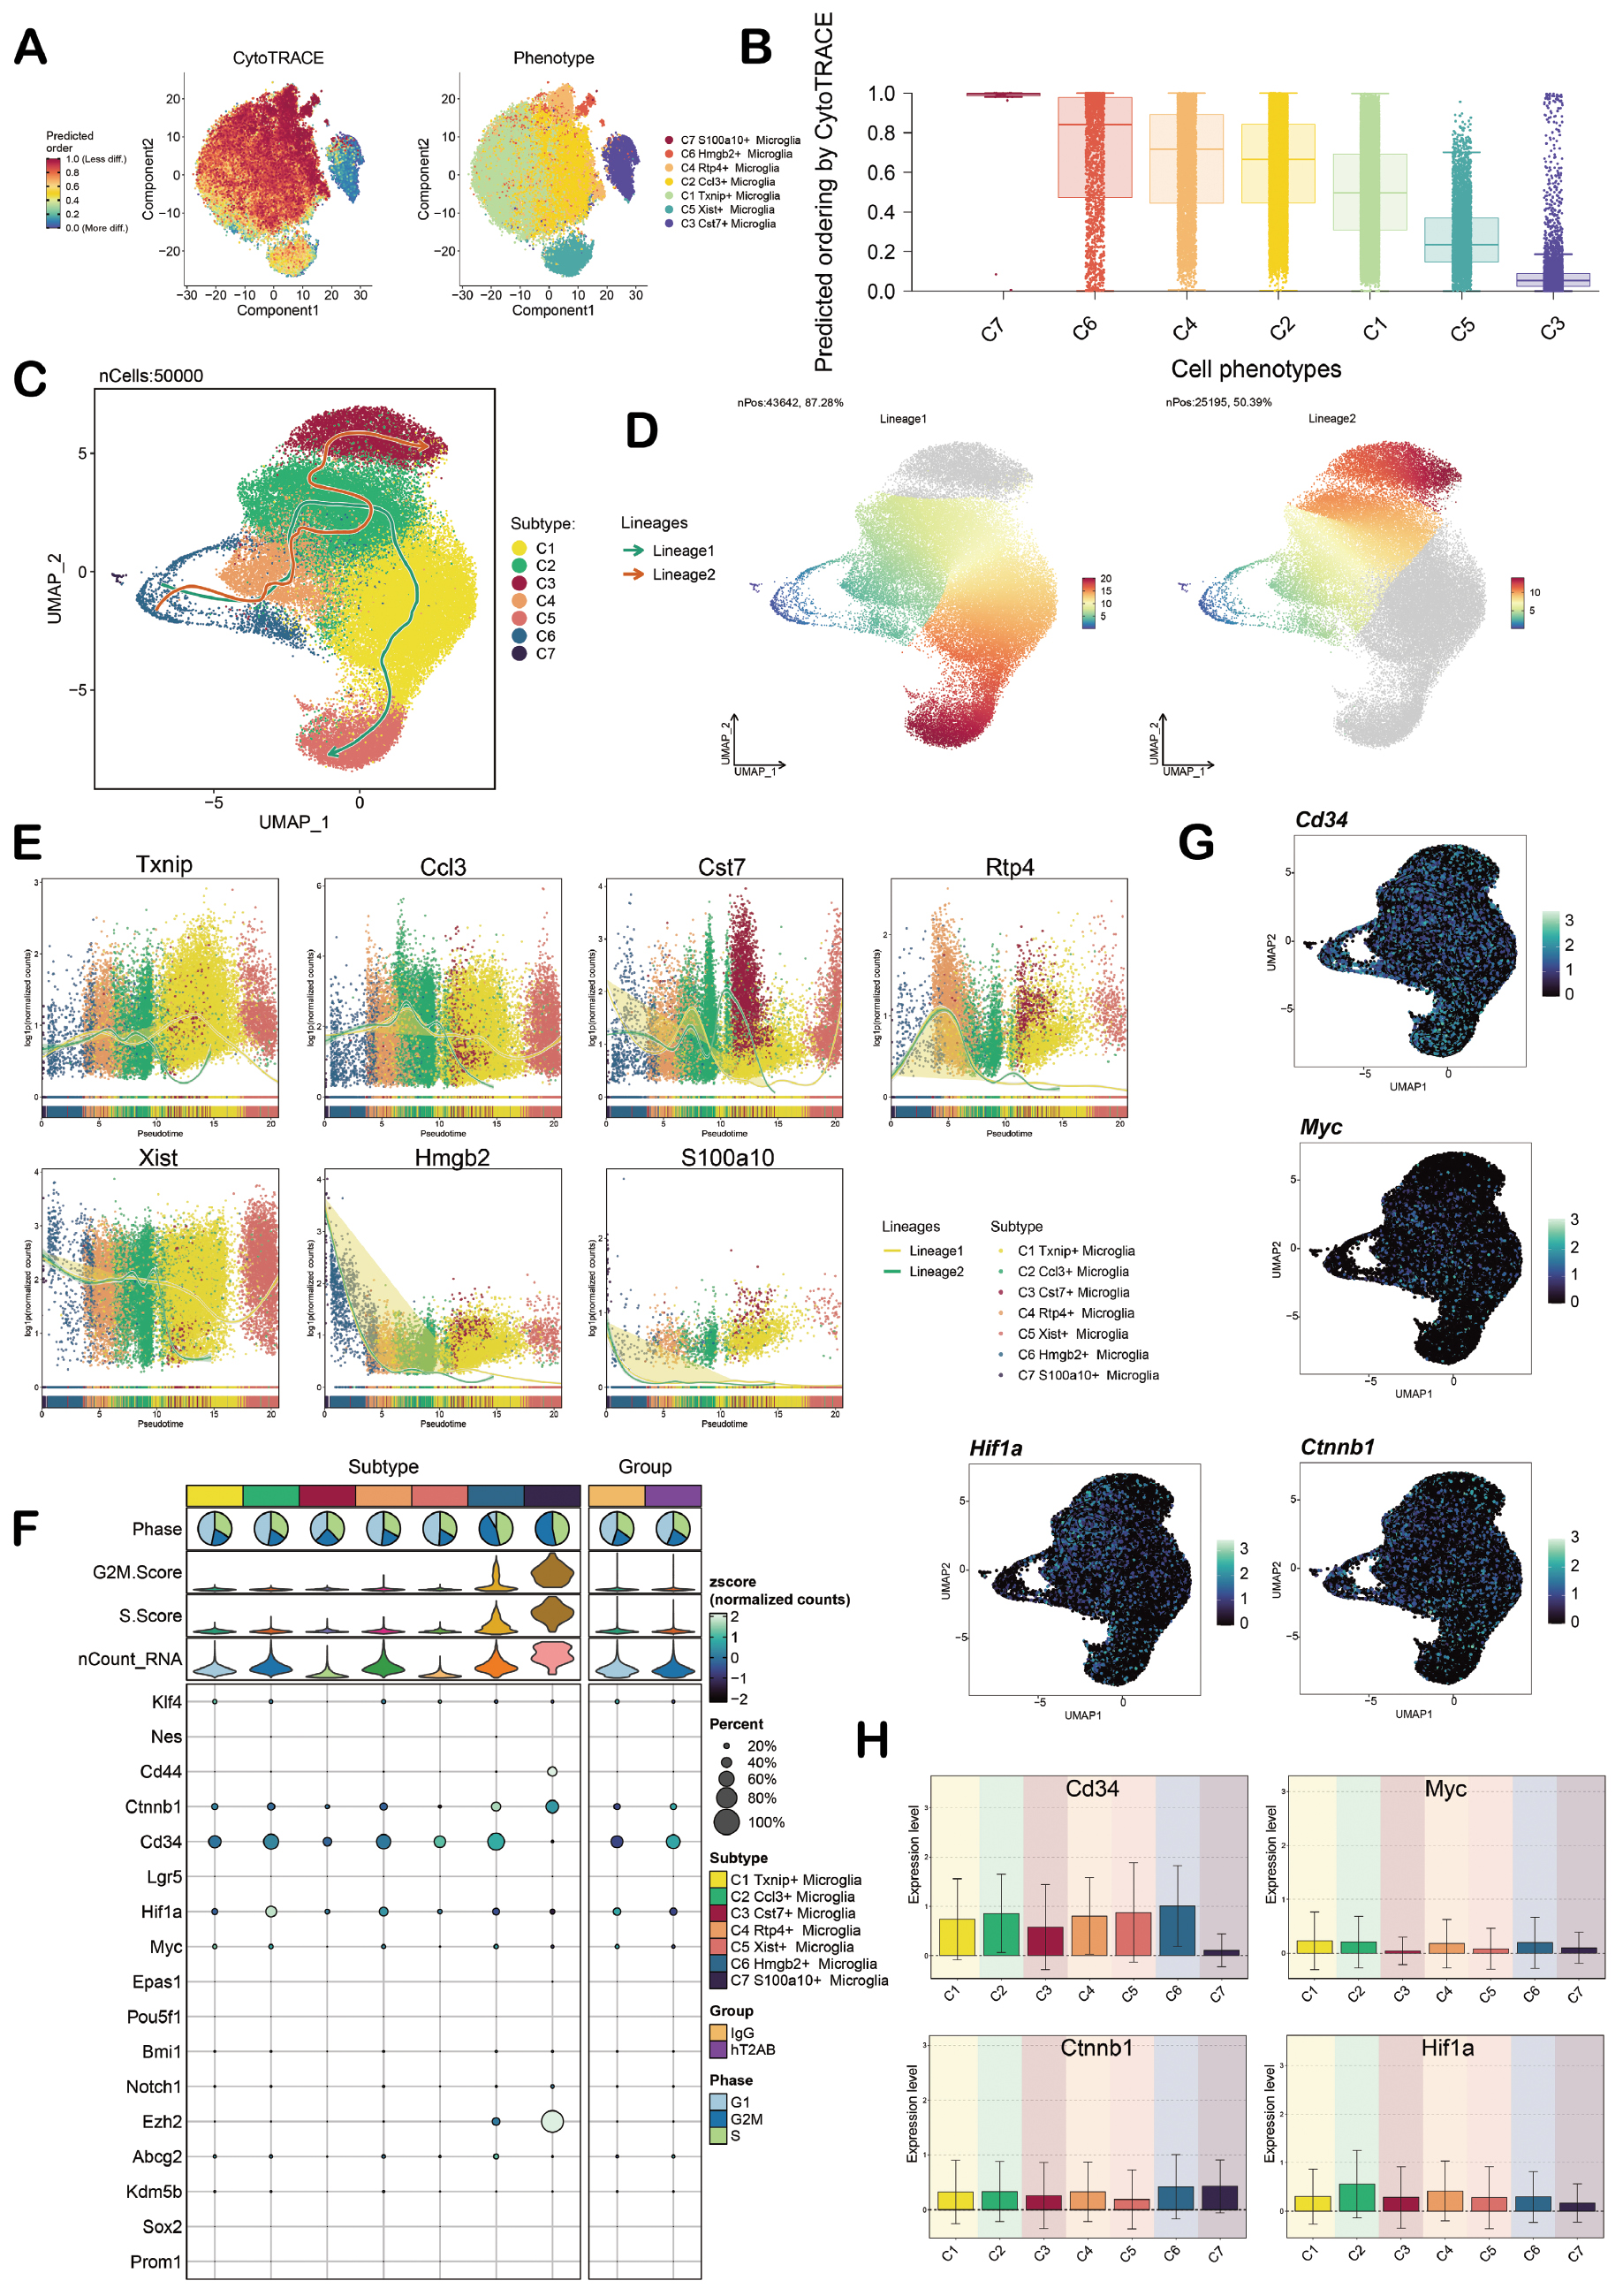
The differentiation of microglia during the progression of AD was analyzed. First, Cytotrace was used to predict the stemness of the seven cell subpopulations. The C6 subpopulation predicted extremely high dryness, while the C3 and C5 subpopulations had lower predicted dryness, and the C2 subpopulation was in the middle position (Figure 4A, B). Slingshot analysis was used to show the differentiation trajectories of the seven cell subpopulations. The seven cell subpopulations were divided into two trajectories (lineages 1 and 2). The sequence of lineage 1 was C6-C4-C2-C1-C5 and the sequence of lineage 2 was C6-C4-C2-C3 (Figure 4C). The results were also confirmed by the UAMP (Figure 4D). It is notable that two trajectories differentiated from the C2 subpopulation were identified towards different cell outcomes, highlighting the important role of the C2 subpopulation in the progression of AD. In addition, we the dynamic changes of the seven cell subpopulations in lineages 1 and 2 are shown in Figure 4E. Furthermore, the cell dryness changes were presented in bubble charts, such as the high expression of Cd34, Myc, Ctnnb1, and Hif1a in the C2 subpopulation (Figure 4F-H).
Figure 4 Pseudotime analysis of microglia. A. The left figure shows the sorted distribution of microglia subpopulations predicted by CytoTRACE with colors representing cell stemness and the right figure shows the distribution of microglia subpopulations with colors representing cell subtypes. B. The predicted stemness levels of microglia subpopulations were obtained in a descending order based on CytoTRACE analysis. C. The Slingshot plot shows the predicted temporal differentiation trajectory of microglia, including lineages 1 and 2. The C6 subpopulation was at the initial segment of the differentiation trajectory and the C2 subpopulation was at the transition segment of the two trajectories. The arrows indicated the differentiation direction. D. The UMAP plots shows the differentiation status of lineages 1 and 2. E. The scatter plots show the dynamic changes of the named genes for each subpopulation in the two temporal sequences. F. The bubble plot shows the stemness gene expression of seven cell subpopulations. G. The UMAP plots show the stemness gene distribution in the C2 subpopulation. H. The bar charts shows the stemness gene expression in the C2 subpopulation.
Functional identification and intercellular communication of microglia
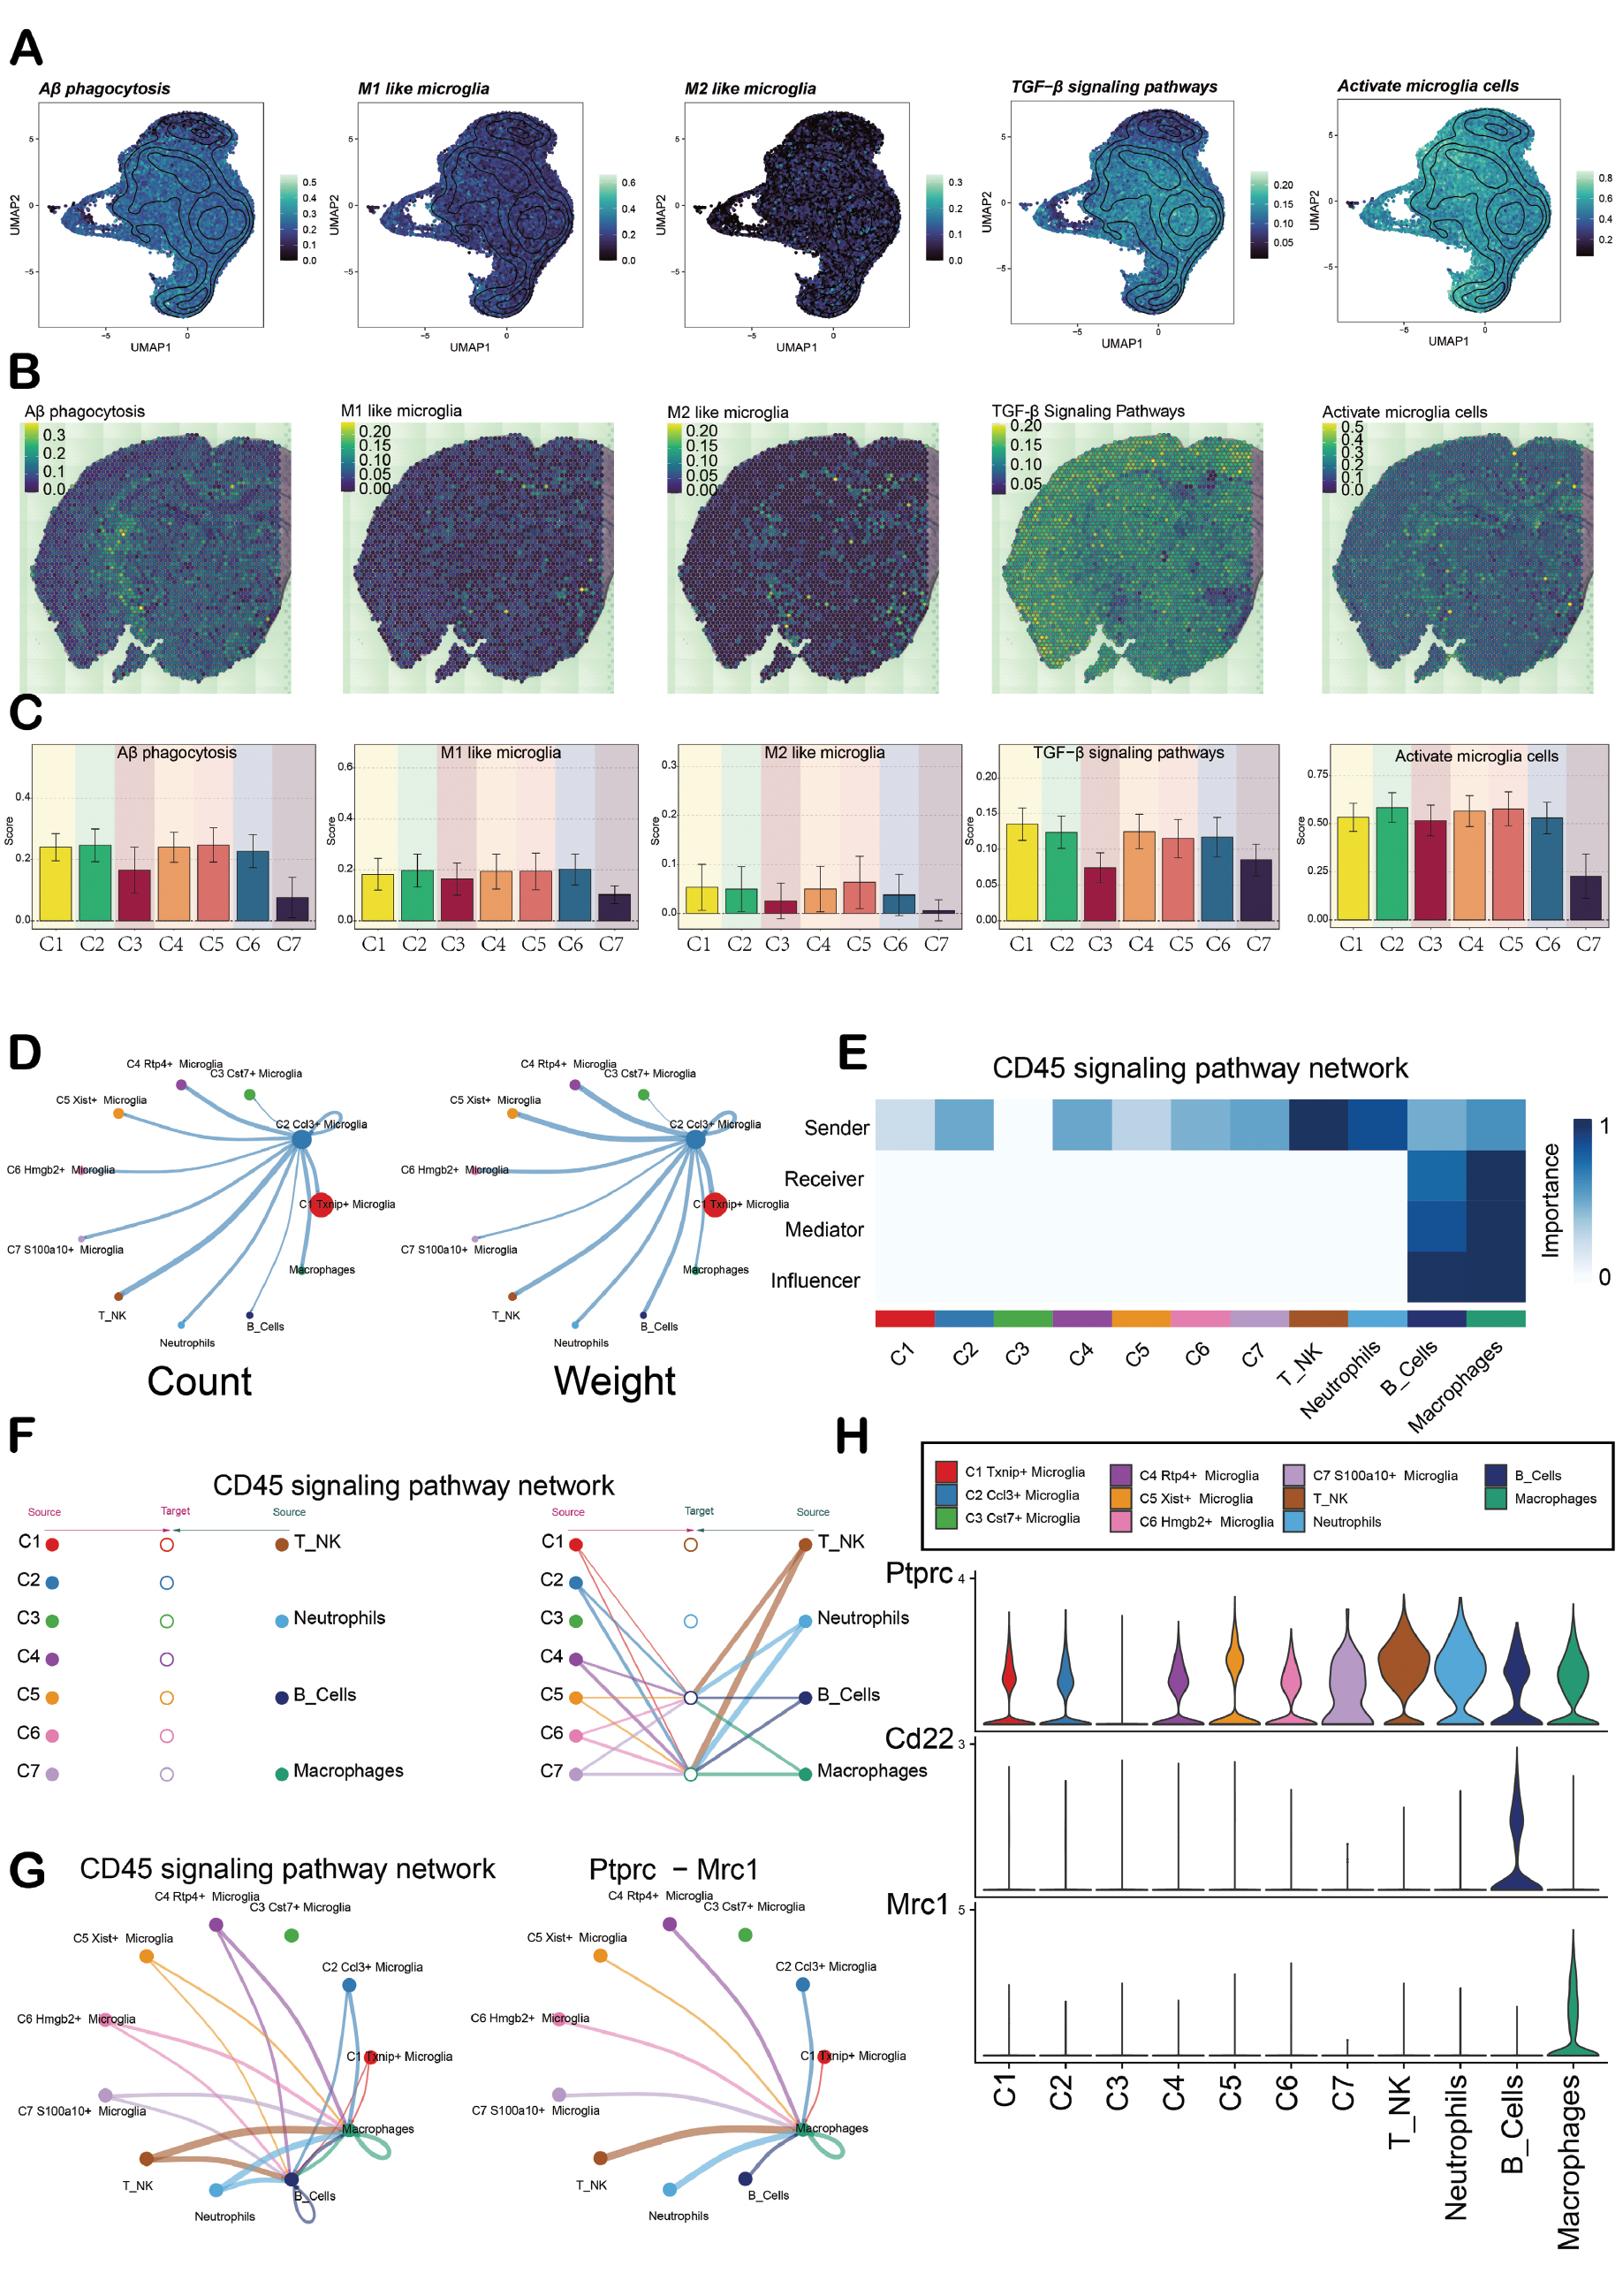
The performance of the seven cell subpopulations in Aβ phagocytosis, M1-like microglia, M2-like microglia, TGF-β signaling pathways, and activated microglia are presented through UMAP plots and bar charts to understand the functional changes of microglia subpopulations during AD progression. In addition, the spatial expression characteristics of the above pathways were shown through ST sections (Figure 5A-C). The cell subpopulations generally showed a gradually increasing trend in lineage 1. There was a decreasing trend in lineage 2 and the function of the C3 subpopulation was significantly reduced. Therefore, the ST situations of several subpopulations (C1, C2, and C5) in lineage 2 were presented. These subpopulations had a corresponding relationship with the spatial positions of the abovementioned key pathways (Supplementary Figure 2A-B). CellChat was used to analyze the communication between various cell types. T-NK and B cells received more signals than other cell types when the C2 subpopulation was the source (Figure 5D). The CD45 signaling pathway network showed that the C2 subpopulation had a higher expression of Sender in the sender, while macrophages had higher expressions in Receiver, Mediator, and Influencer (Figure 5E). The hierarchical diagram showed that microglia had the ability to have paracrine interactions with T-NK cells and macrophages (Figure 5F). The levels of ligand and receptor expression in the CD45 pathway are shown. The C2 subpopulation mainly interacted with macrophages through the Ptprc-Mrc1 ligand-receptor (L-R) pair (Figure 5G, H). Moreover, MISTyR identified key cell interactions and spatial organization signal hubs in AD. MISTyR presented the interaction network between cells from different perspectives, as well as the relationships among various cell types in AD. There were interactions between the C3 subpopulation and most cell type subpopulations (Supplementary Figure 2C, D).
Figure 5 Phenotype determination and cell communication of microglia. A-C. UMAP plots, ST plots, and bar graphs show the distribution of seven cell subpopulations in Aβ phagocytosis, M1-like microglia, M2-like microglia, TGF-β signaling pathways, and Activated microglia cells. D. Circle plots show the count and weight of interactions between the C2 subpopulation as the source and other cells. E. Heatmap shows the centrality score of the CD45 signaling pathway network. F. Hierarchy chart shows the cell interactions among various cell types in the CD45 signaling pathway network. G. Circle plots show the communication network between the CD45 signaling pathway and Ptprc – Mrc1 with C2 subpopulation as the receiver. H. Violin plots show the interactions among various cell types in the CD45 signaling pathway network.
Microglial TFs
TFs, as a class of key regulatory proteins, can specifically recognize and bind to the specific nucleotide sequences upstream of target genes, directly interact with the genome, and thereby regulate gene transcription. This process profoundly affects a series of cell biological functions. A connectivity specificity index matrix was constructed based on the AUCell score and divided microglia into three regulatory modules, including M1, M2, and M3 (Figure 6A). Dimensionality reduction clustering was then performed on microglia to display the cell subpopulations and group conditions (Figure 6B). The TFs in the M1, M2, and M3 modules mainly regulated the C7, C1, and C4 subpopulations, respectively (Figure 6C-E).
Figure 6 Analysis of TFs in microglia. A. The heatmap shows three regulatory modules identified in the microglia cell subpopulations (M1, M2, and M3) based on the SCENIC regulatory rule modules and AUCell similarity scores. B. The UAMP map shows the coloring and visualization of microglia based on the activity scores of the regulatory modules for different subpopulations and groups. C. The scatter diagrams show the ranking of TF regulatory activity scores in M1, M2, and M3. D. The UMAP maps show the distribution of M1, M2, and M3 expression. E. The bar plots show the AUC scores of microglia subpopulations in M1, M2, and M3. F. The heatmap shows the top five TFs in the microglia subpopulations. G. The scatter diagrams show the ranking of the top five TF activity scores in the microglia subpopulations. UMAP plots shows the distribution of the top five TFs in the C2 subpopulation, including lkzf3, Hif1a, Eomes, Cebpa, and Relb. H. The bar plots show the AUC values of the top five TFs in the C2 subpopulation in different tumor cell subpopulations. I. The heatmap shows the top five TFs in different groups. J. The UMAP maps show the distribution of the top five TFs in the hT2AB group.
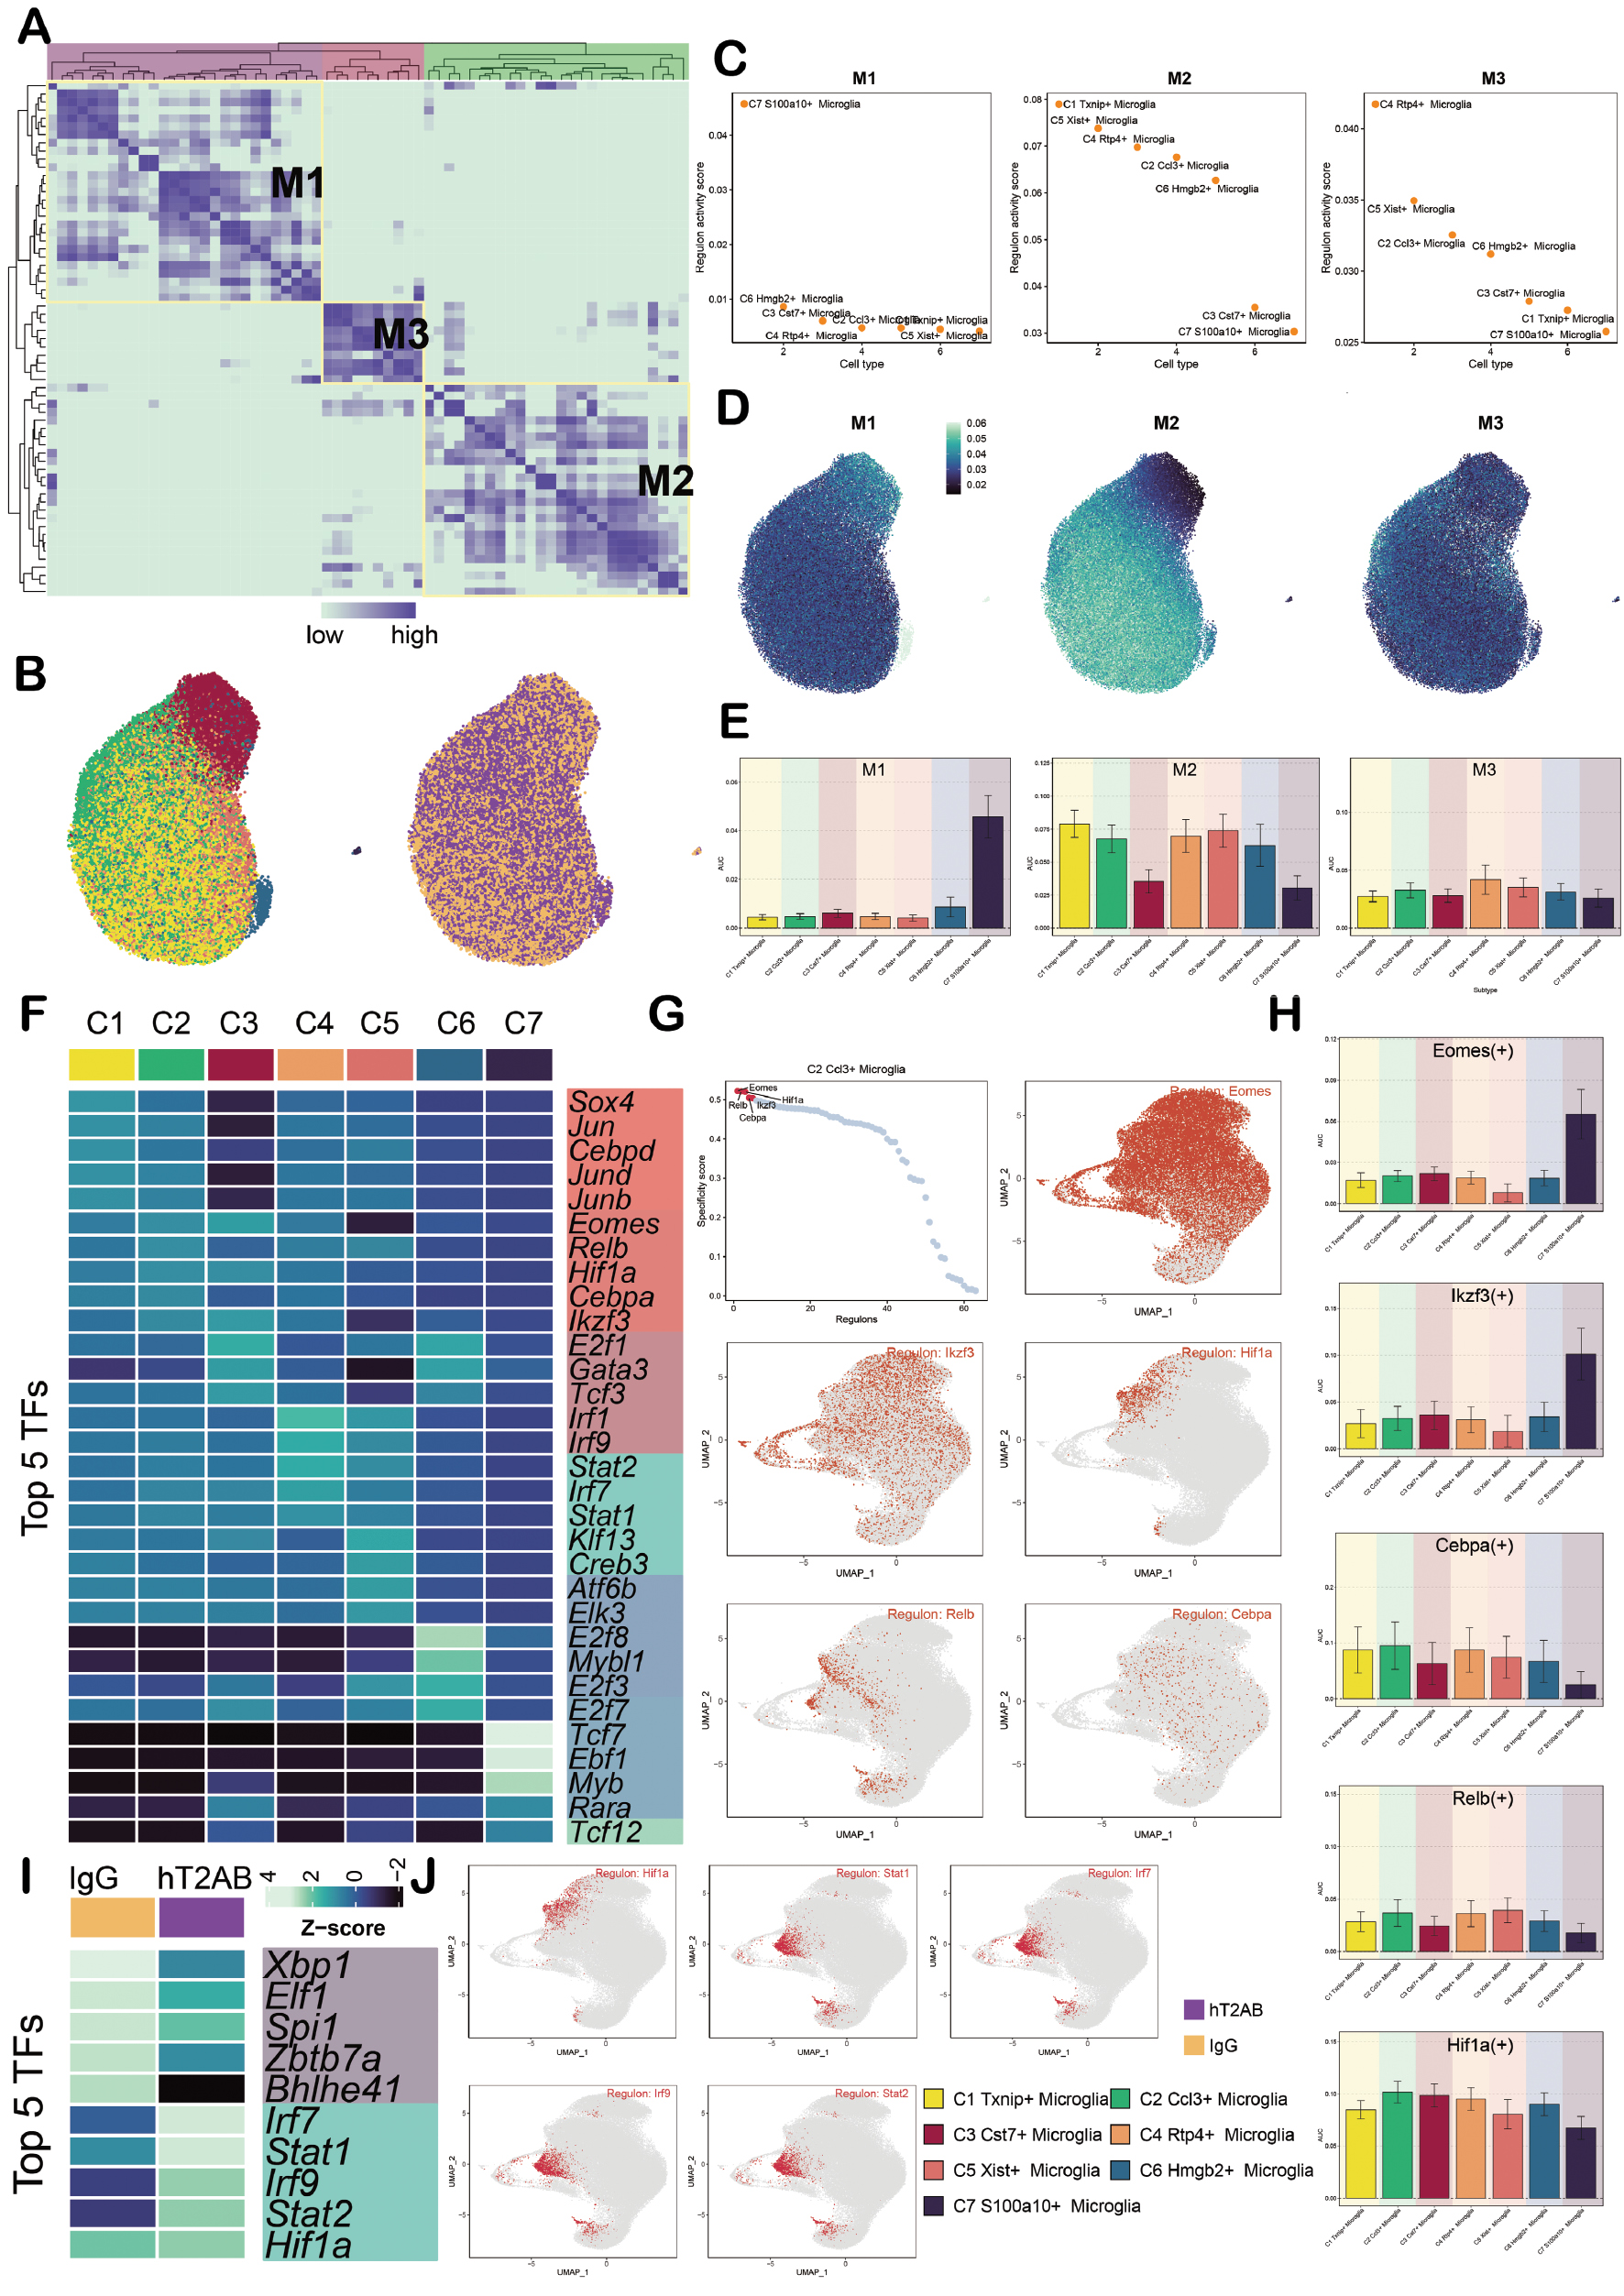
The top five TFs in each cell subpopulation were analyzed and the top five TFs ranked by the seven cell subpopulations in a heatmap are presented. The top five TFs of the C1 subpopulation were Sox4, Jun, Cebpd, Jund, and Junb. The top five TFs of the C2 subpopulation were Eomes, Relb, Hif1a, Cebpa, and lkzf3. The top 5 TFs of the C3 subpopulation were E2f1, Gata3, Tcf3, Eomes, and Ikzf3. The top five TFs of the C4 subpopulation were Irf1, Irf9, Stat2, Irf7, and Stat1. The top five TFs of the C5 subpopulation were KIf13, Irf1, Creb3, Atf6b, and Elk3. The top five TFs of the C6 subpopulation were E2f8, Myb11, E2f3, E2f7, and E2f1. The top five TFs of the C7 subpopulation were Tcf7, Ebf1, Myb, Rara, and Tcf12 (Figure 6F). The C2 subpopulation was noted to highly expresses Eomes, Relb, Hif1a, Cebpa, and lkzf3 based on the specificity score. These TFs were also demonstrated through UMAP plots, scatter plots, and bar charts (Figure 6G, H). In addition, the key TFs in different group types were expressed, as shown in Figure 6I. The top five TFs in the IgG group were Xbp 1, EIf1, Spi1, Zbtb7a, and Bhlhe41. The top five TFs in the hT2AB group were Irf7, Stat1, Irf9, Stat2, and Hif1a (Figure 6I, J). Among the TFs, Hif1a was highly expressed in the C2 subpopulation and in the hT2AB group.
Discussion
AD is the most prevalent type of dementia worldwide and the social burden is increasing day-by-day. Currently, the drugs used for treating AD temporarily alleviate superficial symptoms, such as memory decline and lack of concentration, but do not fundamentally improve the long-term prognosis. Therefore, finding new treatment methods for AD has become an urgent task in the medical field. Studies have shown that TREM2 is crucial for the differentiation of DAM and anti-TREM2 activation antibodies have been proven to regulate the Aβ load, promote microglial proliferation, and weaken the neurotoxicity of Aβ plaques after long-term administration. Studies have also shown that the anti-TREM2 activation antibody (hT2AB) activates the microglia of TREM2 variant mice and achieves the purpose of treating AD [17].
The 5XFAD mutant mouse model of TREM2 was analyzed to understand the expression of microglia in TREM2 variant mice after hT2AB treatment and the impact on the progression of AD. It is worth noting that a high-resolution single-cell map of AD was first established through scRNA-seq. The results showed that AD contains five cell types, among which microglia account for a prominent proportion. This result indicates the important role of microglia in AD. Seven cell subpopulations were obtained through dimensionality reduction clustering of microglia. Among the seven cell subpopulations, the C2 subpopulation accounted for a high proportion in the hT2AB group that might have been significantly influenced by hT2AB. C2 Ccl3+ microglia mainly expressed Apoe, Ccl4, Ccl3, Lpl, and Cd83 based on the marker genes highly expressed in the seven cell subpopulations. These genes were all activation genes of microglia [26–30]. Most of these genes simultaneously expressed DAM markers [31]. Therefore, we speculated that the C2 subpopulation may be a mixed transition activation state. This finding was related to the results of hT2AB as an alternative ligand binding TREM2 to activate microglia in 5XFAD transgenic mice [17]. The enrichment analysis of the C2 subpopulation showed that the C2 subpopulation was significantly enriched in the IL-17 signaling pathway-Mus musculus and protein processing in endoplasmic reticulum-Mus musculus. The C2 subpopulation was also upregulated in the pathways of synaptic translation, presynaptic translation, and postsynaptic translation. These pathway abnormalities may achieve the purpose of regulating AD by affecting the protein synthesis, immune response, and synaptic interaction ability of microglia. C6 and C7 were shown to have the highest prediction, while the prediction of the C3 and C5 subpopulations was the lowest, and the C2 subpopulation was in the middle position based on an analysis of the microglia cell subpopulations using CytoTRACE, Monocle, and Slingshot techniques. Slingshot revealed that AD had two differentiation trajectories. The differentiation sequence was C7-C6-C4-C2-C1-C5 in lineage 1 and C7-C6-C4-C2-C3 in lineage 2. The C7 and C6 subpopulations, as high proliferative microglial cell subpopulations, were gradually developing into other cell types. The C2 subpopulation was one of the trajectory differentiation transition subpopulations. Aβ phagocytosis, M1-like microglia, M2-like microglia, TGF-β signaling pathway, and activated microglial cells were scored to further understand the functional changes of each subpopulation in the two trajectories. Lineage 1 showed an increasing trend in these pathways, which might have a role in treating AD, while lineage 2 exhibited the opposite trend. The C2 subpopulation differentiated towards different cell fates, which might be the therapeutic effect of the anti-TREM2 activating antibody (hT2AB). Studies have shown that hT2AB can enhance the clearance of Aβ plaques by microglial cells after short-term treatment [32]. Furthermore, the analysis of ST sections from AD mice revealed that the above pathways were highly consistent with the spatial distribution of the C2, C1, and C5 subpopulations. This finding further indicates that these subpopulations may have a positive role in AD.
We hypothesized that the C2 subpopulation may be closely related to the transformation of microglia into a therapeutic phenotype; therefore, a detailed analysis was performed. The C2 subpopulation was shown to interact with macrophages through the CD45 signaling pathway and the key receptor pair was Ptprc-Mrc1. This finding revealed the complex interactions among cells in the disease microenvironment. Studies have shown that the lack of CD45 activity leads to weakened Aβ phagocytosis and accumulation of Aβ oligomers, thereby exacerbating the progression of AD [33, 34]. Because microglial cells are another type of macrophage, this autocrine signal exchange may have an important role in AD progression. MISTy analysis showed that the C3 subpopulation may have potential interactions with multiple cell types, which may be closely related to the pathologic microenvironment characteristics of AD mice. TFs have a crucial role in regulating genes within cells, influencing the transcription of specific genes and thereby affecting various important biological processes. The analysis of TFs revealed that the top five key TFs in the C2 subpopulation were Eomes, Relb, Hif1a, Cebpa, and Lkzf3. While in the hT2AB group, the top key TFs were Irf7, Stat1, Irf9, Stat2, and Hif1a. Among the key TFs, Hif1a was highly expressed in the C2 subpopulation and the hT2AB group, showing significant specificity. Hif1a (HIF-1α) is the full name of hypoxia-inducible factor 1α, a key TF for survival and adaptation in low-oxygen environments. Studies have shown that an increase in HIF-1α levels can resist the toxic effects of Aβ and reduce the phosphorylation of tau protein to promote microglial activation [35]. Furthermore, HIF-1α can also effectively alleviate nerve damage during hypoxia and delay the occurrence of AD. HIF-1α can mediate the neuroprotective effect of lactic acid by inhibiting the CCL7/NF-κB signaling pathway and thereby regulating the inflammatory response of microglia [36]. In addition, Eomes, also known as eomesodermin, is highly expressed in Eomes+ cells, which may affect the progression of neurodegenerative diseases [37]. Moreover, Eomes can coordinate with the TGF-β signal and studies have shown that Eomes can affect homeostasis of CD8+ T cells to regulate inflammatory responses. Cebpa is also called CCAAT enhancer binding protein alpha and is of great significance for the progression of AD. Studies have shown that Cebpa participates in regulating the polarization of microglia towards an anti-inflammatory state and is a positive regulator of DAM genes [38, 39]. Furthermore, Cebpa is also one of the main TFs mediated by TGF-β [40]. Lkzf3 also has an anti-inflammatory role [41]. Relb has a pro-inflammatory effect and is more easily induced by TNF-α. We speculate that this finding may be related to the activation of microglia [42].
This study had several limitations. First, the sample size was relatively limited and the research data are only from the single-cell sequencing data set registered as GSE156183 in GEO and the publicly available ST data from the 10× Genomics platform. This limitation may reduce the robustness of the statistical analysis results and affect the extrapolation and generalizability. Moreover, there are differences in sequencing batches and processing procedures among different samples. Although batch processing has been carried out using the Harmony package, this limitation may still have an impact on the results. Second, due to the research conditions, we were unable to conduct in vitro cell experiments and in vivo functional verification experiments. Therefore, the related mechanism derivation was completely based on the results of scRNA-seq and ST analysis, which lacked experimental evidence support. As a result, the core markers identified in this study could not be further verified and clarified through experiments and the clinical applicability still requires subsequent research to confirm. Third, it should be noted that there are differences between murine and human AD. Therefore, we speculate that the C2 subpopulation may be an activated microglia cell subpopulation. In the future, the cell fate of lineage 1 in treating AD needs to be verified using clinical samples from human AD patients to promote the clinical application of hT2AB. hT2AB has unique advantages in targeting and regulating the functions of microglia. Precise targeting of microglia can reduce the impact of traditional therapeutic drugs on the nervous system, thereby achieving the goal of reducing damage to normal cells and alleviating the progression of the disease. Moreover, the action targets of the key subpopulations also have the potential to develop into clinical biomarkers, which will contribute to advances in AD treatment. Despite the abovementioned limitations, this study, for the first time, revealed the crucial role of the hT2AB group in promoting the transformation of microglia to a treatment-related phenotype. This finding provides important theoretical references and research directions for subsequent exploration of molecular targets for regulating microglia and the development of targeted intervention strategies and has the potential for further in-depth research. Looking ahead, we will further conduct multi-center, large-sample clinical cohort studies to systematically explore the specific biomarkers of the key subpopulations and combine functional experiments to verify the mechanisms in the occurrence and development of AD. Our aim was to provide a more solid theoretical basis and experimental support for the development of targeted treatment strategies for AD.
Conclusion
AD is the most common type of dementia worldwide and the social burden is increasing. The development of new treatments is urgently needed. Studies have shown that anti-TREM2 activating antibodies, such as hT2AB, can regulate Aβ load, promote microglial cell proliferation, and activate microglial cells in TREM2 variant mice to treat AD. This study showed that AD contains five types of cells, with microglia accounting for a high proportion and divided into seven subpopulations. The Slingshot analysis revealed that microglia began to differentiate from the C2 subpopulation and developed in directions that were beneficial for AD treatment or exacerbated AD. The C2 subpopulation represented a crucial turning point and holds significant research value. The results indicated that the C2 subpopulation highly expressed genes related to microglial cell activation, enriched key pathways, and could interact with macrophages through the CD45 signaling pathway. The core transcription factors, such as HIF-1α, were also closely related to AD progression.
Data availability statement
The single-cell data is from the GEO database, and the ST data is from the 10× Genomics website. The flowchart was created using Figfraw, ID: OISAR334a1.
Ethics statement
All the data are sourced from public databases and do not require ethical review.
Author contributions
Lei Sun: Conceptualization, Data curation, Formal analysis, Methodology, Visualization, Writing – original draft, Writing – review & editing. Jingheng Lin: Conceptualization, data curation, writing—original draft. Chengcheng Song: Data curation, writing—original draft. Xuan Li, Zike Dong, and Yining Wang: Validation, Visualization, Writing—review & editing. Zhiheng Lin: Project administration, resources, supervision, validation, writing – review & editing.
Funding
No funding or sponsorship was received for this study.
Conflict of interest
The authors declare that there are no conflicts of interest.
Supplementary material
Supplementary Material can be downloaded from https://bio-integration.org/wp-content/uploads/2026/03/bioi20250179_Supplemental.zip.
Graphical abstract
Highlights
- Alzheimer’s disease (AD) is the most common type of Alzheimer’s disease, with insidious onset, progressive cognitive dysfunction and heavy burden.
- In this study, scRNA-seq and ST were used to explore the regulatory effect of hT2AB on AD microglia.
- There are seven subpopulations of microglia, mainly C2. Microglia differentiate along two lineages, in which C2 transitions to a protective phenotype.
- These findings support the development of biomarkers for AD and the development of TREM2-targeted therapeutic strategies.
In brief
This study combined single-cell and spatial transcriptomic techniques to analyze the molecular mechanism by which hT2AB regulates AD microglial cells, discovering that it prompts microglial cells to differentiate into a protective phenotype. It identified C2 as the key effector subgroup and the core marker, providing a new cellular and molecular basis for targeted treatment of AD.
References
- Zheng P, Huang X, Pang X, Sun Y, Zeng Z, et al. BCL2 interacting protein 3 as a potential biomarker for Alzheimer’s disease: an observational study. NeuroMarkers 2024;1(1):100005. [DOI: 10.1016/j.neumar.2024.100005]
- Jin K, Lv Z, Pang X, Zhu C, Liu R, et al. Biomarkers in Alzheimer’s disease progression: a longitudinal cohort study of NPTX2, GRIA1, and GRIA4. Aging Adv 2024;1(1):52-9. [DOI: 10.4103/AGINGADVANCES.AGINGADV-D-24-00004]
- Hao M, Chen J. Trend analysis and future predictions of global burden of Alzheimer’s disease and other dementias: a study based on the global burden of disease database from 1990 to 2021. BMC Med 2025;23(1):378. [PMID: 40597083 DOI: 10.1186/s12916-025-04169-w]
- Li X, Feng X, Sun X, Hou N, Han F, et al. Global, regional, and national burden of Alzheimer’s disease and other dementias, 1990-2019. Front Aging Neurosci 2022;14:937486. [PMID: 36299608 DOI: 10.3389/fnagi.2022.937486]
- Guo J, Wang P, Gong J, Sun W, Han X, et al. The disease burden, risk factors and future predictions of Alzheimer’s disease and other types of dementia in Asia from 1990 to 2021. J Prev Alzheimers Dis 2025;12(5):100122. [PMID: 40057462 DOI: 10.1016/j.tjpad.2025.100122]
- Passeri E, Elkhoury K, Morsink M, Broersen K, Linder M, et al. Alzheimer’s disease: treatment strategies and their limitations. Int J Mol Sci 2022;23(22):13954. [PMID: 36430432 DOI: 10.3390/ijms232213954]
- Zhang F, Qin Y, Xie L, Zheng C, Huang X, et al. High-frequency repetitive transcranial magnetic stimulation combined with cognitive training improves cognitive function and cortical metabolic ratios in Alzheimer’s disease. J Neural Transm (Vienna) 2019;126(8):1081-94. [PMID: 31292734 DOI: 10.1007/s00702-019-02022-y]
- Rostagno AA. Pathogenesis of Alzheimer’s disease. Int J Mol Sci 2022;24(1):107. [PMID: 36613544 DOI: 10.3390/ijms24010107]
- van Dyck CH, Swanson CJ, Aisen P, Bateman RJ, Chen C, et al. Lecanemab in early Alzheimer’s disease. N Engl J Med 2023;388(1):9-21. [PMID: 36449413 DOI: 10.1056/NEJMoa2212948]
- Mummery CJ, Börjesson-Hanson A, Blackburn DJ, Vijverberg EGB, De Deyn PP, et al. Author correction: tau-targeting antisense oligonucleotide MAPTrx in mild Alzheimer’s disease: a phase 1b, randomized, placebo-controlled trial. Nat Med 2024;30(1):304. [PMID: 37845513 DOI: 10.1038/s41591-023-02639-3]
- Hou Y, Wei Y, Lautrup S, Yang B, Wang Y, et al. NAD+ supplementation reduces neuroinflammation and cell senescence in a transgenic mouse model of alzheimer’s disease via cGAS-STING. Proc Natl Acad Sci U S A 2021;118(37):e2011226118. [PMID: 34497121 DOI: 10.1073/pnas.2011226118]
- Condello C, Yuan P, Schain A, Grutzendler J. Microglia constitute a barrier that prevents neurotoxic protofibrillar Aβ42 hotspots around plaques. Nat Commun 2015;6:6176. [PMID: 25630253 DOI: 10.1038/ncomms7176]
- Ulland TK, Song WM, Huang SC, Ulrich JD, Sergushichev A, et al. TREM2 maintains microglial metabolic fitness in Alzheimer’s disease. Cell 2017;170(4):649-63.e13. [PMID: 28802038 DOI: 10.1016/j.cell.2017.07.023]
- Ulland TK, Colonna M. TREM2 – a key player in microglial biology and Alzheimer disease. Nat Rev Neurol 2018;14(11):667-75. [PMID: 30266932 DOI: 10.1038/s41582-018-0072-1]
- Keren-Shaul H, Spinrad A, Weiner A, Matcovitch-Natan O, Dvir-Szternfeld R, et al. A unique microglia type associated with restricting development of Alzheimer’s disease. Cell 2017;169(7):1276-90. [PMID: 28602351 DOI: 10.1016/j.cell.2017.05.018]
- Ellwanger DC, Wang S, Brioschi S, Shao Z, Green L, et al. Prior activation state shapes the microglia response to antihuman TREM2 in a mouse model of Alzheimer’s disease. Proc Natl Acad Sci U S A 2021;118(3):e2017742118. [PMID: 33446504 DOI: 10.1073/pnas.2017742118]
- Xia Y, Wang Y, Shan M, Hao Y, Liang Z. Decoding the molecular landscape of keloids: new insights from single-cell transcriptomics. Burns Trauma 2023;11:tkad017. [PMID: 37293384 DOI: 10.1093/burnst/tkad017]
- Shi J, Liu J, Tu X, Li B, Tong Z, et al. Single-cell immune signature for detecting early-stage HCC and early assessing anti-PD-1 immunotherapy efficacy. J Immunother Cancer 2022;10(1):e003133. [PMID: 35101942 DOI: 10.1136/jitc-2021-003133]
- Du H, Li S, Lu J, Tang L, Jiang X, et al. Single-cell RNA-seq and bulk-seq identify RAB17 as a potential regulator of angiogenesis by human dermal microvascular endothelial cells in diabetic foot ulcers. Burns Trauma 2023;11:tkad020. [PMID: 37605780 DOI: 10.1093/burnst/tkad020]
- Yang L, He YT, Dong S, Wei XW, Chen ZH, et al. Single-cell transcriptome analysis revealed a suppressive tumor immune microenvironment in EGFR mutant lung adenocarcinoma. J Immunother Cancer 2022;10(2):e003534. [PMID: 35140113 DOI: 10.1136/jitc-2021-003534]
- Wang J, Xu J, Zang G, Zhang T, Wu Q, et al. Trans-2-enoyl-CoA reductase tecr-driven lipid metabolism in endothelial cells protects against transcytosis to maintain blood-brain barrier homeostasis. Research (Wash D C) 2022;2022:9839368. [PMID: 35465346 DOI: 10.34133/2022/9839368]
- Yu A, Fu J, Yin Z, Yan H, Xiao X, et al. Continuous expression of interferon regulatory factor 4 sustains CD8+ T cell immunity against tumor. Research (Wash D C) 2023;6:0271. [PMID: 38178902 DOI: 10.34133/research.0271]
- Luo S, Wang L, Xiao Y, Cao C, Liu Q, et al. Single-cell RNA-sequencing integration analysis revealed immune cell heterogeneity in five human autoimmune diseases. BIO Integration 2023;4(4):145-59. [DOI: 10.15212/bioi-2023-0012]
- Qi F, Li J, Qi Z, Zhang J, Zhou B, et al. Comprehensive metabolic profiling and genome-wide analysis reveal therapeutic modalities for hepatocellular carcinoma. Research (Wash D C) 2023;6:36. [PMID: 37040510 DOI: 10.34133/research.0036]
- Tanevski J, Flores ROR, Gabor A, Schapiro D, Saez-Rodriguez J. Explainable multiview framework for dissecting spatial relationships from highly multiplexed data. Genome Biol 2022;23(1):97. [PMID: 35422018 DOI: 10.1186/s13059-022-02663-5]
- Chen LX, Zhang MD, Xu HF, Ye HQ, Chen DF, et al. Single-nucleus RNA sequencing reveals the spatiotemporal dynamics of disease-associated microglia in amyotrophic lateral sclerosis. Research (Wash D C) 2024;7:548. [DOI: 10.34133/research.0548]
- Ng PY, Zhang C, Li H, Baker DJ. Senescent microglia represent a subset of disease-associated microglia in P301S mice. J Alzheimers Dis 2023;95(2):493-507. [PMID: 37545233 DOI: 10.3233/JAD-230109]
- Cadiz MP, Jensen TD, Sens JP, Zhu K, Song WM, et al. Culture shock: microglial heterogeneity, activation, and disrupted single-cell microglial networks in vitro. Mol Neurodegener 2022;17(1):26. [PMID: 35346293 DOI: 10.1186/s13024-022-00531-1]
- Xu Y, Cui K, Li J, Tang X, Lin J, et al. Melatonin attenuates choroidal neovascularization by regulating macrophage/microglia polarization via inhibition of RhoA/ROCK signaling pathway. J Pineal Res 2020;69(1):e12660. [PMID: 32323368 DOI: 10.1111/jpi.12660]
- Sinner P, Peckert-Maier K, Mohammadian H, Kuhnt C, Drassner C, et al. Microglial expression of CD83 governs cellular activation and restrains neuroinflammation in experimental autoimmune encephalomyelitis. Nat Commun 2023;14(1):4601. [PMID: 37528070 DOI: 10.1038/s41467-023-40370-2]
- Rehman R, Tar L, Olamide AJ, Li Z, Kassubek J, et al. Acute TBK1/IKK-ε inhibition enhances the generation of disease-associated microglia-like phenotype upon cortical stab-wound injury. Front Aging Neurosci 2021;13:684171. [PMID: 34326766 DOI: 10.3389/fnagi.2021.684171]
- Schlepckow K, Monroe KM, Kleinberger G, Cantuti-Castelvetri L, Parhizkar S, et al. Enhancing protective microglial activities with a dual function TREM2 antibody to the stalk region. EMBO Mol Med 2020;12(4):e11227. [PMID: 32154671 DOI: 10.15252/emmm.201911227]
- Zhu Y, Hou H, Rezai-Zadeh K, Giunta B, Ruscin A, et al. CD45 deficiency drives amyloid-β peptide oligomers and neuronal loss in Alzheimer’s disease mice. J Neurosci 2011;31(4):1355-65. [PMID: 21273420 DOI: 10.1523/JNEUROSCI.3268-10.2011]
- Vo N, Rillahan CD, Chatila ZK, Virga DM, Hall JL, et al. CD33-CD45 interaction reveals a mechanistic link to Alzheimer’s disease susceptibility. bioRxiv 2025. [DOI: 10.1101/2025.07.28.667311]
- Wang YY, Huang ZT, Yuan MH, Jing F, Cai RL, et al. Role of hypoxia inducible factor-1α in Alzheimer’s disease. J Alzheimers Dis 2021;80(3):949-61. [PMID: 33612545 DOI: 10.3233/JAD-201448]
- Zhang Y, Zhang S, Yang L, Zhang Y, Cheng Y, et al. Lactate modulates microglial inflammatory responses through HIF-1α-mediated CCL7 signaling after cerebral ischemia in mice. Int Immunopharmacol 2025;146:113801. [PMID: 39675197 DOI: 10.1016/j.intimp.2024.113801]
- Kanazawa T, Sato W, Raveney BJE, Takewaki D, Kimura A, et al. Pathogenic potential of eomesodermin-expressing T-helper cells in neurodegenerative diseases. Ann Neurol 2024;95(6):1093-98. [PMID: 38516846 DOI: 10.1002/ana.26920]
- Gao T, Jernigan J, Raza SA, Dammer EB, Xiao H, et al. Transcriptional regulation of homeostatic and disease-associated-microglial genes by IRF1, LXRβ, and CEBPα. Glia 2019;67(10):1958-75. [PMID: 31301160 DOI: 10.1002/glia.23678]
- Fan LY, Yang J, Liu RY, Kong Y, Guo GY, et al. Integrating single-nucleus sequence profiling to reveal the transcriptional dynamics of Alzheimer’s disease, Parkinson’s disease, and multiple sclerosis. J Transl Med 2023;21(1):649. [PMID: 37735671 DOI: 10.1186/s12967-023-04516-6]
- Lourenco AR, Roukens MG, Seinstra D, Frederiks CL, Pals CE, et al. C/EBPɑ is crucial determinant of epithelial maintenance by preventing epithelial-to-mesenchymal transition. Nat Commun 2020;11(1):785. [DOI: 10.1038/s41467-020-14556-x]
- Meng C, Chen S, He Q, Tan J, Wu J, et al. IKZF3 modulates cerebral ischemia/reperfusion injury by inhibiting neuroinflammation. Int Immunopharmacol 2023;114:109480. [PMID: 36525791 DOI: 10.1016/j.intimp.2022.109480]
- Seet LF, Toh LZ, Chu SWL, Wong TT. RelB regulates basal and proinflammatory induction of conjunctival CCL2. Ocul Immunol Inflamm 2021;29(1):29-42. [PMID: 31618101 DOI: 10.1080/09273948.2019.1662060]