Ultrasound-Trained Artificial Intelligence for Postmenopausal Adnexal Lesion Characterization: A Multicenter Diagnostic Accuracy Study
1The Third Affiliated Hospital of Sun Yat-Sen University, Guangzhou, China
2Taihe Hospital, Affiliated Hospital of Hubei University of Medicine, Shiyan, China
3Women’s Hospital, School of Medicine Zhejiang University, Hangzhou, China
4WenZhou People’s Hospital, The Wenzhou Third Clinical Institute Affiliated to Wenzhou Medical University, Wenzhou, China
5Nanjing Women and Children’s Healthcare Hospital, Nanjing, China
6Sun Yat-sen Memorial Hospital, Sun Yat-Sen University, Guangzhou, China
7Women & Infants Hospital of Zhengzhou, Zhengzhou, China
8Jining No. 1 People’s Hospital, Jining, China
9The First Affiliated Hospital of Wannan Medical College, Wuhu, China
10Sonoscape Medical Corporation, Shenzhen, China
11Maternal and Child Health Hospital of Hubei Province, Tongji Medical College, Huazhong University of Science and Technology, Wuhan, China
12Jiangxi Maternal and Child Health Hospital, Nanchang, China
aM.L.W., J.W.W., and Y.W. contributed equally to this work.
bS.Z., X.Z., and X.L.Z. are co–senior authors.
*Correspondence to: Xinling Zhang, Department of Ultrasound, Third Affiliated Hospital of Sun Yat-sen University, 600 Tianhe Road, Guangzhou, Guangdong Province, PR 510630, China. Tel: +86-020-85253030; Fax: +86-020-85252416; E-mail: zhxinl@mail.sysu.edu.cn
Received: October 8 2025; Revised: December 06 2025; Accepted: December 11 2025; Published Online: December 24 2025
Cite this paper:
Wu M, Wu J, Wang Y et al. Ultrasound-Trained Artificial Intelligence for Postmenopausal Adnexal Lesion Characterization: A Multicenter Diagnostic Accuracy Study. BIO Integration 2025; 6: 1–12.
DOI: 10.15212/bioi-2025-0175. Available at: https://bio-integration.org/
Download citation
© 2025 The Authors. This is an open access article distributed under the terms of the Creative Commons Attribution License (https://creativecommons.org/licenses/by/4.0/). See https://bio-integration.org/copyright-and-permissions/
Abstract
Objective: The purpose of this work was to establish and assess deep learning (DL) models based on ultrasound images for discriminating between benign and malignant adnexal lesions in postmenopausal women.
Materials and methods: In this retrospective multicenter study, a total of 662 adnexal lesions from 662 postmenopausal women between January 2020 and December 2024 were included. Five DL models (modelResnet50, modelswin_transformer, modelvit, modelConvnext_tiny, and modelRegnet_y_8gf) were trained and validated. Model performance was assessed with area under the curve (AUC), sensitivity, specificity, positive predictive value, and negative predictive value. The Assessment of Different NEoplasias in the adneXa (ADNEX) model without CA-125 was applied for comparison. The diagnostic performance of junior radiologists was assessed without or with DL model assistance. In addition, subgroup analysis was performed to assess the robustness of the DL models.
Results: Modelswin_transformer yielded the highest AUC (0.964) among DL models in the external validation cohort (n = 93), with high sensitivity (0.952) and specificity (0.903). No statistical difference was observed between the AUCs of modelswin_transformer and the ADNEX model (AUC: 0.968; P = 0.819). Junior radiologists assisted by the DL model exhibited improved diagnostic performance, with higher AUCs (0.938 vs. 0.819; 0.944 vs. 0.838) and sensitivity (0.905 vs. 0.667; 1.000 vs. 0.857), while maintaining comparable specificity. However, modelswin_transformer did not significantly improve the diagnostic performance of attending radiologists and senior radiologists. Subgroup analyses revealed that modelswin_transformer presented superior diagnostic accuracy in purely cystic lesions, solid lesions, and lesions with a maximum diameter < 100 mm.
Conclusion: The proposed DL model has potential to assist radiologists in classifying adnexal lesions in postmenopausal women by effectively enhancing the diagnostic performance of junior radiologists in resource-limited healthcare settings.
Keywords
Adnexal lesion; deep learning; postmenopausal.
Introduction
Ovarian carcinoma is the eighth most common neoplasm and the eighth deadliest cancer among women worldwide [1, 2]. In 2022, approximately 206,839 deaths and 324,398 new cases occurred globally [3]. The incidence of ovarian cancer is increasing in certain regions, particularly in Asia and Eastern Europe [4]. Consequently, the accurate differentiation between benign and malignant adnexal lesions is critical for determining optimal treatment strategies [5].
Transvaginal ultrasonography is recommended as the first-line imaging modality for the assessment of adnexal malignancies, because of its non-ionizing nature, cost-effectiveness, and real-time evaluation capability [6]. However, its diagnostic performance is highly operator-dependent: less experienced practitioners demonstrate lower accuracy and interobserver agreement. This variability can result in significant clinical errors, such as delayed cancer diagnoses or unwarranted medical interventions, thereby placing considerable strain on healthcare resources [7, 8]. Several evidence-based frameworks have been created to standardize the classification of adnexal lesions, including the Risk of Malignancy Index (RMI) [9], the International Ovarian Tumour Analysis (IOTA) Simple Rules [10, 11], the IOTA Assessment of Different NEoplasias in the adneXa (ADNEX) model [12], and the American College of Radiology (ACR) Ovarian-Adnexal Reporting and Data System (O-RADS) [13–15]. Among these, the ADNEX model exhibits the highest performance, achieving an area under the curve (AUC) of 0.94 [12, 16]. Despite their high diagnostic accuracy, these models’ applications remain constrained by the inherent subjectivity of the operator’s initial ultrasound interpretation [16–18].
The diagnosis of adnexal masses has greatly benefited from recent developments in deep learning (DL) models [19]. These models can capture subtle imaging features that might be missed by traditional ultrasound interpretation, thus enabling more accurate preoperative discrimination between benign and malignant ovarian lesions [20]. Recent studies have shown that convolutional neural networks can correctly classify adnexal lesions, with AUCs ranging from 0.90 to 0.95 [6, 21–24]. However, current diagnostic models using artificial intelligence (AI) to distinguish between benign and malignant ovarian masses were developed on the basis of data from adult women ≥ 18 years of age. Because postmenopausal women have greater risk of ovarian malignancies than premenopausal counterparts [25], a critical need exists to focus diagnostic strategies on postmenopausal women. Nonetheless, to our knowledge, no prior studies have developed a DL model for diagnosing adnexal masses in postmenopausal individuals [26, 27].
Hence, this study was aimed at establishing and validating a DL network to distinguish benign cases from ovarian cancer in postmenopausal individuals.
Methods
Study design
This retrospective study included adnexal lesions detected on routine ultrasound at tertiary hospitals in China between January 2020 and December 2024. Ethical approval was obtained from the institutional review boards of the Third Affiliated Hospital of Sun Yat-sen University (EY2022-117-04), and the requirement for informed consent was waived because the study was conducted retrospectively.
Eligibility was restricted to postmenopausal women with lesions that were either: (1) expectantly managed for at least 6 months and classified as benign by an ultrasound expert’s subjective assessment or (2) surgically removed with available histopathological confirmation within 120 days after the ultrasound examination [11, 28]. The exclusion criteria comprised indeterminate pathological diagnoses and a history of ovarian cancer or bilateral oophorectomy. Postmenopausal status was defined as (1) age >50 years and a previous hysterectomy without bilateral oophorectomy or (2) the presence of amenorrhea for more than 1 year [16]. The reference standard for the final classification was either pathological results or stable benign appearance on ultrasound, confirmed after 6 months of expectant management.
Data collection
All ultrasound scans were performed through a standardized technique by specialists with fellowship training and more than 5 years of experience in gynecological sonography after residency. Various ultrasound systems were used to scan adnexal lesions, including the GE Voluson E8, E10, and S8 (GE Healthcare, Zipf, Austria); Samsung HERA W10 (Samsung Medison, Seoul, South Korea); Philips EPIQ 7 (Philips Healthcare, Amsterdam, the Netherlands); Sonoscape P80 and S60 (Sonoscape, Shenzhen, China); and Mindray Nuewa R9 (Mindray, Shenzhen, China). For each adnexal lesion, 2D grayscale ultrasound images were obtained and exported as JPEG images. Patients’ age and menopausal status were also collected. All data were anonymized. For the purpose of this study, only one lesion per patient was analyzed. When a patient presented with multiple lesions, the one with the most complex ultrasound morphology was included. In cases of similar morphology, the largest lesion was selected.
For each case, only a single representative ultrasound image that best captured the most salient sonographic features of the adnexal lesion was selected for analysis. The selection of the representative ultrasound images was performed independently by two senior radiologists, each with more than 5 years of experience in gynecological ultrasound. Both senior radiologists independently reviewed the ultrasound images for each lesion and identified the image that they deemed most representative. In cases of disagreement, both senior radiologists jointly reviewed the images to reach a consensus on the most representative image.
For solid lesions or cystic lesions with solid components, the selected representative image was the one that best displayed the most suspicious solid components. For cystic lesions without solid components, the selected image was the one that best demonstrated the features of an irregular wall or septa of the lesion. Otherwise, the image that represented the largest cross-sectional area of the lesion was selected.
Image processing and model development
Two experienced radiologists, each with more than 5 years of experience in gynecologic ultrasound, used SonoKit software (version V2.8.8, Sonoscape, Shenzhen, China) to outline the lesion region of interest while being blinded to the pathology findings.
The dataset was divided into a training cohort, an internal validation cohort, and an external validation cohort. Data from the Third Affiliated Hospital of Sun Yat-sen University, Maternal and Child Health Hospital of Hubei Province, Taihe Hospital, Women’s Hospital of Zhejiang University, WenZhou People’s Hospital, Jiangxi Maternal and Child Health Hospital, Jiangxi Maternal and Child Health Hospital, and Sun Yat-sen Memorial Hospital of Sun Yat-sen University composed the training and internal validation cohorts. To validate model generalizability, we used a separate dataset from Nanjing Women and Children’s Healthcare Hospital.
To obtain more reliable experimental results, we trained five DL models (modelResnet50, modelConvnext_tiny, modelRegnet_y_8gf, modelswin_transformer, and modelvit) on the training set. These state-of-the-art image classification models used a three-stage “stem-main network-classification head” architecture enabling progressive extraction of low-to-high-level features through increasingly deep network layers. All five models incorporated skip connections to address gradient vanishing issues in deep network training. The output of the last layer was adjusted to two classes corresponding to the binary classification task, and a sigmoid activation function was applied to obtain the probability of malignant tumors. Weighted cross-entropy loss was used as the objective function, and focal loss was used to address class imbalance between benign and malignant cases.
The specific models used were ResNet50, RegNet-Y-8GF, ConvNeXt-Tiny, Swin Transformer, and Vit-Base. The model weights were randomly initialized for training. Key training hyperparameters included 50 epochs, a batch size of 32, and an initial learning rate of 0.001. A 5-epoch warm-up phase was implemented, wherein the learning rate linearly increased from 0.0002 to 0.001, and was followed by cosine decay scheduling to gradually decrease the learning rate to 0.00001. Data augmentation techniques included random rotation, scaling, and flipping. During validation, the models generated continuous prediction scores between 0 and 1 for each image, representing the probability of malignancy. Scores exceeding a predefined threshold were classified as malignant; otherwise, scores were considered benign.
To enhance model interpretability, we applied the Class Activation Map (CAM) method to visualize the image regions that most influenced the model’s decisions. Using the OpenCV package (version 4.3.0.36), we generated heatmaps highlighting the DL models’ key areas of focus within each input ultrasound image.
ADNEX model
Lesions in the external validation cohort were also evaluated with the ADNEX model. The IOTA ADNEX model incorporates nine predictor variables to estimate the risk of malignancy: three clinical characteristics (type of center [oncology center vs. other], patient age, and serum CA-125 level) and six ultrasound characteristics (maximum lesion diameter, maximum solid tissue diameter, number of papillary projections, presence of more than ten cyst locules, acoustic shadows, and ascites). The model computes a probability score for malignancy according to these inputs. In this analysis, a probability threshold of 10% was applied to classify a lesion as malignant. We applied the version of the ADNEX model without CA-125, because of the availability of CA-125 results for only a subset of patients.
The ADNEX model calculations and interpretations in this study were performed independently by two senior radiologists with more than 5 years of experience in gynecological ultrasonography. They independently reviewed the images and then reached a consensus on the sonographic features required for the ADNEX model. Both radiologists were blinded to the nature of the lesions as well as the diagnostic outcomes generated by the AI model.
AI-assisted diagnosis
We recruited radiologists with varying levels of experience in gynecological ultrasonography: two junior radiologists with less than 2 years of work experience, two attending radiologists with 2–5 years of work experience, and two senior radiologists with more than 5 years of work experience. The participating radiologists evaluated a total of 93 cases (72 benign and 21 malignant) selected from the database of Nanjing Women and Children’s Healthcare Hospital. Initially, each radiologist independently reviewed the ultrasound images with pattern recognition to render a diagnosis (benign or malignant). Subsequently, the probability of malignancy generated by the DL model was provided to each radiologist. With this AI assistance, they reassessed all cases to provide an assisted diagnosis. All six radiologists were blinded to the final pathological results and any additional clinical information.
Subgroup analysis
The robustness of the AI models was evaluated through subgroup analyses by lesion type (categorized as cyst without solid components, cyst with solid components, or solid lesion) and maximum lesion diameter (<100 mm or ≥100 mm).
Solid components were defined as solid tissue ≥ 3 mm in height. Solid lesions were defined as adnexal lesions with at least 80% solid tissue (according to echogenicity and echotexture). Cystic lesions with solid components were defined as unilocular, bilocular, and multilocular lesions containing solid tissue ≥ 3 mm in height. Cystic lesions without solid components were defined as unilocular, bilocular, and multilocular lesions without solid tissue ≥ 3 mm in height.
Statistical analysis
All statistical analyses were performed in R software (version 4.4.3, R project) and Python (version 3.7.15, Python Software Foundation). A two-sided P-value ≤ 0.05 defined statistical significance. In all analyses, borderline ovarian tumors were classified as malignant.
Continuous variables are represented by medians with interquartile ranges (IQRs) in parentheses, whereas categorical variables are displayed as counts and percentages. To evaluate the diagnostic capability of each model and radiologist, we calculated the AUC and 95% confidence interval (CI), as well as sensitivity, specificity, accuracy, positive predictive value (PPV), and negative predictive value (NPV). The AUC values were compared among models with DeLong’s test. Differences in sensitivity and specificity were tested with McNemar’s test. The determined cut-off value for the AI model was aimed at achieving a negative likelihood ratio as close as possible to 0.05.
Results
Baseline characteristics
A total of 677 adnexal lesions from 677 patients were initially screened between January 2020 and December 2024. After exclusion of 15 lesions because of a prior history of ovarian cancer, 662 lesions from 662 postmenopausal patients were finally included and assigned to the training set (n = 505), internal validation set (n = 64), and external validation set (n = 93) (Figure 1).
Figure 1 Flowchart of the study.
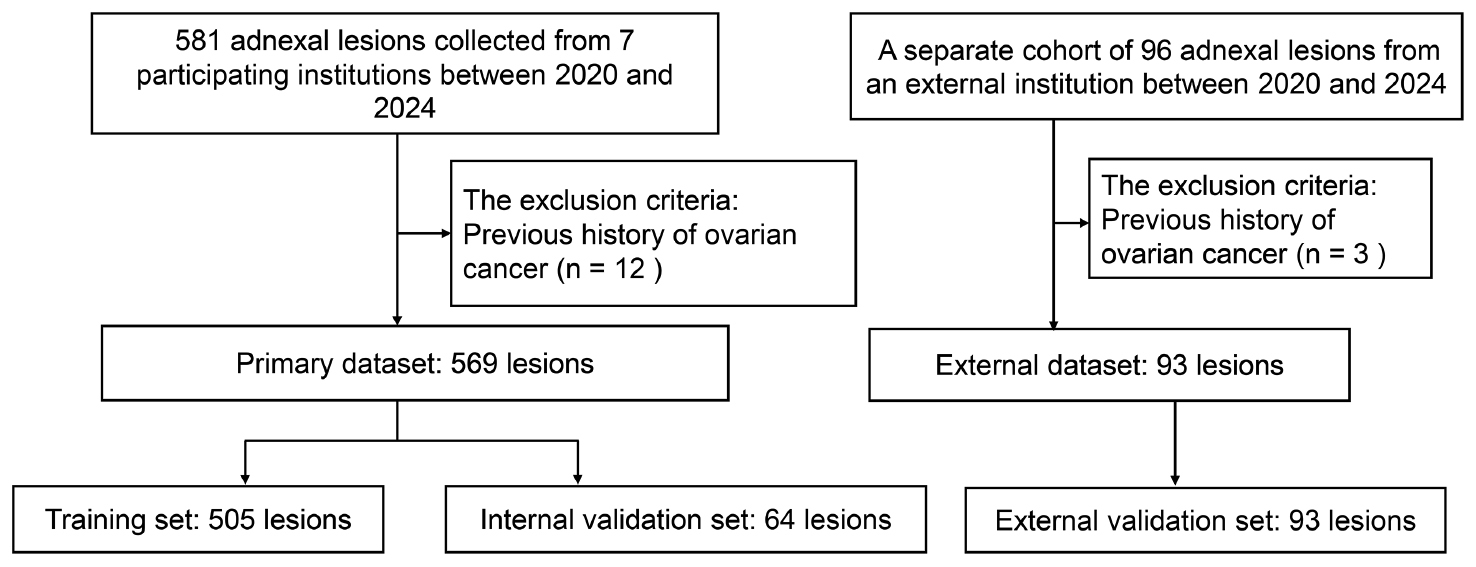
Table 1 summarizes the demographic and clinical baseline characteristics of the study population. The median age was 56.0 years (IQR: 53.0–63.0) in the training cohort, 57.5 years (IQR: 53.8–62.3) in the internal validation cohort, and 58.0 years (IQR: 56.0–65.0) in the external validation cohort. The age significantly differed across cohorts (P = 0.021). The malignancy rates were 30.1%, 32.8%, and 22.6% for the training, internal validation, and external validation cohorts, respectively. No significant difference in malignancy rates was observed among groups (P = 0.213). The proportion of lesions managed surgically was 85.3%, 78.1%, and 58.1% in the training, internal validation, and external validation cohorts, respectively, and significantly differed (P < 0.001). Figure 2 provides an illustration of the study workflow.
Table 1 Summary of the Baseline Characteristics in the Three Cohorts
| Characteristic | Training Cohort (n = 505) | Internal Validation Cohort (n = 64) | External Validation Cohort (n = 93) |
|---|---|---|---|
| Age | |||
| Median (IQR) | 56.0 (53.0, 63.0) | 57.5 (53.8, 62.3) | 58.0 (56.0, 65.0) |
| Outcome | |||
| Benign | 353 (69.9) | 43 (67.2) | 72 (77.4) |
| Malignant | 152 (30.1) | 21 (32.8) | 21 (22.6) |
| Confirmed by histology | |||
| No | 74 (14.7) | 14 (21.9) | 39 (41.9) |
| Yes | 431 (85.3) | 50 (78.1) | 54 (58.1) |
| Diagnosis | |||
| Adenocarcinoma | 11 (2.2) | 1 (1.6) | 0 (0.0) |
| Benign other | 18 (3.6) | 1 (1.6) | 5 (5.4) |
| Carcinosarcoma | 2 (0.4) | 0 (0.0) | 0 (0.0) |
| Clear cell tumor | 14 (2.8) | 3 (4.7) | 3 (3.2) |
| Cystadenofibroma | 8 (1.6) | 3 (4.7) | 0 (0.0) |
| Cystadenoma (serous, mucinous, or seromucinous) | 100 (19.8) | 8 (12.5) | 9 (9.7) |
| Endometrioma | 13 (2.6) | 1 (1.6) | 3 (3.2) |
| Endometrioid ovarian cancer | 5 (1.0) | 0 (0.0) | 3 (3.2) |
| Hemorrhagic cyst | 5 (1.0) | 2 (3.1) | 1 (1.1) |
| Hydrosalpinx | 55 (10.9) | 6 (9.4) | 12 (12.9) |
| Malignant other | 8 (1.6) | 1 (1.6) | 0 (0.0) |
| Mature teratoma | 62 (12.3) | 5 (7.8) | 18 (19.4) |
| Metastasis | 8 (1.6) | 0 (0.0) | 0 (0.0) |
| Mucinous borderline | 12 (2.4) | 1 (1.6) | 1 (1.1) |
| Serous borderline | 16 (3.2) | 1 (1.6) | 3 (3.2) |
| Seromucinous borderline | 3 (0.6) | 0 (0.0) | 0 (0.0) |
| Borderline other | 3 (0.6) | 0 (0.0) | 0 (0.0) |
| Serous Carcinoma | 69 (13.7) | 13 (20.3) | 11 (11.8) |
| Sex cord | 44 (8.7) | 5 (7.8) | 2 (2.2) |
| Simple cyst | 49 (9.7) | 13 (20.3) | 22 (23.7) |
Data were analyzed at the lesion level.
Qualitative variables are expressed as n (%), and quantitative variables are expressed as median ± interquartile range (IQR).
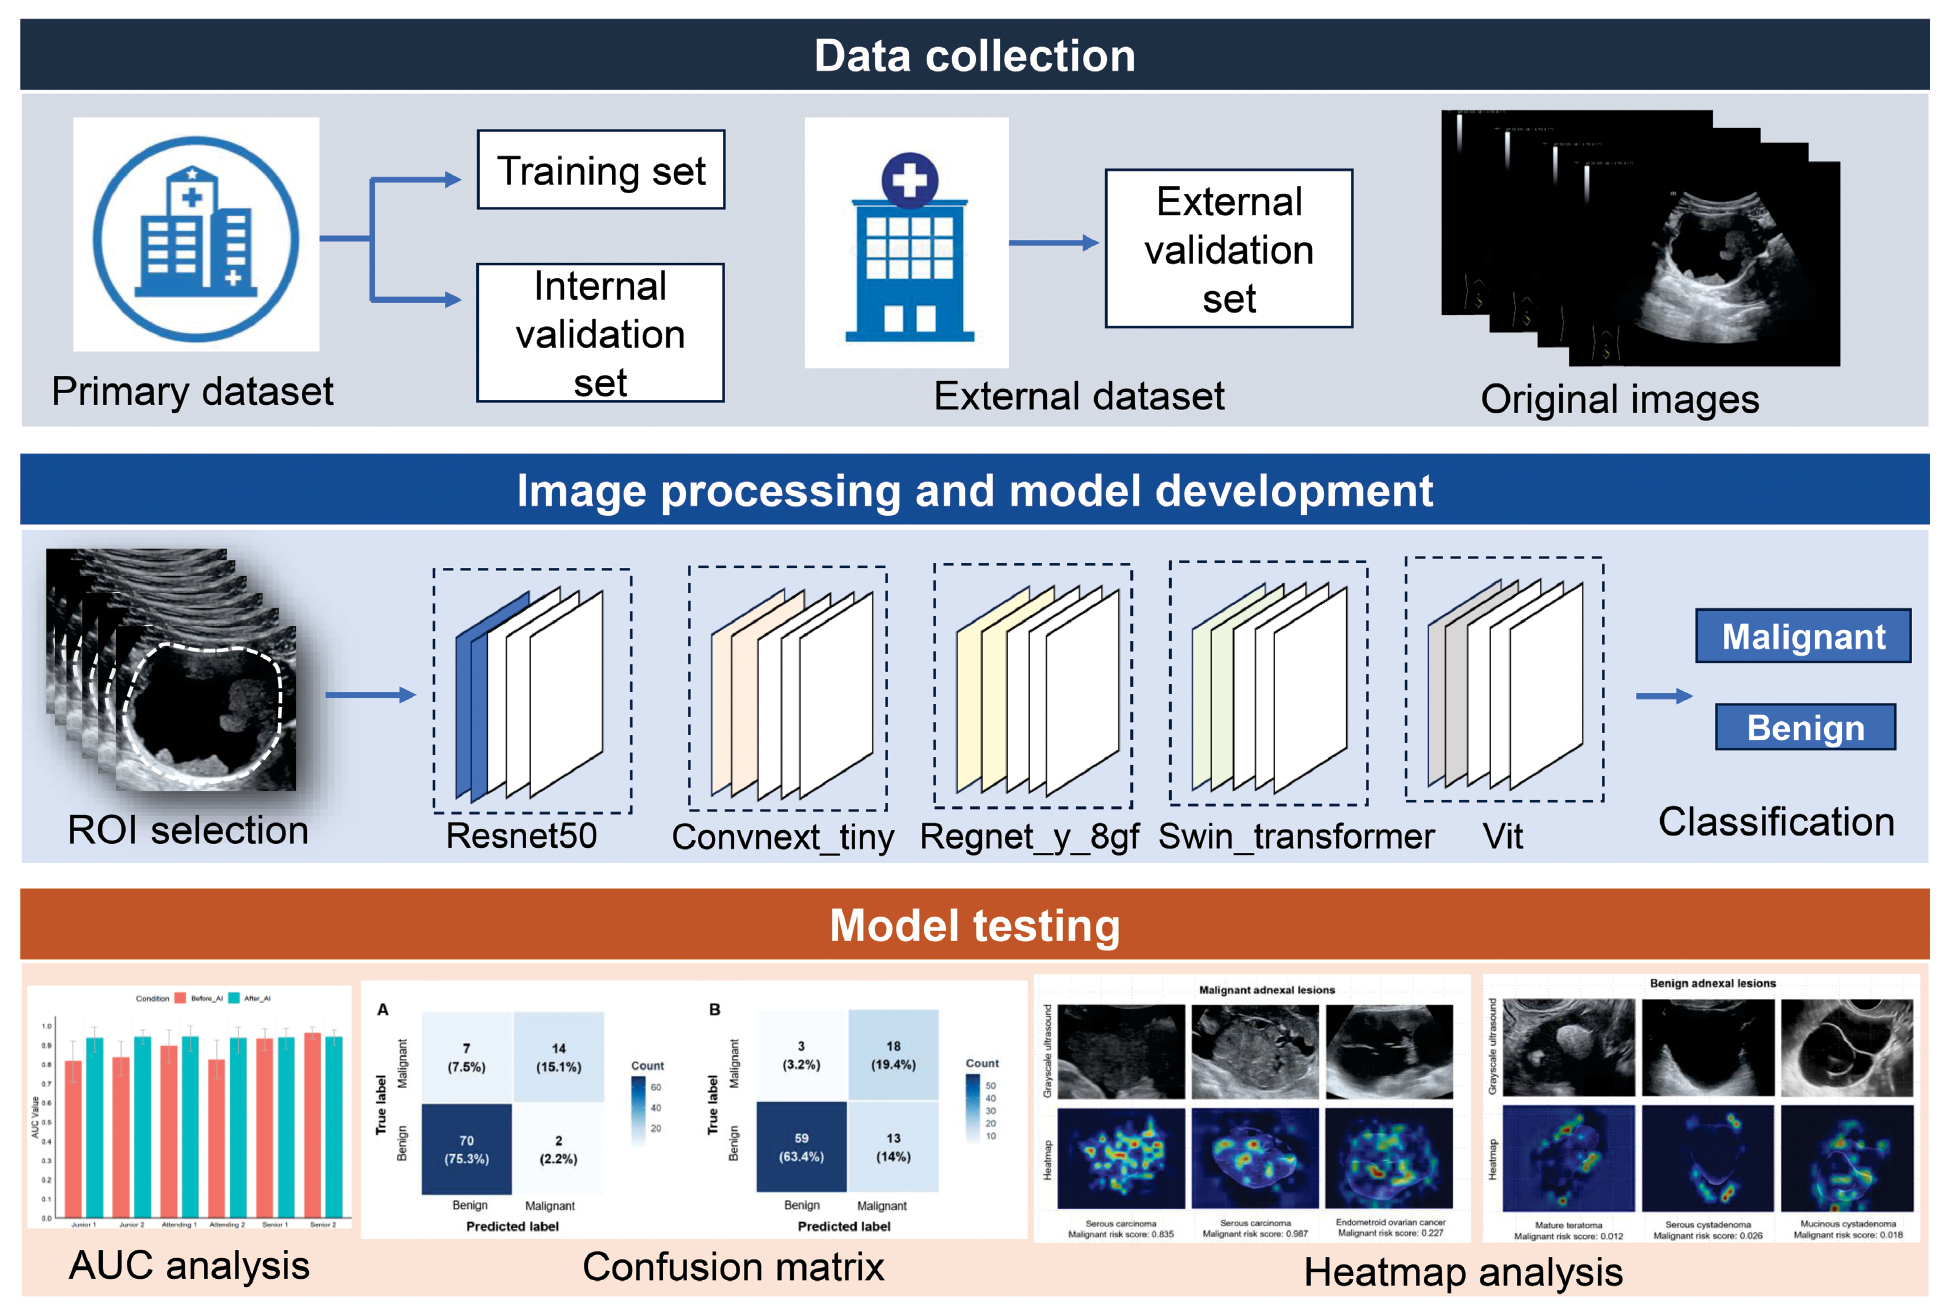
Figure 2 Workflow illustrating deep learning model development and validation.
Performance of DL models versus ADNEX for adnexal malignancy
The performance of the five developed DL models was evaluated in the external validation cohort and compared against the ADNEX model without CA-125 in differentiating benign from malignant adnexal lesions. Table 2 summarizes the performance of the three developed DL models and ADNEX model without CA-125.
Table 2 Performance of Different Deep Learning Models and ADNEX without CA-125 in the External Validation Cohort
| Parameter | Cut-off | AUC (95% CI)a | SENb | SPEc | PPV | NPV |
|---|---|---|---|---|---|---|
| ADNEX without CA-125 | 0.10 | 0.968 (0.935–1.000) | 0.952 | 0.931 | 0.800 | 0.985 |
| ModelResnet50 | 0.117 | 0.948 (0.908–0.989) | 1.000 | 0.722 | 0.512 | 1.000 |
| Modelswin_transformer | 0.078 | 0.964 (0.925–1.000) | 0.952 | 0.903 | 0.741 | 0.985 |
| Modelvit | 0.002 | 0.934 (0.856–1.000) | 0.952 | 0.806 | 0.588 | 0.983 |
| ModelConvnext_tiny | 0.093 | 0.899 (0.784–1.000) | 0.905 | 0.653 | 0.432 | 0.959 |
| ModelRegnet_y_8gf | 0.358 | 0.932 (0.871–0.992) | 0.905 | 0.889 | 0.704 | 0.970 |
ADNEX: assessment of different NEoplasias in the adneXa; AUC: area under curve; CI: confidence interval; SEN: sensitivity; SPE: specificity; PPV: positive predictive value; NPV: negative predictive value.
aAll AUC comparisons were not statistically different (P > 0.05).
bAll sensitivity comparisons were not statistically different (P > 0.05).
cThe ADNEX model without CA-125 showed significantly greater specificity than modelResnet50 (P = 0.001), modelvit (P = 0.027), and modelConvnext_tiny (P < 0.001), and comparable specificity to modelswin_transformer (P = 0.683) and modelRegnet_y_8gf (P = 0.505). Modelswin_transformer showed significantly higher specificity than modelResnet50 (P = 0.006) and modelConvnext_tiny (P < 0.001), and comparable specificity to modelvit (P = 0.146) and modelRegnet_y_8gf (P = 1.000). ModelRegnet_y_8gf showed significantly higher specificity than modelResnet50 (P = 0.003) and modelConvnext_tiny (P < 0.001), and comparable specificity to modelvit (P = 0.181). Modelvit showed significantly higher specificity than modelConvnext_tiny (P = 0.029), and comparable specificity to modelResnet50 (P = 0.264). The specificities of modelConvnext_tiny and modelResnet50 (P = 0.332) showed no statistical difference.
The ADNEX model without CA-125 achieved high diagnostic performance in evaluating adnexal lesions, with an AUC of 0.968 (95% CI: 0.935–1.000). Of the five DL models, modelswin_transformer yielded the highest performance, with an AUC of 0.964 (95% CI: 0.925–1.000), sensitivity of 0.952, and specificity of 0.903. ModelResnet50 yielded slightly lower performance than modelswin_transformer, with an AUC of 0.948 (95% CI: 0.908–0.989), and perfect sensitivity (1.000) and NPV (1.000). The AUCs of modelvit, modelConvnext_tiny, and modelRegnet_y_8gt were 0.934 (95% CI: 0.856–1.000), 0.899 (95% CI: 0.784–1.000), and 0.932 (95% CI: 0.871–0.992), respectively.
The AUCs and sensitivity did not significantly differ among models (P > 0.05). The ADNEX model without CA-125 showed significantly higher specificity than modelResnet50 (P = 0.001), modelvit (P = 0.027), and modelConvnext_tiny (P < 0.001), and presented comparable specificity to modelswin_transformer (P = 0.683) and modelRegnet_y_8gf (P = 0.505).
AI-assisted diagnosis
AI-assisted diagnosis was evaluated with the best DL model (modelswin_transformer) in the external validation cohort. Modelswin_transformer achieved a significantly higher AUC than both junior radiologists (modelswin_transformer: 0.964 vs. radiologist 1: 0.819, P = 0.012; modelswin_transformer: 0.964 vs. radiologist 2: 0.838, P = 0.012). Modelswin_transformer also revealed higher diagnostic performance than attending radiologist 1 (AUC: 0.898, P = 0.184) and attending radiologist 2 (AUC: 0.826, P = 0.008). Modelswin_transformer showed comparable diagnostic performance to senior radiologist 1 (AUC: 0.935, P = 0.373) and senior radiologist 2 (AUC: 0.965, P = 0.939).
Use of modelswin_transformer greatly improved the diagnostic performance of both junior radiologists in distinguishing malignant from benign adnexal lesions (Figure 3). The AUC increased significantly for junior radiologist 1 (from 0.819 to 0.938, P = 0.049) and junior radiologist 2 (from 0.838 to 0.944, P = 0.022) with model use. Marked improvements in sensitivity were also observed for both readers (junior radiologist 1: from 0.667 to 0.905; junior radiologist 2: from 0.857 to 1.000), although these increases did not reach statistical significance (P = 0.131 and P = 0.248, respectively). These gains were achieved without significant loss of specificity, which remained consistently high for junior radiologist 1 (0.972) and junior radiologist 2 (0.889). For attending radiologists and senior radiologists, modelswin_transformer did not markedly improve diagnostic performance in assessment of adnexal lesions (all P > 0.05). The confusion matrix diagram of the predicted results of the radiologists with or without AI is shown in Figure 4.
Figure 3 AI-assisted diagnosis by radiologists with varying experience in gynecological ultrasonography. A, AUC comparisons of AI-assisted diagnosis by the six radiologists. The AUC increased significantly for junior radiologist 1 (from 0.819 to 0.938, P = 0.049) and junior radiologist 2 (from 0.838 to 0.944, P = 0.022). For attending radiologists and senior radiologists, modelswin_transformer did not significantly improve diagnostic performance for assessing adnexal lesions (all P > 0.05). B, Sensitivity comparisons of AI-assisted diagnosis by the six radiologists. All sensitivity comparisons between radiologists with or without AI assistance were not statistically different (all P > 0.05). C, Specificity comparisons of AI-assisted diagnosis by the six radiologists. All specificity comparisons between radiologists with or without AI assistance were not statistically different (all P > 0.05). D, Positive predictive values of AI-assisted diagnosis by the six radiologists. E, Negative predictive values of AI-assisted diagnosis by the six radiologists. AI, artificial intelligence, AUC, area under the curve.
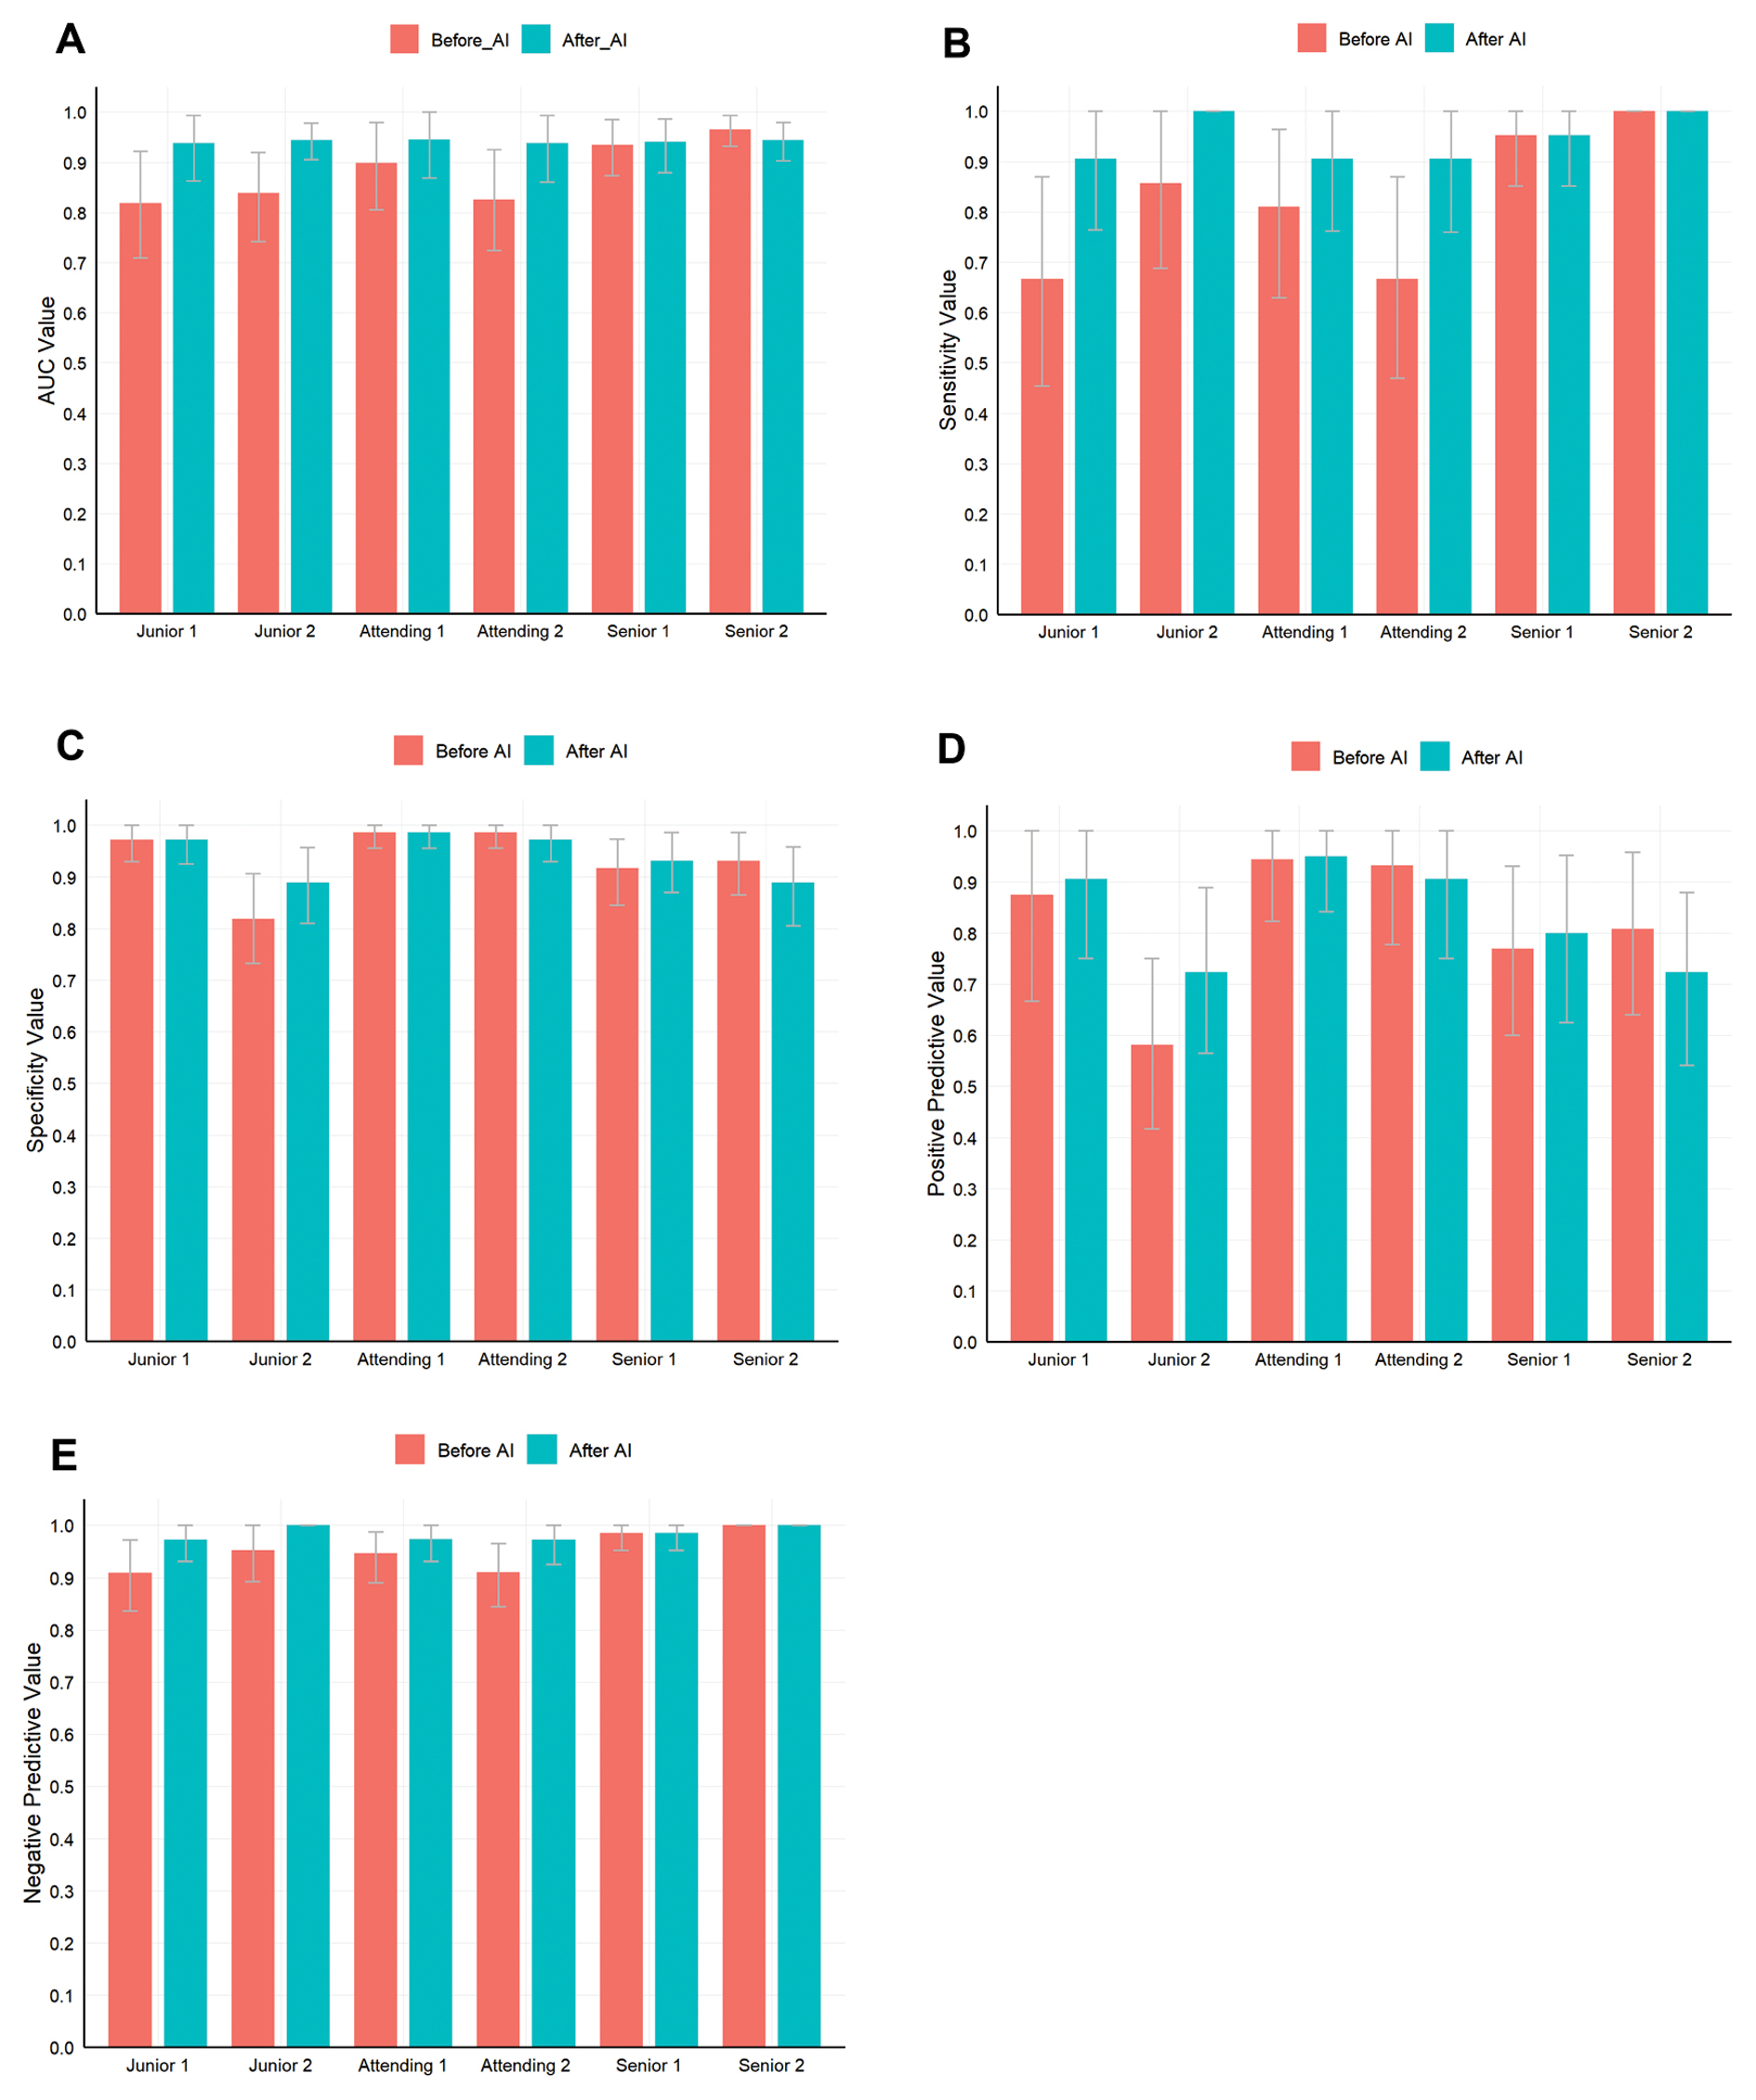
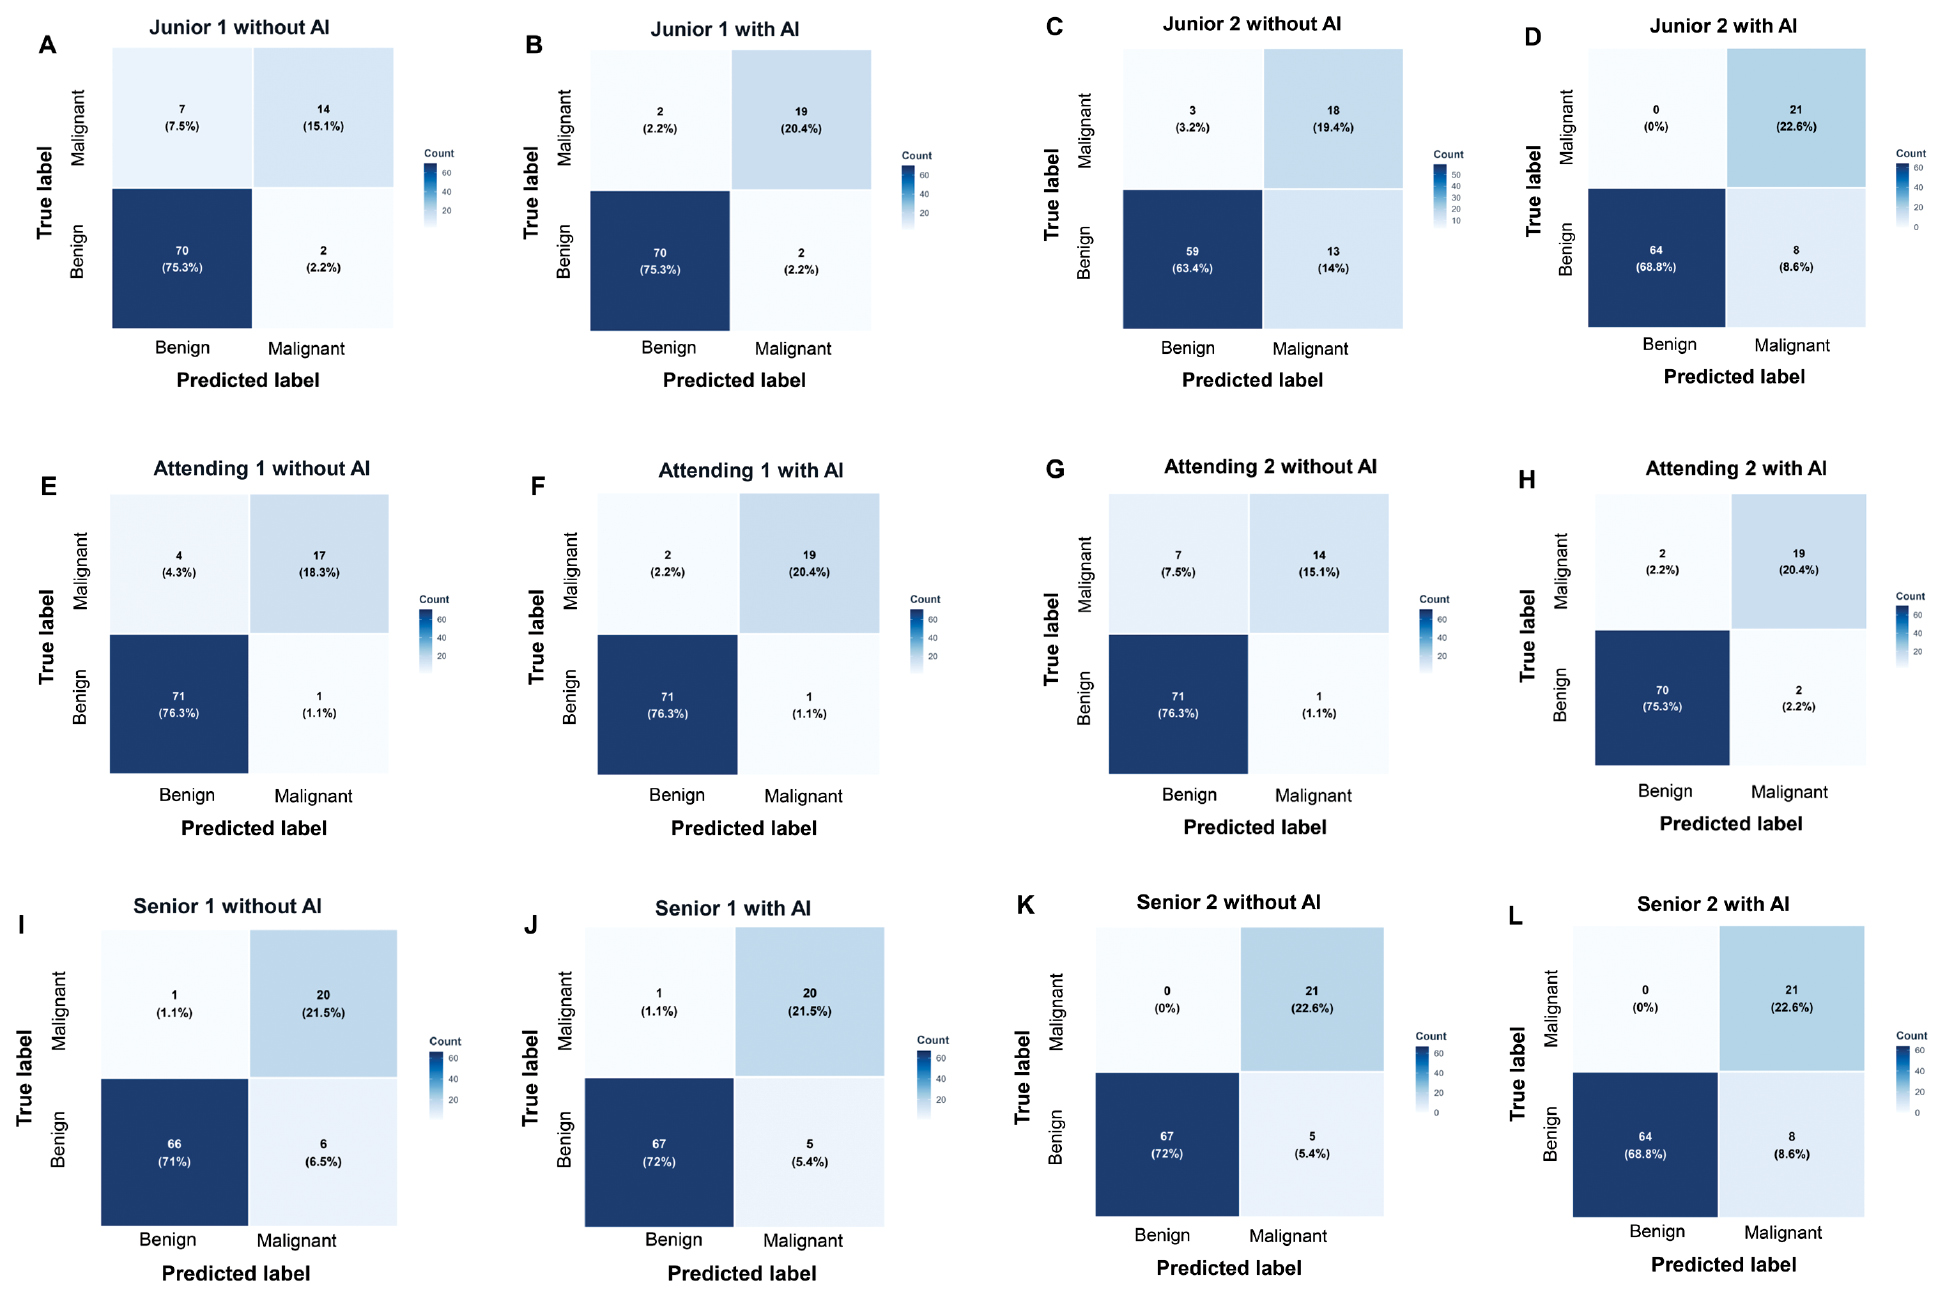
Figure 4 Confusion matrix diagram of the predicted results of AI-assisted diagnosis by radiologists with varying levels of experience in gynecological ultrasonography. A, Junior radiologist 1 without AI assistance. B, Junior radiologist 1 with AI assistance. C, Junior radiologist 2 without AI assistance. D, Junior radiologist 2 with AI assistance. E, Attending radiologist 1 without AI assistance. F, Attending radiologist 1 with AI assistance. G, Attending radiologist 2 without AI assistance. H, Attending radiologist 2 with AI assistance. I, Senior radiologist 1 without AI assistance. J, Senior radiologist 1 with AI assistance. K, Senior radiologist 2 without AI assistance. L, Senior radiologist 2 with AI assistance. AI, artificial intelligence.
Heatmap analysis
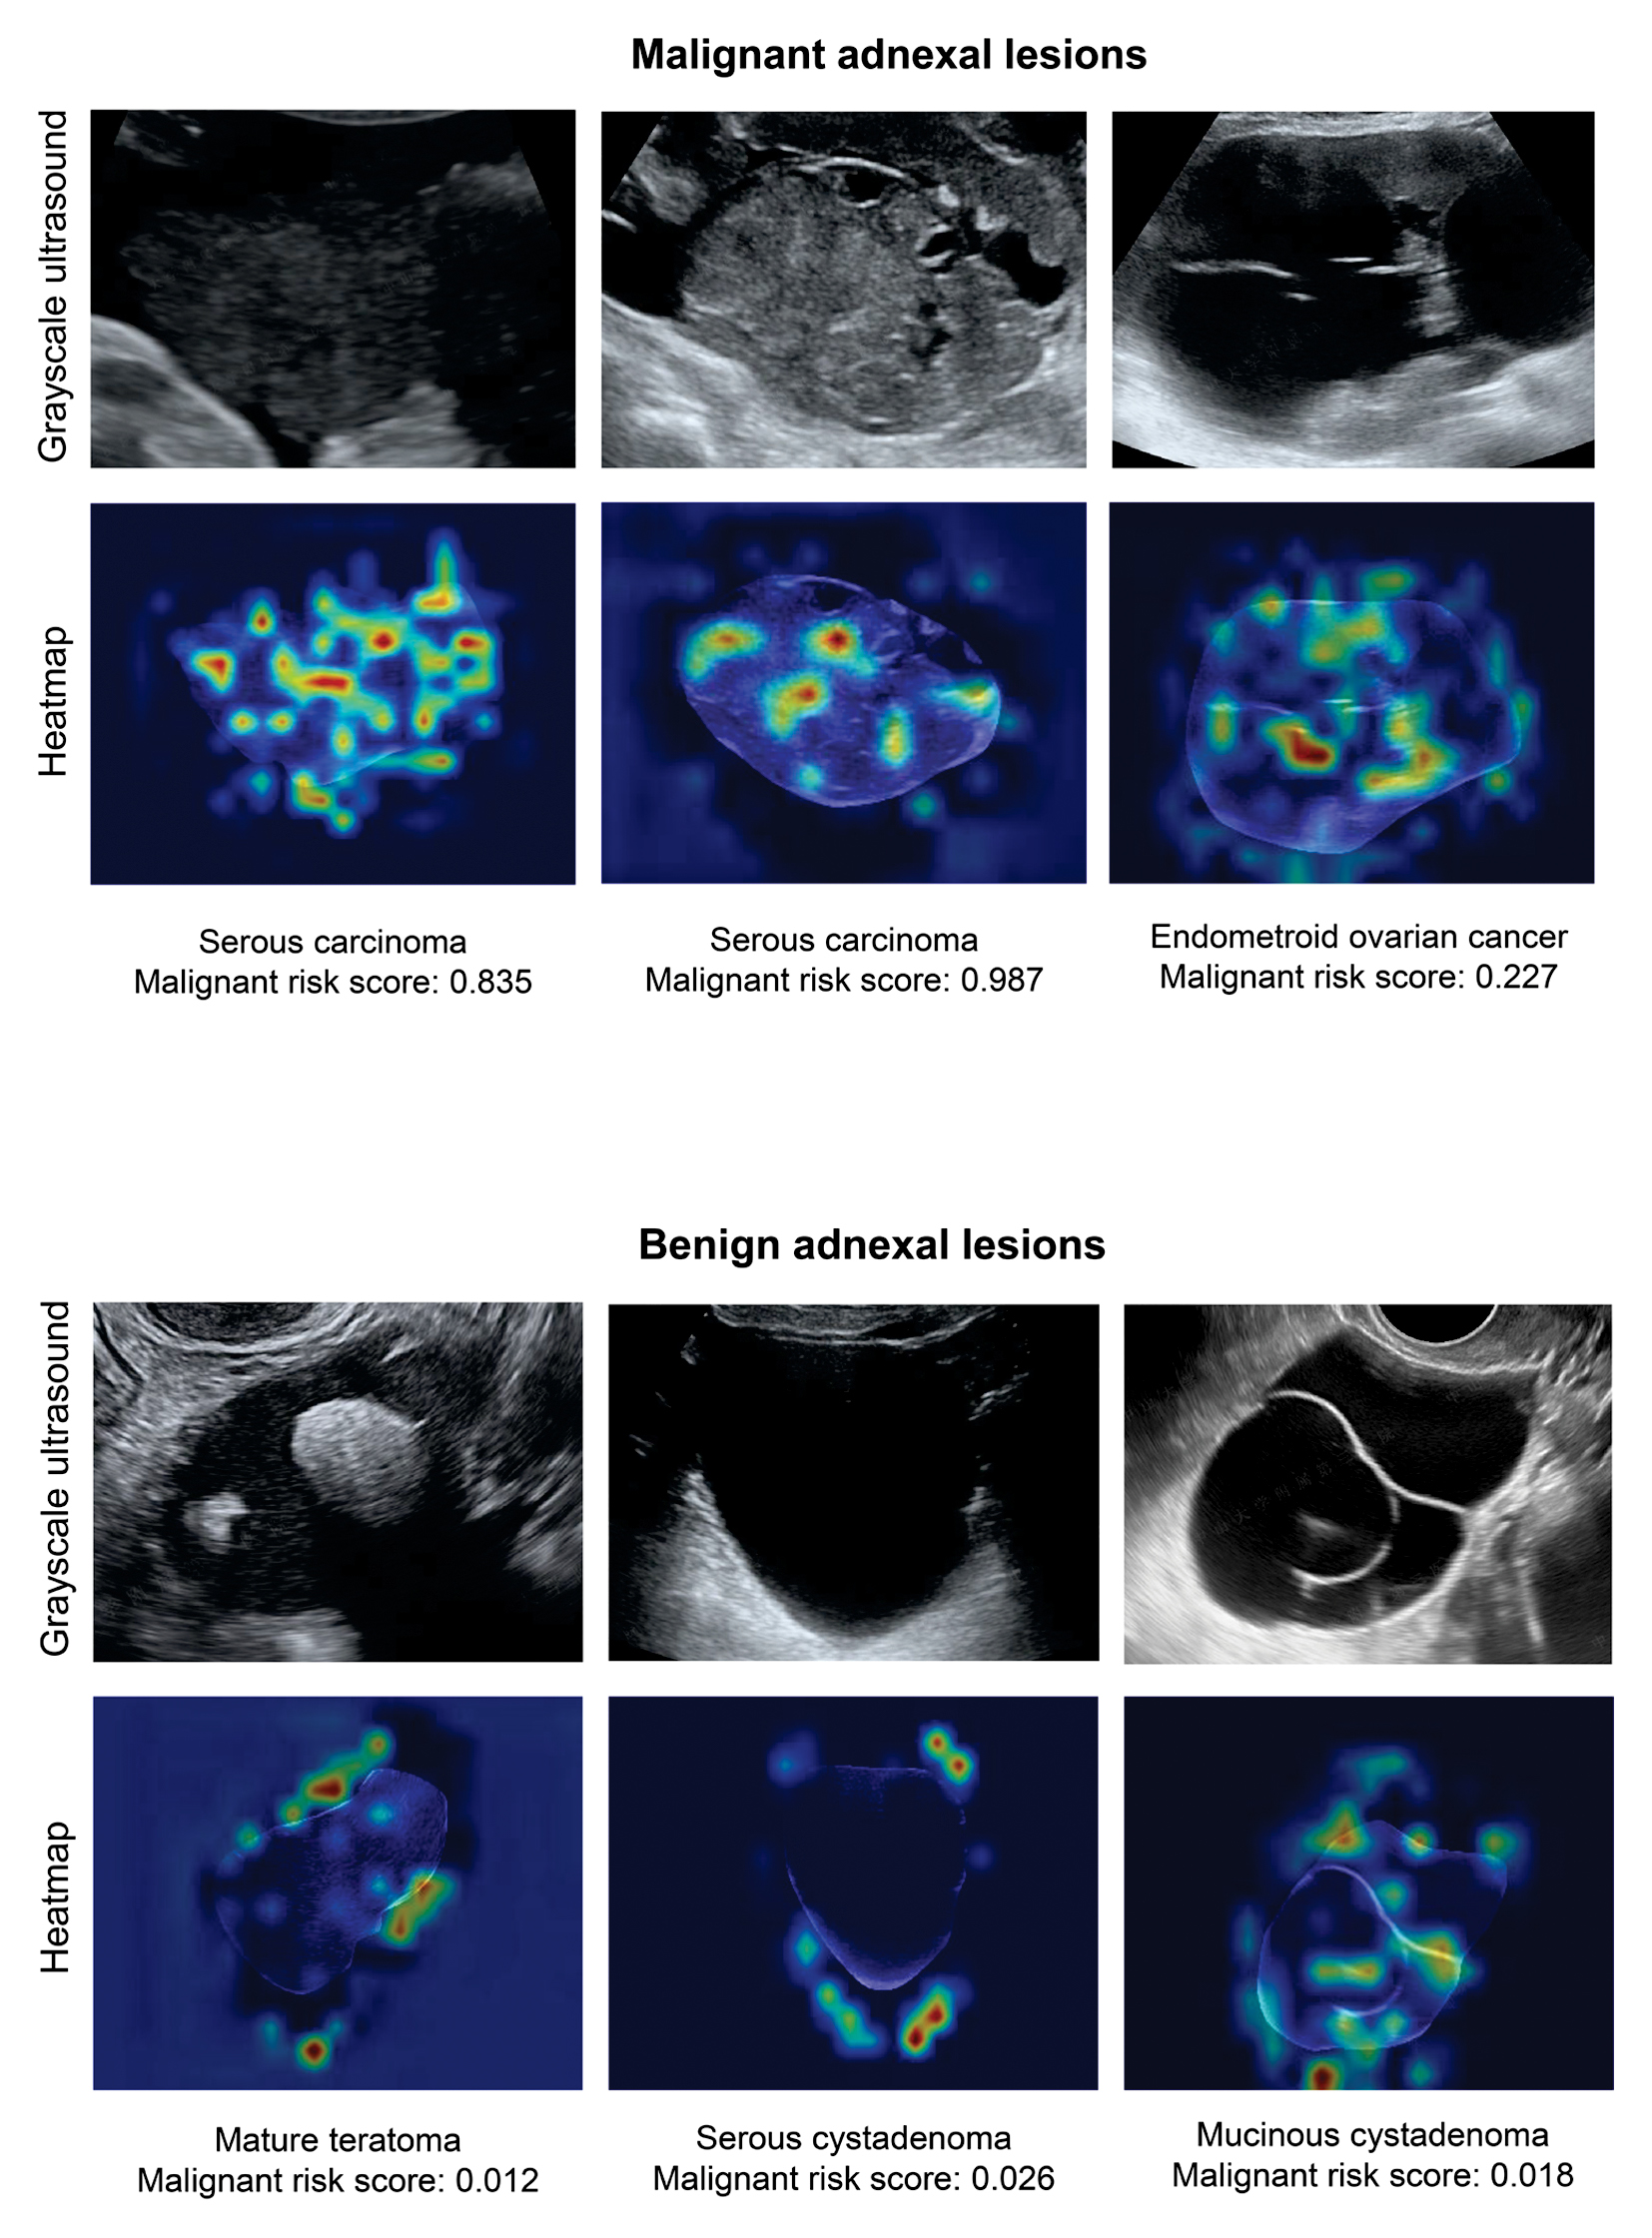
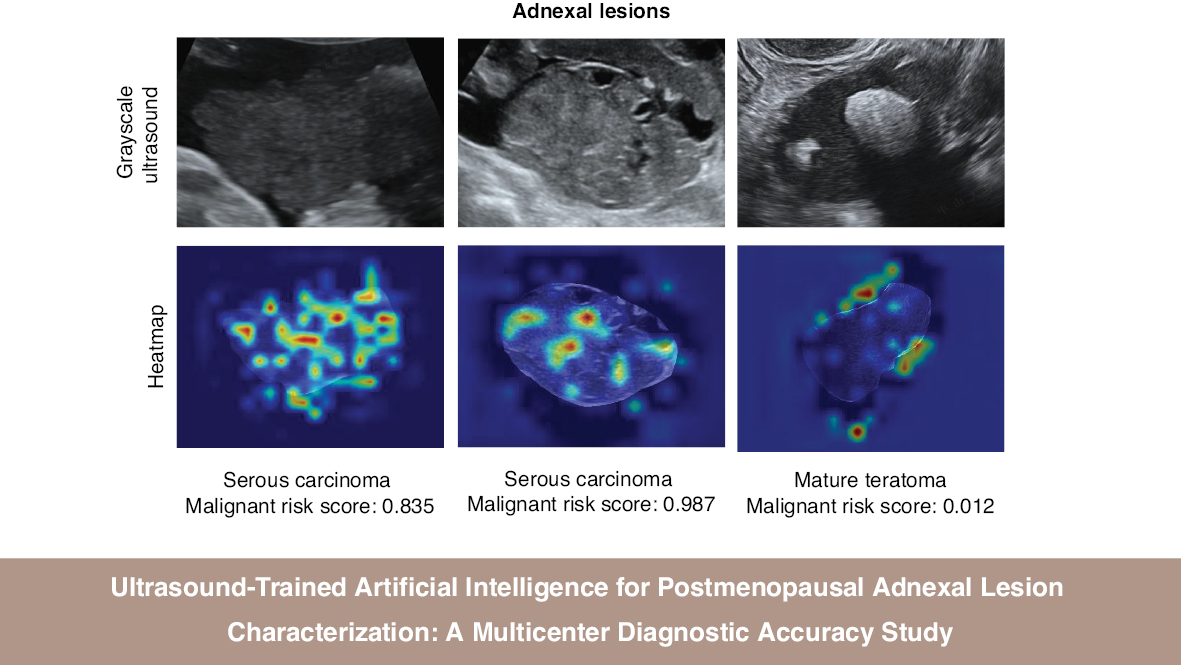
Heatmap analysis with CAM revealed the key regions of interest identified by modelswin_transformer in each ultrasound image (Figure 5). In the heatmaps, areas of red and yellow indicate the highest predictive significance for the model’s decision, whereas blue and green areas correspond to regions of lower predictive value. The analysis demonstrated that the model consistently focused on the solid components and septa within the adnexal lesions.
Figure 5 Examples of mapping of class activation with modelswin_transformer.
Subgroup analysis
To evaluate the robustness of modelswin_transformer across diverse types of adnexal lesions, we conducted a stratified analysis based on lesion morphology and maximum diameter (Table 3). With stratification by lesion type, the model demonstrated high diagnostic accuracy for purely cystic lesions and solid lesions, but lower performance in classifying cysts with solid components (AUC: 0.939 vs. 0.944 vs. 0.778). Furthermore, analysis by lesion size indicated that the model achieved better diagnostic performance in lesions smaller than 100 mm than in lesions with a maximum diameter ≥ 100 mm (AUC: 0.944 vs. 0.810).
Table 3 Subgroup Analysis of Modelswin_transformer Performance in Assessing Adnexal Lesions in the External Validation Cohort
| Parameter | Accuracy | SEN | SPE | PPV | NPV |
|---|---|---|---|---|---|
| Lesion type | |||||
| Cyst without solid components | 0.939 (62/66) | 1.000 | 0.938 | 0.200 | 1.000 |
| Cyst with solid components | 0.778 (7/9) | 1.000 | 0.500 | 0.714 | 1.000 |
| Solid lesion | 0.944 (16/18) | 0.933 | 0.667 | 0.933 | 0.667 |
| Maximum lesion diameter | |||||
| < 100 mm | 0.944 (68/72) | 0.875 | 0.953 | 0.700 | 0.984 |
| ≥ 100 mm | 0.810 (17/21) | 1.000 | 0.500 | 0.765 | 1.000 |
SEN: sensitivity; SPE: specificity; PPV: positive predictive value; NPV: negative predictive value.
Discussion
Ovarian cancer is a major health concern among women worldwide. and postmenopausal women are particularly at risk of malignant adnexal tumor development. Herein, we developed and validated several types of DL models designed primarily for classifying postmenopausal women’s adnexal lesions as either benign or malignant. To our knowledge, this diagnostic study is the first to use ultrasound-trained DL models focusing solely on this high-risk population. The developed DL models demonstrated considerable diagnostic performance in assessing adnexal malignancy, with AUC values of 0.899–0.964. Our DL models therefore might be valuable in guiding healthcare decisions for these patients.
The results of our study are consistent with those from previous research in general adult populations, which have typically reported AUC values of 0.90–0.95 in characterizing tumors’ adnexal nature [6, 21–24]. Radiomics and convolutional neural networks have recently been demonstrated to detect small sonographic signals that might be signs of cancer [27]. Our results further demonstrated that these models retained a high degree of discriminatory power when used solely on postmenopausal women, a group with distinct pathophysiological and morphological traits. This consistency demonstrated the adaptability of DL frameworks to different clinical populations.
The DL models alone showed comparable AUC values to those of the ADNEX model without CA-125, which incorporates both clinical and ultrasonographic characteristics. In a recent study focused on radiomics analysis of ultrasound images to assess adnexal tumors with solid ultrasound morphology [29], the ADNEX model also performed better than AI classifiers based on radiomics. Although the ADNEX model offers high diagnostic accuracy, it is difficult to apply in real clinical settings, because of its relative complexity and restricted accessibility. The need to enter several clinical and sonographic parameters into the model can be laborious and time-consuming in busy clinical settings. Additionally, this model is currently integrated into few ultrasound systems in mainland China, thus hindering widespread use of this straightforward first-line screening tool at most healthcare institutions.
In this study, we demonstrated that modelswin_transformer provides a promising tool for classifying adnexal lesions in postmenopausal women, on the basis of gynecological ultrasound. The model achieved a higher AUC than the junior radiologists and noticeably improved the diagnostic performance of the junior radiologists (P = 0.049 for junior radiologist 1 and P = 0.022 for junior radiologist 2). Integration of modelswin_transformer into real clinical practice has potential to mitigate diagnostic disparities in resource-limited areas.
The AUC comparisons revealed that modelswin_transformer achieved the highest performance among DL models. The superior performance of modelswin_transformer might be due to its hybrid architecture combining the strengths of convolutional neural networks and transformers. Its hierarchical design enables multi-scale feature extraction, which is essential for tumor analysis at different resolutions. Most importantly, the shifted window self-attention mechanism of modelswin_transformer enables a focus on suspicious internal echotexture and tumor boundary. This design mimics a radiologist’s image analysis and best aligns with the medical imaging requirement for higher diagnostic accuracy.
Subgroup analysis also revealed that the diagnostic performance of the DL model varied among lesions with differing lesion morphology and size. Modelswin_transformer showed excellent diagnostic performance in solid lesions (AUC: 0.944), surpassing previously reported values (AUC: 0.80) [29]. This difference might be attributable to the following reasons. First, the relatively small number of solid lesions in our cohort might potentially have led to selection bias. Furthermore, most solid lesions in our study were malignant and therefore might have been easily identified by our AI model. Regarding lesion size, our model showed relatively lower performance for lesions larger than 100 mm, possibly because larger lesions tend to be more complex and to have more heterogeneous features than small lesions. Additionally, the limited number of such cases in our dataset restricted our model’s generalizability to lesions larger than 100 mm. Future prospective studies are needed to include more of these complex cases to improve model generalizability.
This study has several limitations that should be considered. One major limitation is its retrospective design, which might have led to selection bias and affected the generalizability of the results. Because this was a retrospective study, we did not perform post-hoc adjustments or stratification specifically for demographic factors (e.g., patient age and surgical history) during model development or validation, to ensure the robustness of the model. Second, the relatively small sample size in the external validation cohort might have affected the stability of performance metrics. Although images were acquired from multiple machine types, we did not explicitly test the interoperability and robustness of the DL models across ultrasound devices, because of the limited sample size. Finally, because the CA-125 value was not available for all patients, we used the ADNEX model without CA-125 for analysis, which might have impaired accuracy and hindered development of a multimodal DL framework incorporating CA-125 levels alongside the image analysis.
In conclusion, our DL model offers a valuable tool for differentiating adnexal malignancies among postmenopausal women. Our model might assist less experienced radiologists by providing a quantitative risk score alongside images, thereby increasing diagnostic accuracy in low-resource settings. This model could also be used as a triage tool to exclude low-risk adnexal lesions when experts are unavailable. Further prospective, multicenter studies will be essential to optimize and validate model application in clinical practice.
Data availability statement
The datasets analyzed during the current study are not publicly available, because of patient privacy concerns, but are available from the corresponding author on reasonable request.
Ethics statement
Ethical approval was obtained from the institutional review boards of the Third Affiliated Hospital of Sun Yat-sen University (EY2022-117-04).
Author contributions
Manli Wu and Xinling Zhang conceptualized and designed the study. Manli Wu, Jiawei Ju, and Ying Wang contributed to drafting the manuscript. Wenjun Zhang, Jiang Zhu, Liyi You, Yun Wu, Na Di, Wenkai Li, Qinfeng Kong, and Biyun Sun contributed to data collection. Guoyi Zhou, Jiahao Luo, and Yutong Li contributed to data analysis. Sheng Zhao, Xin Zhou, and Xinling Zhang revised the manuscript. All authors read and approved the final version of the manuscript.
Funding
This study was supported by grants from the Guangzhou Basic and Applied Basic Research Foundation (no. 2024A04J4786), Science and Technology Projects of Guangzhou (no. 2023A03J0217), Guangdong Basic and Applied Basic Research Foundation (no. 2023A1515220008), and Natural Science Foundation of Guangdong Province, China (2022A1515012027). The funders had no influence on the study design, data collection and analysis, decision to publish, or preparation of the manuscript.
Conflict of interest
The authors declare that there are no conflicts of interest.
Statement of significance
The proposed DL model offers a promising route to improve diagnostic precision for classifying adnexal lesions among postmenopausal women in low-resource settings.
Graphical abstract
Highlights
- Modelswin_transformer yielded the highest AUC (0.964) among five DL models.
- Modelswin_transformer achieved comparable diagnostic accuracy to the ADNEX model.
- Modelswin_transformer improved the diagnostic performance for junior radiologists.
- Modelswin_transformer did not significantly improve the diagnostic performance for attending radiologists and senior radiologists.
- Modelswin_transformer achieved superior diagnostic accuracy in purely cystic lesions, solid lesions, and lesions with a maximum diameter < 100 mm.
In brief
Our proposed DL models have the potential to help radiologists differentiate benign from malignant adnexal lesions among postmenopausal women. The models could potentially serve as a triage tool to exclude low-risk adnexal lesions in low-resource settings.
References
- Armstrong DK, Alvarez RD, Backes FJ, Bakkum-Gamez JN, Barroilhet L, et al. NCCN Guidelines® Insights: ovarian cancer, Version 3.2022. J Natl Compr Canc Netw 2022;20(9):972-80. [PMID: 36075393 DOI: 10.6004/jnccn.2022.0047]
- Huang J, Chan WC, Ngai CH, Lok V, Zhang L, et al. Worldwide burden, risk factors, and temporal trends of ovarian cancer: a global study. Cancers (Basel) 2022;14(9):2230. [PMID: 35565359 DOI: 10.3390/cancers14092230]
- Caruso G, Weroha SJ, Cliby W. Ovarian cancer: a review. JAMA 2025. [PMID: 40690248 DOI: 10.1001/jama.2025.9495]
- Webb PM, Jordan SJ. Global epidemiology of epithelial ovarian cancer. Nat Rev Clin Oncol 2024;21(5):389-400. [PMID: 38548868 DOI: 10.1038/s41571-024-00881-3]
- Nash Z, Menon U. Ovarian cancer screening: current status and future directions. Best Pract Res Clin Obstet Gynaecol 2020;65:32-45. [PMID: 32273169 DOI: 10.1016/j.bpobgyn.2020.02.010]
- Xiang H, Xiao Y, Li F, Li C, Liu L, et al. Development and validation of an interpretable model integrating multimodal information for improving ovarian cancer diagnosis. Nat Commun 2024;15(1):2681. [PMID: 38538600 DOI: 10.1038/s41467-024-46700-2]
- Van Holsbeke C, Daemen A, Yazbek J, Holland TK, Bourne T, et al. Ultrasound experience substantially impacts on diagnostic performance and confidence when adnexal masses are classified using pattern recognition. Gynecol Obstet Invest 2010;69(3):160-8. [PMID: 20016188 DOI: 10.1159/000265012]
- Christiansen F, Konuk E, Ganeshan AR, Welch R, Palés Huix J, et al. International multicenter validation of AI-driven ultrasound detection of ovarian cancer. Nat Med 2025;31(1):189-96. [PMID: 39747679 DOI: 10.1038/s41591-024-03329-4]
- Jacobs I, Oram D, Fairbanks J, Turner J, Frost C, et al. A risk of malignancy index incorporating CA 125, ultrasound and menopausal status for the accurate preoperative diagnosis of ovarian cancer. Br J Obstet Gynaecol 1990;97(10):922-9. [PMID: 2223684 DOI: 10.1111/j.1471-0528.1990.tb02448.x]
- Timmerman D, Testa AC, Bourne T, Ameye L, Jurkovic D, et al. Simple ultrasound-based rules for the diagnosis of ovarian cancer. Ultrasound Obstet Gynecol 2008;31(6):681-90. [PMID: 18504770 DOI: 10.1002/uog.5365]
- Wu M, Huang L, Chen Y, Wang Y, Zhang M, et al. Diagnostic accuracy of Ovarian-Adnexal Reporting and Data System, IOTA Simple Rules and Pediatric Risk of Malignancy Index for pediatric adnexal lesions: comparative study. Ultrasound Obstet Gynecol 2025;66(3):361-7. [PMID: 40643593 DOI: 10.1002/uog.29291]
- Van Calster B, Van Hoorde K, Valentin L, Testa AC, Fischerova D, et al. Evaluating the risk of ovarian cancer before surgery using the ADNEX model to differentiate between benign, borderline, early and advanced stage invasive, and secondary metastatic tumours: prospective multicentre diagnostic study. BMJ 2014;349:g5920. [PMID: 25320247 DOI: 10.1136/bmj.g5920]
- Andreotti RF, Timmerman D, Benacerraf BR, Bennett GL, Bourne T, et al. Ovarian-adnexal reporting lexicon for ultrasound: a white paper of the ACR ovarian-adnexal reporting and data system committee. J Am Coll Radiol 2018;15(10):1415-29. [PMID: 30149950 DOI: 10.1016/j.jacr.2018.07.004]
- Strachowski LM, Jha P, Phillips CH, Blanchette Porter MM, Froyman W, et al. O-RADS US v2022: an update from the American College of Radiology’s ovarian-adnexal reporting and data system US committee. Radiology 2023;308(3):e230685. [PMID: 37698472 DOI: 10.1148/radiol.230685]
- Wu M, Zhang M, Cao J, Wu S, Chen Y, et al. Predictive accuracy and reproducibility of the O-RADS US scoring system among sonologists with different training levels. Arch Gynecol Obstet 2023;308(2):631-7. [PMID: 35994107 DOI: 10.1007/s00404-022-06752-5]
- Meys EMJ, Jeelof LS, Achten NMJ, Slangen BFM, Lambrechts S, et al. Estimating risk of malignancy in adnexal masses: external validation of the ADNEX model and comparison with other frequently used ultrasound methods. Ultrasound Obstet Gynecol 2017;49(6):784-92. [PMID: 27514486 DOI: 10.1002/uog.17225]
- Meys EMJ, Kaijser J, Kruitwagen RFPM, Slangen BFM, Van Calster B, et al. Subjective assessment versus ultrasound models to diagnose ovarian cancer: a systematic review and meta-analysis. Eur J Cancer 2016;58:17-29. [PMID: 26922169 DOI: 10.1016/j.ejca.2016.01.007]
- Sayasneh A, Kaijser J, Preisler J, Johnson S, Stalder C, et al. A multicenter prospective external validation of the diagnostic performance of IOTA simple descriptors and rules to characterize ovarian masses. Gynecol Oncol 2013;130(1):140-6. [PMID: 23578539 DOI: 10.1016/j.ygyno.2013.04.003]
- Bi WL, Hosny A, Schabath MB, Giger ML, Birkbak NJ, et al. Artificial intelligence in cancer imaging: clinical challenges and applications. CA Cancer J Clin 2019;69(2):127-57. [PMID: 30720861 DOI: 10.3322/caac.21552]
- Hosny A, Parmar C, Quackenbush J, Schwartz LH, Aerts HJWL. Artificial intelligence in radiology. Nat Rev Cancer 2018;18(8):500-10. [PMID: 29777175 DOI: 10.1038/s41568-018-0016-5]
- Ștefan P-A, Lupean R-A, Mihu CM, Lebovici A, Oancea MD, et al. Ultrasonography in the diagnosis of adnexal lesions: the role of texture analysis. Diagnostics (Basel) 2021;11(5):812. [PMID: 33947150 DOI: 10.3390/diagnostics11050812]
- Chen H, Yang B-W, Qian L, Meng Y-S, Bai X-H, et al. Deep learning prediction of ovarian malignancy at US compared with O-RADS and expert assessment. Radiology 2022;304(1):106-13. [PMID: 35412367 DOI: 10.1148/radiol.211367]
- Gao Y, Zeng S, Xu X, Li H, Yao S, et al. Deep learning-enabled pelvic ultrasound images for accurate diagnosis of ovarian cancer in China: a retrospective, multicentre, diagnostic study. Lancet Digit Health 2022;4(3):e179-87. [PMID: 35216752 DOI: 10.1016/S2589-7500(21)00278-8]
- Barcroft JF, Linton-Reid K, Landolfo C, Al-Memar M, Parker N, et al. Machine learning and radiomics for segmentation and classification of adnexal masses on ultrasound. NPJ Precis Oncol 2024;8(1):41. [PMID: 38378773 DOI: 10.1038/s41698-024-00527-8]
- American College of Obstetricians and Gynecologists’ Committee on Practice Bulletins—Gynecology. Practice bulletin no. 174: evaluation and management of adnexal masses. Obstet Gynecol 2016;128(5):e210-26. [PMID: 27776072 DOI: 10.1097/AOG.0000000000001768]
- Grigore M, Popovici RM, Gafitanu D, Himiniuc L, Murarasu M, et al. Logistic models and artificial intelligence in the sonographic assessment of adnexal masses – a systematic review of the literature. Med Ultrason 2020;22(4):469-75. [PMID: 32905566 DOI: 10.11152/mu-2538]
- Koch AH, Jeelof LS, Muntinga CLP, Gootzen TA, van de Kruis NMA, et al. Analysis of computer-aided diagnostics in the preoperative diagnosis of ovarian cancer: a systematic review. Insights Imaging 2023;14(1):34. [PMID: 36790570 DOI: 10.1186/s13244-022-01345-x]
- Landolfo C, Bourne T, Froyman W, Van Calster B, Ceusters J, et al. Benign descriptors and ADNEX in two-step strategy to estimate risk of malignancy in ovarian tumors: retrospective validation in IOTA5 multicenter cohort. Ultrasound Obstet Gynecol 2023;61(2):231-42. [PMID: 36178788 DOI: 10.1002/uog.26080]
- Moro F, Vagni M, Tran HE, Bernardini F, Mascilini F, et al. Radiomics analysis of ultrasound images to discriminate between benign and malignant adnexal masses with solid morphology on ultrasound. Ultrasound Obstet Gynecol 2025;65(3):353-63. [PMID: 38748935 DOI: 10.1002/uog.27680]