Specific Activity of Lactate Dehydrogenase in Muscle and Liver Tissues of Rats Exposed to Intermittent Hypobaric Hypoxia
1Department of Biochemistry and Molecular Biology, Faculty of Medicine Universitas Indonesia, Jakarta, Indonesia
2Center of Hypoxia and Oxidative Stress Studies, Faculty of Medicine Universitas Indonesia, Jakarta, Indonesia
3Undergraduate Program in Medical Sciences, Faculty of Medicine Universitas Indonesia, Jakarta, Indonesia
4Department of Aerophysiology, Lakespra Saryanto, Indonesian Air Force, Jakarta, Indonesia
*Correspondence to: Syarifah Dewi, Salemba Raya No. 6, Central Jakarta, Jakarta 10430, Tel: +6221-3910-734. E-mail: syarifah.dewi@ui.ac.id
Received: August 22 2024; Revised: November 14 2024; Accepted: December 15 2024; Published Online: January 31 2025.
Cite this paper:
Dewi S, Ramadhani ANA, Az-zahra KA et al. Specific Activity of Lactate Dehydrogenase in Muscle and Liver Tissues of Rats Exposed to Intermittent Hypobaric Hypoxia. BIO Integration 2025; 6: 1–6.
DOI: 10.15212/bioi-2024-0074. Available at: https://bio-integration.org/
Download citation
© 2025 The Authors. This is an open access article distributed under the terms of the Creative Commons Attribution License (https://creativecommons.org/licenses/by/4.0/). See https://bio-integration.org/copyright-and-permissions/
Abstract
As the altitude increases, the partial pressure of oxygen will decrease and cause hypobaric hypoxia conditions. During hypoxia, the anaerobic glycolysis will be activated, which is facilitated by the lactate dehydrogenase (LDH) enzyme. This study aimed to analyze the LDH-specific activity in rat muscle and liver tissue, as well as lactate and glucose levels in blood plasma after intermittent hypobaric hypoxia exposure. Twenty-five Wistar rats were divided into five groups: one control group and four hypobaric hypoxia (HH) exposure groups consisting of group 1 (1× HH), group 2 (2× HH), group 3 (3× HH), and group 4 (4× HH) with a range of 7 days between exposure. This study found that LDH-specific activity increased in muscle tissues in group 1, but then decreased in the intermittent group (groups 2–4). The change in LDH-specific activity in muscle tissues was similar to the change in lactate plasma levels. Interestingly, in liver tissues, there was a slight increase in the LDH-specific activity in group 1, and it started to increase significantly in group 2 and kept increasing in groups 3 and 4. The change in LDH-specific activity in liver tissues was similar to the change in glucose plasma level. We conclude that the LDH activity in muscle tissue contributes to lactate plasma levels, but the LDH activity in liver tissue contributes to maintaining glucose plasma after intermittent hypobaric hypoxia exposures. This finding could be implemented in individuals who experience intermittent hypoxia exposures or in various diseases with hypoxic conditions as their pathogenesis
Keywords
Enzyme activity, hypobaric hypoxia, lactate dehydrogenase, liver, muscle.
Introduction
Hypoxia is a condition in which the supply of oxygen cannot meet cell requirements. As the altitude increases the barometric pressure decreases. When the barometric pressure decreases the concentrations of oxygen and nitrogen remain constant in the air so that the partial oxygen pressure decreases. Decreased partial oxygen pressure causes less oxygen to be inhaled. Low pressure makes it difficult for oxygen to diffuse from the alveoli into the blood vessels, which causes hypoxia. Hypoxia caused by altitude is referred to as hypobaric hypoxia [HH] [1, 2].
Under hypoxic conditions the body will stimulate compensatory mechanisms as a physiologic response to maintain homeostasis. Several compensatory mechanisms in response to hypoxia, such as increased heart rate and respiration, increase the amount of oxygen available and changes in cell metabolism to become anaerobic, which results in the production of lactic acid [3, 4]. When the cells obtain sufficient oxygen levels, the energy is produced from aerobic metabolism, but when oxygen levels are insufficient, the energy production will switch to anaerobic metabolism. The citric acid cycle pathway and oxidative phosphorylation will decrease when oxygen is deficient so that the cell metabolism switches to anaerobic metabolism in which the pyruvate produced in the glycolysis pathway will be converted to lactate and catalysed by lactate dehydrogenase [LDH] [5, 6].
The molecular mechanisms involved in the response to hypoxia at the cellular level are well understood. The response to hypoxia may vary in different organs involving complex interactions between different signalling pathways that contribute to variation in an individual’s susceptibility to hypoxia [7–9]. Metabolic changes in response to hypoxia occur in a wide variety of organs, including those of critical importance in the metabolism and storage of nutrients, such as the liver and muscles as tissues that use energy. The liver acts as a provider of blood glucose when blood glucose levels are low and muscles are one of the organs that use blood glucose as a source of energy.
The mechanism underlying metabolic changes at the molecular level is regulated by hypoxia-inducible factor-1 (HIF-1), which is found in almost all body tissues, including the liver and skeletal muscles [10, 11]. HIF-1 is a transcription factor that regulates gene expression in many processes, such as glycolytic enzymes that have a role in metabolism, such as lactate dehydrogenase A (LDH-A), pyruvate kinase, phosphofructokinase, glyceraldehyde-3-phosphate, enolase 1, and phosphoglycerate kinase 1 [12, 13].
LDH is an intracellular enzyme that is widely distributed in the body, where LDH is involved in carbohydrate metabolism. LDH catalyses the interconversion of lactate and pyruvate with the NAD+/NADH coenzyme system. LDH activity is high in the heart, liver, skeletal muscles, kidneys, and erythrocytes, whereas lower amounts of LDH are in the lungs, smooth muscles, and brain [14]. LDH function has a role in anaerobic metabolism that is stimulated in low oxygen conditions [15]. A previous study reported that mice exposed to hypoxia for 24 h had high lactate levels in the blood [16]. Increased LDH and decreased pyruvate dehydrogenase (PDH) activity was also demonstrated in skeletal muscle [16].
Many studies have reported increased LDH expression after hypoxia exposure in various cells or tissues [17] but the effect of intermittent HH on the specific activity of LDH has not been extensively studied, especially in muscle and liver tissues. These two organs were selected because liver tissues have a central role in regulating metabolic homeostasis [18], while muscle is one of the organs that contributes significantly to blood lactate levels [19]. Therefore, this study aimed to determine the effect of intermittent hypobaric hypoxia on the specific activity of LDH in liver and muscle and if LDH is also increased after exposure to intermittent HH.
Materials and methods
Materials
Wistar rats were obtained from The National Institute of Health Research and Development. An lactic dehydrogenase activity assay kit was purchased from Elabscience Biotechnology Inc. (Houston, TX, USA; catalog no. E-BC-K046-M). L-lactate (catalog no. LC3980) and glucose (catalog no. GL8038) assay kits were purchased from Randox Laboratories Ltd. (Crumlin, UK). Bovine serum albumin (BSA), which was used as a protein standard, was purchased from Sigma-Aldrich, Inc. (St. Louis, MO, USA; catalog no. 9048-46-8). Tissue homogenates were produced using an MT-30K handheld homogenizer (Miulab, Hangzhou, Zhejiang, China). LDH activity was measured using a Varioskan Flash spectral scanning multimode reader (Thermo Scientific, Waltham, MA, USA), and lactate and glucose levels were measured using a Spectrophotometer Genesys 10S Vis (Thermo Scientific, Waltham, MA, USA).
Methods
Hypobaric hypoxia rat model
This study was involved an experimental in vivo animal model (male Wistar rats). HH exposure was performed in Lakespra (Indonesian National Air Force Army, Jakarta, Indonesia) and the enzymatic assay was performed in the Laboratory of Biochemistry and Molecular Biology (Faculty of Medicine Universitas, Jakarta, Indonesia). Twenty-five Wistar rats were equally divided into a control and four experimental groups. Rats in the control group were maintained in normobaric conditions (0 m sea level pressure, 760 mmHg; temperature, 25°C; relative humidity, 60%–70%). Rats in the experimental groups were exposed to HH conditions in a hypobaric chamber at 25.000 feet (7620 m above sea level pressure, 282.4 mmHg; temperature; 25°C, relative humidity, 60%–70%) for 5 min with the following frequencies: group 1, one exposure; group 2, two exposures; group 3, three exposures; and group 4, four exposures. Groups 2, 3, and 4 had multiple exposures to HH with a 7-d interval between exposures. After HH exposures, the rats were sacrificed and the livers, muscles, and blood were collected. This study was approved by the Ethical Committee of the Faculty of Medicine Universitas Indonesia (No. KET-906/UN2.F1/ETIK/PPM.00.02/2023).
Homogenate and plasma preparation
One hundred milligrams of tissues (muscle or liver) were weighed and homogenized in 1000 μL of 0.01 M phosphate buffered saline [PBS] (pH 7.4) at 4°C. The homogenate was centrifuged at 2000 × g for 10 min; the supernatant was collected and the pellet was removed. This supernatant was used for measurement of LDH specific activity [20]. Whole blood was collected using EDTA as an anticoagulant. One milliliter of whole blood was centrifuged at 2000 × g for 10 min and the plasma was collected. The plasma was used for measurement of lactate and glucose levels [21].
Measurement of LDH-specific activity in muscle and liver tissues
LDH activity was measured using a lactate dehydrogenase activity assay kit (Elabscience). LDH enzyme in the sample catalyses lactic acid to produce pyruvate, with coenzyme I as a hydrogen carrier. Pyruvate reacts with 2,4-dinitrophenylhydrazine to form pyruvate dinitrophenylhydrazone, which has a red-brown color in alkaline solution. The absorbance of the red-brown color was read at 450 nm using a spectrophotometer. The LDH activity was calculated from the optical density (OD) of samples and the standard [22]. The reaction was conducted based on the manual instruction provided by the manufacturer. The specific activity of LDH was calculated from the LDH activity per total protein level (U/g protein). The total protein level in the sample was measured using a spectrophotometer at a wavelength of 280 nm.
Measurement of the lactate level in plasma
The lactate level in plasma was measured using an L-lactate assay kit (Randox). The L-lactate in the sample was reacted with oxygen catalysed by lactate oxidase, which produced pyruvate and hydrogen peroxide. Then, the hydrogen peroxide was reacted with 4-aminoantipyrine and N-ethyl-N-(2-hydroxy-3-sulphopropyl) m-toluidine catalysed by peroxidase, which resulted in a purple compound and water. The absorbance of the purple color was measured using a spectrophotometer. Ten microliters of a tissue sample or standard solution were mixed with 1000 μL of reagent solution containing lactate oxidase, 4-aminoantipyrine, N-ethyl-N-(2-hydroxy-3-sulphopropyl) m-toluidine, and peroxidase and incubated for 10 min at 25°C. The absorbance was measured at a wavelength of 550 nm [21]. The absorbance of the tissue sample and standard solution was calculated against a reagent blank within 30 min after incubation. The standard concentration of lactate in this kit was 38.20 mg/dL.
Measurement of the glucose level in plasma
The glucose level in plasma was measured using a glucose assay kit (Randox). Glucose was determined by enzymatic oxidation (glucose oxidase). This reaction produces gluconic acid and hydrogen peroxide. The hydrogen peroxide was reacted with 4-aminophenazone and phenol catalysed by peroxidase and forming quinoneimine, a red-violet compound. The red-violet color was measured at a wavelength of 500 nm using a spectrophotometer [23]. Ten microliters of tissue sample or standard solution were mixed with 1000 μL of reagent solution containing glucose oxidase, 4-aminophenazone, phenol, and peroxidase and incubated for 20 min at 25°C. The absorbance of the tissue sample and standard were calculated against the reagent blank within 60 min after incubation. The standard concentration of glucose in this kit was 98.57 mg/dL.
Statistical analysis
All data were obtained in numeric form and before performing the statistical analysis. We needed to determine if the data were normally distributed using the Shapiro-Wilk test. The data had a normal distribution, so the data were analysed using a one-way ANOVA test followed by an LSD test to detect a significant difference between groups. The data are presented as the means ± standard error of the mean (SEM) with a two-sided significant difference considered at a P < 0.05. The statistical analysis was performed using SPSS 26 software.
Results
The specific activity of LDH in rat muscle (Figure 1) was increased in group 1 (1.364 ± 0.177 U/g protein) compared to the control group (1.168 ± 0.121 U/g protein), although the difference was not statistically significant. The specific activity of LDH was significantly decreased in group 2 (0.911 ± 0.130 U/g protein) compared to group 1 (independent t-test, P = 0.020). The specific activity of LDH in groups 3 and 4 were also decreased (1.069 ± 0.122 and 1.086 ± 0.052 U/g protein, respectively) compared to group 1 but the difference was not significant and the values increased approximating the control group.
Figure 1 Specific activity of LDH (U/g protein) in rat muscle tissues after intermittent hypobaric hypoxia (HH) exposure. Control = normoxia, Group 1 = 1× HH, Group 2 = 2× HH, Group 3 = 3× HH, and Group 4 = 4× HH. The data are presented as the mean ± SE. Statistical analysis by one-way ANOVA with a significant difference at *P < 0.05.
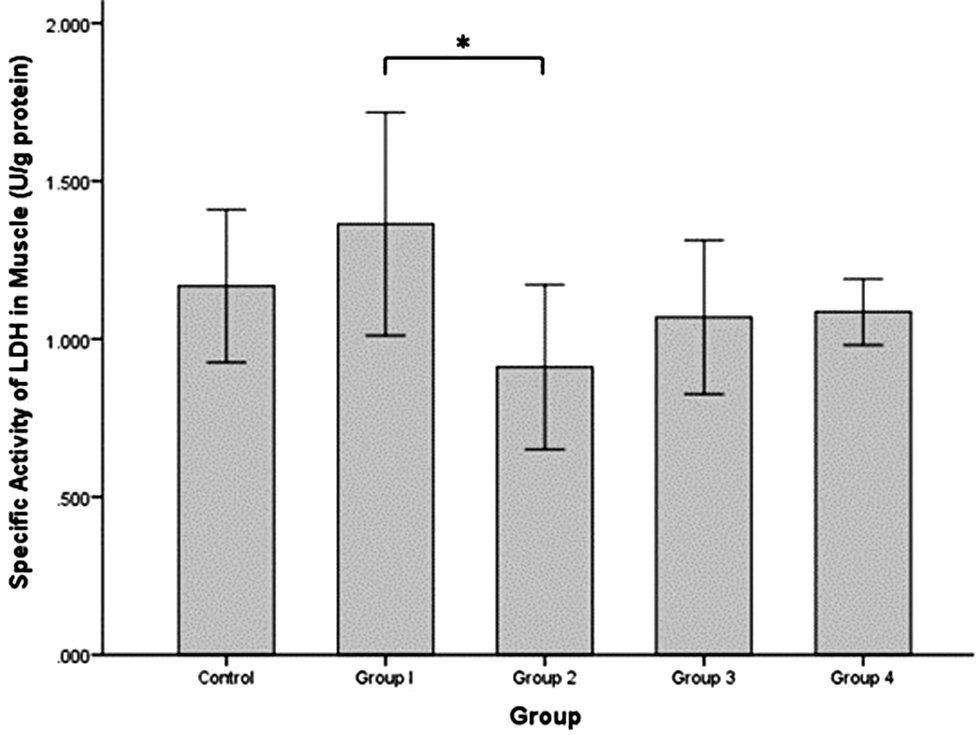
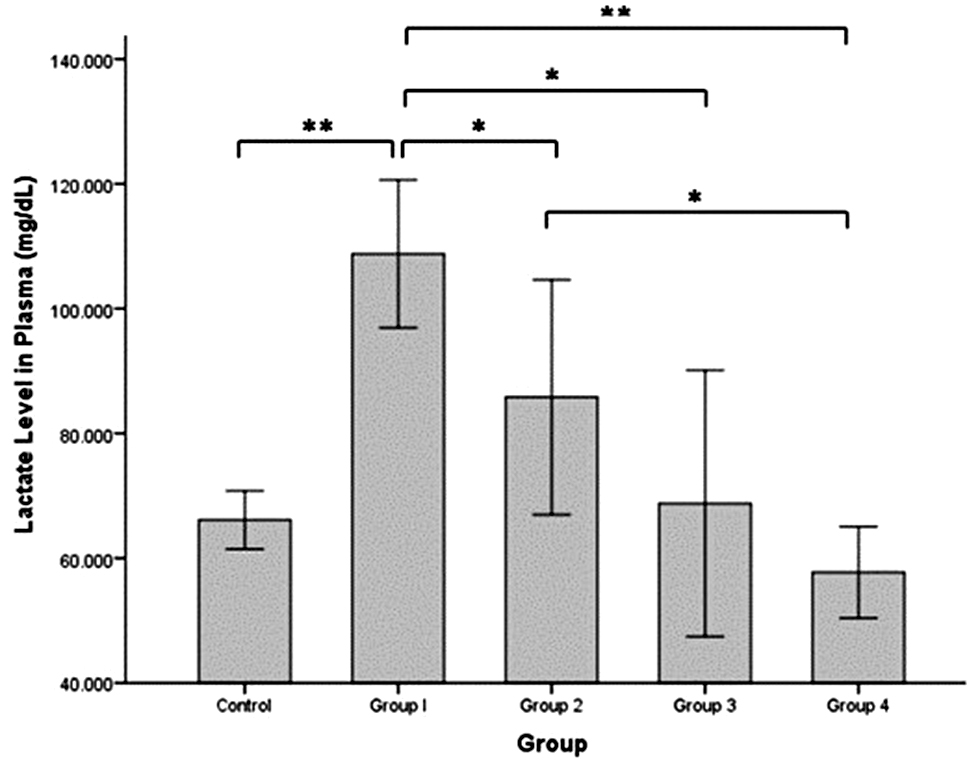
Figure 2 shows the lactate level in plasma, which was significantly increased in group 1 (108.776 ± 5.921 mg/dL) compared to the control group (66.128 ± 2.335 mg/dL; independent t-test, P = 0.000). The lactate level was significantly decreased in groups 2 and 3 (85.815 ± 9.414 and 68.772 ± 10.663 mg/dL, respectively) compared to group 1 (independent t-test, P = 0.035 and P = 0.001, respectively) but the levels were not significantly different compared to the control group. The lowest lactate level was in group 4 (57.732 ± 3.667 mg/dL) and significantly different from the lactate levels in groups 1 and 2 (independent t-test, P = 0.000 and P = 0.012), but not significantly different from the lactate level in the control group.
Figure 2 Lactate level in rat plasma (mg/dL) after intermittent hypobaric hypoxia (HH) exposure. Control = normoxia, Group 1 = 1× HH, Group 2 = 2× HH, Group 3 = 3× HH, and Group 4 = 4× HH. The data are presented as the mean ± SE. Statistical analysis by one-way ANOVA with a significant difference at *P < 0.05 and ** P < 0.001.
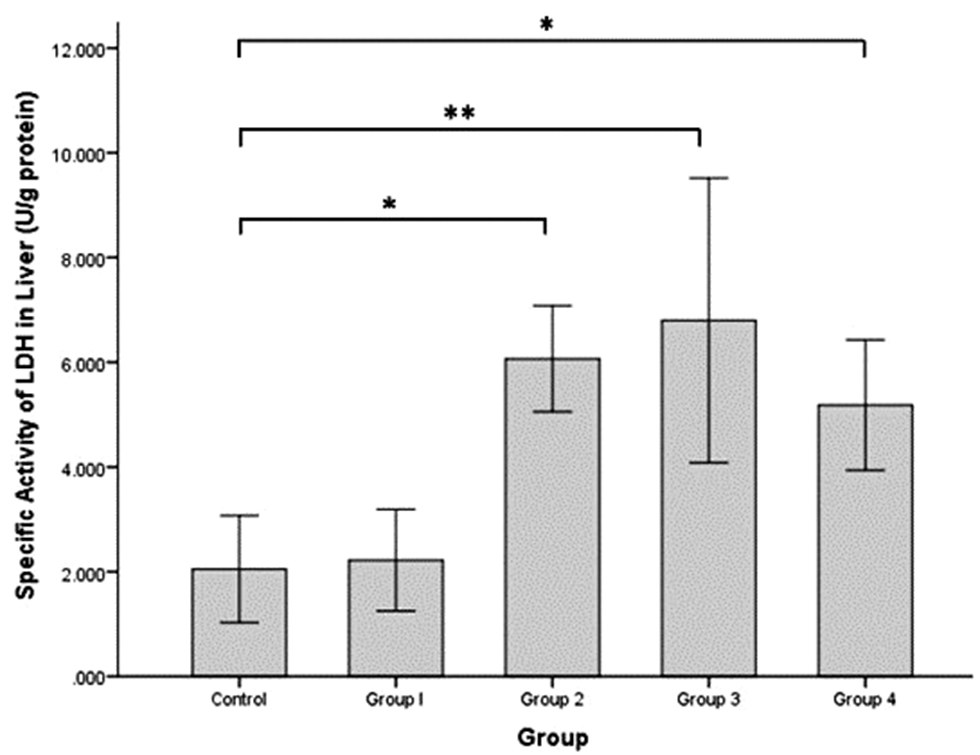
The specific activity of LDH in rat liver (Figure 3) was increased slightly in group 1 (2.221 ± 0.485 U/g protein) compared to the control group (2.050 ± 0.513 U/g protein). The specific activity of LDH in rat liver was significantly increased in groups 2, 3, and 4 (6.069 ± 0.506, 6.798 ± 1.360, and 5.182 ± 0.623 U/g protein, respectively) compared to the control group (independent t-test, P = 0.002, P = 0.000, and P = 0.010, respectively).
Figure 3 Specific activity of LDH enzyme (U/g protein) in rat liver tissues after intermittent hypobaric hypoxia (HH) exposures. Control = normoxia, Group 1 = 1× HH, Group 2 = 2× HH, Group 3 = 3× HH, and Group 4 = 4× HH. The data are presented as the mean ± SE. Statistical analysis by one-way ANOVA with a significant difference at *P < 0.05 and **P < 0.001.
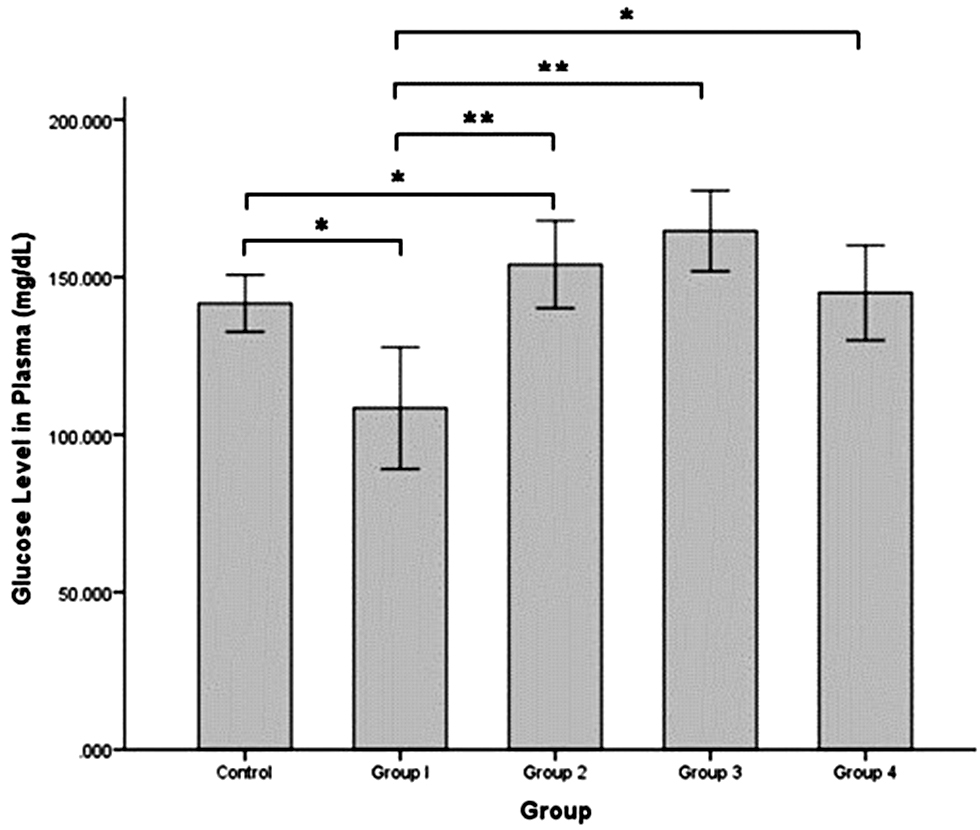
The glucose level in blood plasma (Figure 4) was significantly decreased in group 1 (108.405 ± 9.675 mg/dL) compared to the control group (141.659 ± 4.531 mg/dL; independent t-test, P = 0.004). The glucose level was significantly increased in group 2 (154.007 ± 6.939 mg/dL) compared to group 1 (independent t-test, P = 0.000) but was not significantly different compared to the control group. The glucose level was highest in group 3 (164.680 ± 6.412 mg/dL) and significantly different compared to the control group and group 1 (independent t-test, P = 0.035 and P = 0.000, respectively). The glucose level began to decrease in group 4 (145.010 ± 7.554 mg/dL) approximately the glucose level in the control group.
Figure 4 Glucose level in rat plasma (mg/dL) after intermittent hypobaric hypoxia (HH) exposure. Control = normoxia, Group 1 = 1× HH, Group 2 = 2× HH, Group 3 = 3× HH, and Group 4 = 4× HH. The data are presented as the mean ± SE. Statistical analysis by one-way ANOVA with a significant difference at *P < 0.05 and **P < 0.001.
Discussion
The specific activity of LDH in muscle was increased in the group with a single exposure to HH, which indicated that anaerobic glycolysis was induced in muscle tissues. This result was supported by the increased plasma lactate level in group 1. A low level of oxygen induces activation of transcription factor HIF-1α, which has a central role in regulating several genes involved in the homeostasis mechanism under hypoxic conditions [5]. One of the metabolic changes in hypoxia is activation of anaerobic glycolysis through stimulation of LDH, which catalyses the conversion of pyruvic acid into lactate. A previous study reported that lactate accumulates during hypoxia, which is promoted by LDH activation and is induced by HIF-1α activation, which has a critical role in metabolic adaptation under hypoxic conditions [24].
The non-significant increase in LDH activity in group 1 rat muscle may be caused by rats that were not treated by exercise/training. Without exercise treatment of muscle, the energy requirement is not high and the LDH activity is only slight increased. The LDH activity can be influenced by several factors, especially physical training [25]. In addition, the type of muscle fiber, which determines the type of muscle metabolism, was not identified in the current study. There are 2 types of skeletal muscle fibers (type 1, slow-twitch muscle fibers that that undergo aerobic metabolism and produce a lot of energy; and type 2, fast- twitch muscle fibers that undergo anaerobic metabolism and have a role under hypoxic conditions [26].
The specific activity of LDH in muscle tissues was decreased compared to the control and single HH exposure groups. This finding was supported by the decreased lactate level in plasma. Intermittent exposure to HH will induce an adaptation mechanism in muscle toward hypoxic conditions. A previous study revealed that intermittent treatment of hypoxia, such as by training programs, transient altitude exposures, or in diseases (obstructive sleep apnea) lead to decreased LDH and phosphofructokinase (PFK) activity in muscle tissue [27]. Another study reported that the muscular and performance adaptations between normoxic and hypoxic high-intensity interval training were quite similar, but hypoxic training will stimulate adaptations in isometric strength and muscle perfusion [28].
The specific activity of LDH in liver tissues was not increased after a single HH exposure but was increased after two exposures. The highest LDH activity occurred in rats with three HH exposures, then decreased after four HH exposures. The liver occupies a unique anatomic and functional niche within the body and contributes to the oxygen homeostasis mechanism [7]. The hepatic lobule has a physiologic oxygen gradient because oxygen-rich blood mixes with oxygen-poor blood. The oxygen gradient in the hepatic lobule has been reported to have an oxygen tension of 60–65 mmHg in the periportal blood, which decreases to 30–35 mmHg in the perivenous distribution of the liver parenchyma. By comparison, the physiologic arterial oxygen concentration in most other body tissues is 74–104 mmHg and the venous oxygen concentration is 34–46 mmHg [29]. Under these conditions, the liver parenchyma tissue becomes relatively hypoxic compared to other body sites. Another study reported that HIF-1α expression was increased following intermittent hypoxia exposure in HepG2 cells but not significantly activated by chronic hypoxia [30]. Based on this result we assumed that the hepatocyte response increases after intermittent hypoxia exposure. Therefore, the LDH-specific activity in the liver was not significantly increased in group 1 because the tissue was relatively hypoxic and required intermittent HH exposure to increase the response.
According to this study the function of LDH in liver tissues is not responsible for anaerobic glycolysis pathway activation but has a role in the conversion of lactic acid to pyruvate in which this reaction contributes to the gluconeogenesis pathway. The reaction catalysed by the LDH enzyme is reversible. The increase in hepatic LDH specific activity in groups 2 and 3 was probably due to the increase in plasma lactate levels, so hepatic LDH converts lactate into pyruvate, then continues with activation of the gluconeogenesis pathway in the liver. This finding was confirmed by another study that showed an increase in phosphoenolpyruvate carboxy kinase expression (PEPCK) in renal tissues after hypoxia exposure induced by HIF-1α [31, 32].
This evidence is supported by the consistent results of blood glucose levels shown in the current study. The glucose levels decreased in group 1 (single HH exposure), which indicated large use of glucose by peripheral tissues, but gluconeogenesis in the liver was not stimulated, as indicated by the LDH activity, which was not increased. The glucose levels increased in groups 2 and 3, in which the LDH activity in the liver was also increased. Then, the glucose levels decreased slightly in group 4 in accordance with the liver LDH activity, which also decreased slightly compared to group 3. The liver has an important role for blood glucose homeostasis. The gluconeogenesis pathway in the liver will be accelerated to maintain the blood glucose level. Glucose use by peripheral tissues is increased under hypoxic conditions. A previous study reported that hypoxia exposure increases glucose uptake via an AMPK-dependent mechanism in human myotubes [skeletal muscle] [33]. The large use of glucose in hypoxia is also indicated by the increase in glycogenolysis and decrease in the hepatic glycogen level [9]. This assumption is also supported by the blood glucose level elevation after intermittent HH in the current study.
The results of this study revealed that metabolic changes occur, especially in the liver and muscles, after intermittent exposure to HH. The liver acts more as a supplier of blood glucose under hypoxic conditions, while the muscle uses glucose as an energy source and produces lactate under hypoxic conditions. High activity of LDH occurs in several diseases, especially diseases related to hypoxia, such as cardiovascular disease and severe COVID-19 [34–36]. These results can be applied in studying the physiologic changes of the body when exposed to repeated hypoxic conditions, such as occurs in mountain climbers, fighter pilots, and miners. In addition, these results revealed the pathogenic mechanisms underlying diseases related to hypoxic conditions, such as coronary heart disease, stroke, obstructive sleep apnea, and lung disease.
Conclusion
We conclude that LDH has different roles in muscle and liver tissues, especially under intermittent HH conditions. The LDH in muscle tissue contributes to lactate plasma levels after intermittent HH exposure because of anaerobic glycolysis activation. However, LDH in liver tissues contributes to maintaining glucose plasma levels through gluconeogenesis stimulation after intermittent HH exposure. These findings offer insight into metabolic adaptations to hypoxia with potential implications for understanding conditions, such as high-altitude adaptation and hypoxia-related diseases.
Funding
This study was funded by the Hibah Publikasi Terindeks International (PUTI) Pascasarjana 2023 (No. NKB-153/UN2.RST/HKP.05.00/2023) from the Directorate of Research and Community Services Universitas Indonesia.
Conflict of interest
The authors declare that there are no conflicts of interest regarding the publication of this manuscript.
References
- Viscor G, Torrella JR, Corral L, Ricart A, Javierre C, et al. Physiological and biological responses to short-term intermittent hypobaric hypoxia exposure: from sports and mountain medicine to new biomedical applications. Front Physiol 2018;9:814. [PMID: 30038574 DOI: 10.3389/fphys.2018.00814]
- Rosales AM, Shute RJ, Hailes WS, Collins CW, Ruby BC, et al. Independent effects of acute normobaric hypoxia and hypobaric hypoxia on human physiology. Sci Rep 2022;12(1):19570. [PMID: 36379983 DOI: 10.1038/s41598-022-23698-5]
- Shaw DM, Cabre G, Gant N. Hypoxic hypoxia and brain function in military aviation: basic physiology and applied perspectives. Front Physiol 2021;12:665821. [PMID: 34093227 DOI: 10.3389/fphys.2021.665821]
- Lee P, Chandel NS, Simon MC. Cellular adaptation to hypoxia through hypoxia inducible factors and beyond. Nat Rev Mol Cell Biol 2020;21(5):268-83. [PMID: 32144406 DOI: 10.1038/s41580-020-0227-y]
- Lee DC, Sohn HA, Park Z-Y, Oh S, Kang YK, et al. A lactate-induced response to hypoxia. Cell 2015;161(3):595-609. [PMID: 25892225 DOI: 10.1016/j.cell.2015.03.011]
- Koziel A, Jarmuszkiewicz W. Hypoxia and aerobic metabolism adaptations of human endothelial cells. Pflügers Arch 2017;469(5-6):815-27. [PMID: 28176017 DOI: 10.1007/s00424-017-1935-9]
- Nath B, Szabo G. Hypoxia and hypoxia inducible factors: diverse roles in liver diseases. Hepatology 2012;55(2):622-33. [PMID: 22120903 DOI: 10.1002/hep.25497]
- Chaillou T. Skeletal muscle fiber type in hypoxia: adaptation to high-altitude exposure and under conditions of pathological hypoxia. Front Physiol 2018;9:1450. [PMID: 30369887 DOI: 10.3389/fphys.2018.01450]
- Hara Y, Watanabe N. Changes in expression of genes related to glucose metabolism in liver and skeletal muscle of rats exposed to acute hypoxia. Heliyon 2020;6(7):e04334. [PMID: 32642586 DOI: 10.1016/j.heliyon.2020.e04334]
- Van Thienen R, Masschelein E, D’Hulst G, Thomis M, Hespel P. Twin resemblance in muscle HIF-1α responses to hypoxia and exercise. Front Physiol 2017;7:676. [PMID: 28149279 DOI: 10.3389/fphys.2016.00676]
- Chu Q, Gu X, Zheng Q, Zhu H. Regulatory mechanism of HIF-1α and its role in liver diseases: a narrative review. Ann Transl Med 2022;10(2):109. [PMID: 35282052 DOI: 10.21037/atm-21-4222]
- Taylor CT, Scholz CC. The effect of HIF on metabolism and immunity. Nat Rev Nephrol 2022;18(9):573-87. [PMID: 35726016 DOI: 10.1038/s41581-022-00587-8]
- Wenger RH, Stiehl DP, Camenisch G. Integration of oxygen signaling at the consensus HRE. Sci STKE 2005;2005(306):re12. [PMID: 16234508 DOI: 10.1126/stke.3062005re12]
- Klein R, Nagy O, Tóthová C, Chovanová F. Clinical and diagnostic significance of lactate dehydrogenase and its isoenzymes in animals. Vet Med Int 2020;2020:5346483. [PMID: 32607139 DOI: 10.1155/2020/5346483]
- Adeva-Andany M, López-Ojén M, Funcasta-Calderón R, Ameneiros-Rodríguez E, Donapetry-García C, et al. Comprehensive review on lactate metabolism in human health. Mitochondrion 2014;17:76-100. [PMID: 24929216 DOI: 10.1016/j.mito.2014.05.007]
- Le Moine CMR, Morash AJ, McClelland GB. Changes in HIF-1α protein, pyruvate dehydrogenase phosphorylation, and activity with exercise in acute and chronic hypoxia. Am J Physiol Integr Comp Physiol 2011;301(4):R1098-104. [PMID: 21775648 DOI: 10.1152/ajpregu.00070.2011]
- Cui X-G, Han Z-T, He S-H, Wu X, Chen T-R, et al. HIF1/2α mediates hypoxia-induced LDHA expression in human pancreatic cancer cells. Oncotarget 2017;8(15):24840-52. [PMID: 28193910 DOI: 10.18632/oncotarget.15266]
- Parlakgül G, Arruda AP, Pang S, Cagampan E, Min N, et al. Regulation of liver subcellular architecture controls metabolic homeostasis. Nature 2022;603(7902):736-42. [PMID: 35264794 DOI: 10.1038/s41586-022-04488-5]
- Yui J, Okano S, Nishizawa H. Relationship between skeletal muscle mass and blood lactate level reduction after short squat jumps in healthy adult non-athletes. J Phys Ther Sci 2021;33(10):717-21. [PMID: 34658512 DOI: 10.1589/jpts.33.717]
- Fresnedo O, Abad-Garcia B, Rueda Y. Tri-reagent homogenate is a suitable starting material for UHPLC-MS lipidomic analysis. Separations 2022;9(10):268. [DOI: 10.3390/separations9100268]
- Sari D, Endardjo S, Irawati D. Blood lactate level in Wistar rats after four and twelve week intermittent aerobic training. Med J Indones 2013;22:141. [DOI: 10.13181/mji.v22i3.582]
- Dewi S, Triatmono VR, Rasyada Ralas PR, Veraldi V, M Alfian I, et al. Increasing of LDH specific activity and PEPCK level play a role on activation of gluconeogenesis pathway in early onset pre-eeclampsia placenta. Rep Biochem Mol Biol 2022;11(2):320-6. [PMID: 36164619 DOI: 10.52547/rbmb.11.2.320]
- Dickson LM, Buchmann EJ, Janse Van Rensburg C, Norris SA. The impact of differences in plasma glucose between glucose oxidase and hexokinase methods on estimated gestational diabetes mellitus prevalence. Sci Rep 2019;9(1):7238. [PMID: 31076622 DOI: 10.1038/s41598-019-43665-x]
- Cassavaugh J, Lounsbury KM. Hypoxia-mediated biological control. J Cell Biochem 2011;112(3):735-44. [PMID: 21328446 DOI: 10.1002/jcb.22956]
- Tokinoya K, Ishikura K, Yoshida Y, Ra S-G, Sugasawa T, et al. LDH isoenzyme 5 is an index of early onset muscle soreness during prolonged running. J Sports Med Phys Fitness 2020;60(7):1020-6. [PMID: 32253893 DOI: 10.23736/S0022-4707.20.10278-0]
- Plotkin DL, Roberts MD, Haun CT, Schoenfeld BJ. Muscle fiber type transitions with exercise training: shifting perspectives. Sports 2021;9(9):127. [PMID: 34564332 DOI: 10.3390/sports9090127]
- Clanton TL, Klawitter PF. Invited review: adaptive responses of skeletal muscle to intermittent hypoxia: the known and the unknown. J Appl Physiol 2001;90(6):2476-87. [PMID: 11356816 DOI: 10.1152/jappl.2001.90.6.2476]
- De Smet S, van Herpt P, D’Hulst G, Van Thienen R, Van Leemputte M, et al. Physiological adaptations to hypoxic vs. normoxic training during intermittent living high. Front Physiol 2017;8:347. [PMID: 28620311 DOI: 10.3389/fphys.2017.00347]
- Jungermann K, Kietzmann T. Oxygen: modulator of metabolic zonation and disease of the liver. Hepatology 2000;31(2):255-60. [PMID: 10655244 DOI: 10.1002/hep.510310201]
- Minoves M, Hazane-Puch F, Moriondo G, Boutin-Paradis A, Lemarié E, et al. Differential impact of intermittent vs. sustained hypoxia on HIF-1, VEGF and proliferation of HepG2 Cells. Int J Mol Sci 2023;24(8):6875. [PMID: 37108039 DOI: 10.3390/ijms24086875]
- Owczarek A, Gieczewska K, Jarzyna R, Jagielski AK, Kiersztan A, et al. Hypoxia increases the rate of renal gluconeogenesis via hypoxia-inducible factor-1-dependent activation of phosphoenolpyruvate carboxykinase expression. Biochimie 2020;171-172:31-7. [PMID: 32045650 DOI: 10.1016/j.biochi.2020.02.002]
- Vora M, Pyonteck SM, Popovitchenko T, Matlack TL, Prashar A, et al. The hypoxia response pathway promotes PEP carboxykinase and gluconeogenesis in C. elegans. Nat Commun 2022;13(1):6168. [PMID: 36257965 DOI: 10.1038/s41467-022-33849-x]
- Van Meijel RLJ, Vogel MAA, Jocken JWE, Vliex LMM, Smeets JSJ, et al. Mild intermittent hypoxia exposure induces metabolic and molecular adaptations in men with obesity. Mol Metab 2021;53:101287. [PMID: 34224918 DOI: 10.1016/j.molmet.2021.101287]
- Zhu W, Ma Y, Guo W, Lu J, Li X, et al. Serum level of lactate dehydrogenase is associated with cardiovascular disease risk as determined by the Framingham Risk Score and arterial stiffness in a health-examined population in China. Int J Gen Med 2022;15:11-7. [PMID: 35018110 DOI: 10.2147/IJGM.S337517]
- Mohammed SK, Taha MM, Taha EM. Cluster analysis of biochemical markers as predictor of COVID-19 severity. Baghdad Sci J 2022;19(6(Suppl.) SE-article):1423. [DOI: 10.21123/bsj.2022.7454]
- Gupta GS. The lactate and the lactate dehydrogenase in inflammatory diseases and major risk factors in COVID-19 patients. Inflammation 2022;45(6):2091-123. [PMID: 35588340 DOI: 10.1007/s10753-022-01680-7]