Rutin and Glimepiride Combination: A Novel Approach for Managing Diabetes Nephropathy in Streptozotocin Induced Diabetes in Wistar Rats
1Professor, Department of Pharmacology, KBHSS Trust’s Institute of Pharmacy, Malegaon, Dist. Nashik, Maharashtra, India
2Research scholar, Department of Pharmacology, KBHSS Trust’s Institute of Pharmacy, Malegaon, Dist. Nashik, Maharashtra, India
3Associate Professor, Department of Pharmacology, KBHSS Trust’s Institute of Pharmacy, Malegaon, Dist. Nashik, Maharashtra, India
*Correspondence to: Yogesh S. Ahire Associate Professor, Department of Pharmacology, KBHSS Trust’s Institute of Pharmacy, Malegaon, Dist. Nashik, Maharashtra, India, E-mail: yogesh.ahire2411@gmail.com
Received: June 17 2024; Revised: July 23 2024; Accepted: September 2 2024; Published Online: November 29 2024.
Cite this paper:
Bairagi VA, Jagtap SD, Jadhav SB et al. Rutin and Glimepiride Combination: A Novel Approach for Managing Diabetes Nephropathy in Streptozotocin Induced Diabetes in Wistar Rats. BIO Integration 2024; 5: 1–12.
DOI: 10.15212/bioi-2024-0037. Available at: https://bio-integration.org/
Download citation
© 2024 The Authors. This is an open access article distributed under the terms of the Creative Commons Attribution License (https://creativecommons.org/licenses/by/4.0/). See https://bio-integration.org/copyright-and-permissions/
Abstract
Background: Diabetes mellitus remains a global health concern, because of its associated complications, including diabetic nephropathy. Glimepiride, a sulfonylurea derivative, and rutin, a flavonoid with antioxidant properties, have shown potential in managing diabetic complications. This study was aimed at investigating the therapeutic efficacy of these treatments, individually or in combination, against streptozotocin (STZ)-induced diabetic complications in albino rats (Rattus norvegicus).
Methods: Diabetes was induced by intraperitoneal injection of STZ at 55 mg/kg in Wistar rats of both sexes weighing 200–250 g. Rats with serum glucose (Glu) levels ≥250 mg/dL were selected for pharmacological assessment. The diabetic rats were divided into six groups, each comprising six rats, receiving the following treatments: GLP alone at 0.5 mg/kg, rutin alone at 50 mg/kg or 100 mg/kg, and combinations of GLP with rutin. Treatments were administered over 45 days. Physiological parameters, serum markers (including Glu and lipid profiles), inflammatory cytokines, renal hypertrophy, oxidative stress markers, and histopathological changes in kidney tissues were evaluated to assess treatment effects.
Result: Significant improvements were observed in rats treated with GLP, rutin, or both, including decreased diabetes-induced weight loss, and increased glycemic control with lower serum Glu levels. Favorable changes in lipid profiles and significant decreases in inflammatory cytokines indicated systemic improvements. Moreover, the treatments markedly decreased renal hypertrophy, thus suggesting enhanced renal function. Histopathological analysis indicated that combination therapy, compared with individual treatments, markedly decreased tubular dilation and preserved renal architecture, thus highlighting synergistic benefits in managing diabetic complications, particularly diabetic nephropathy.
Conclusion: Our findings suggest that GLP and rutin, individually or in combination, hold promise in managing diabetic nephropathy, according to an STZ-induced diabetic rat model. The combination therapy demonstrated synergistic benefits, particularly in preserving renal architecture and decreasing tubular dilation. These results highlight a potential therapeutic strategy for alleviating diabetes-induced renal complications, and emphasize the importance of exploring combined approaches in diabetic management to enhance treatment efficacy and patient outcomes.
Keywords
Diabetic nephropathy, glimepiride, histopathology, inflammatory cytokines, oxidative stress, rats, renal hypertrophy, rutin, streptozotocin, synergistic effects.
Introduction
Diabetes mellitus (DM) is a condition in which high blood glucose results from inadequate insulin levels or resistance to insulin’s effects. This condition affects 537 million people 20–79 years of age globally, and is projected to affect 643 million people by 2030 and 784 million people by 2045, according to the International Diabetes Federation [1]. This metabolic imbalance results in cellular damage, protein glycosylation, disrupted signaling, and inflammatory responses, particularly affecting pancreatic beta cells. Consequently, disrupted metabolism of carbohydrates, lipids, and proteins leads to progressive organ damage, notably in the retina, kidneys, and peripheral nerves [2, 3].
Diabetic nephropathy (DN), a consequence of prolonged diabetes, manifests as a kidney disorder. DN involves impairment of the small blood vessels responsible for filtering waste from the bloodstream in the kidneys. Persistent high blood glucose causes kidney damage; consequently, DN is a major complication of chronic diabetes that significantly affects morbidity and mortality [4–7]. DN involves disrupted molecular signaling and alterations in biomarkers such as inflammatory cytokines, oxidative stress indicators, and renin-angiotensin system components [8, 9].
DN, now known as diabetic kidney disease, has emerged as a prevalent and significant complication in DM [10]. DN presents a distinctive glomerular disease which is the indicative of albuminuria that causes the decline in renal function. The albuminuria is a primary reason for end-stage kidney disease in various populations, affecting approximately 20% to 50% of individuals with diabetes [11, 12]. DN is currently a leading cause of end-stage kidney disease. Nonetheless, understanding of the molecular pathways driving its development remains incomplete. Diabetes-related nephropathy is associated with a range of hemodynamic and metabolic conditions, including obesity, hypertension, hyperglycemia, hyperinsulinemia, and hyperlipidemia [13].
Rutin, a flavonoid glycoside, has become a focus of pharmaceutical studies, because of its distinctive pharmacological attributes. Naturally occurring in various fruits, vegetables, and plant-derived beverages, rutin, chemically identified as quercetin-3-O-rutinoside, is sourced primarily from plants including Ruta graveolens L. (Rutaceae), Sophora japonica L. (Fabaceae), and Maranta leuconeura E. (Marantaceae) [14, 15]. The presence of rutin in many plants has sparked interest in its potential health benefits. Studies before 2021 indicated that rutin’s antioxidant properties might potentially mitigate inflammation in the body. Given the association of chronic inflammation with various diseases, including diabetes, rutin might contribute to overall health by decreasing inflammation [16].
Current drugs for diabetes have limitations, including variable responses among individuals, challenges in achieving glycemic control, and potential adverse effects. Thus, more effective therapeutic strategies must be explored for patients with diabetes [17, 18]. Monotherapy alone might not adequately manage blood Glu levels in patients [19, 20]. Combining therapies can significantly improve clinical outcomes through the management of blood Glu, weight, and blood pressure, while also decreasing damage from complications and slowing diabetes progression [21, 22]. Rutin exhibits a wide range of activities, including antidiabetic, antioxidant, anti-inflammatory, nephroprotective, neuroprotective, cardioprotective, and anti-hypertensive effects, and has been found to improve metabolic function [23–27].
Glimepiride (GLP), a medium-to-long acting third generation sulfonylurea, stimulates insulin production by pancreatic beta cells, thereby enhancing glycemic regulation in type 2 DM treatment and improving intracellular insulin receptor responsiveness [28]. GLP exhibits anti-diabetic, anti-inflammatory, and neuroprotective properties [29–32].
Rutin was selected for this study because of its antioxidant and anti-inflammatory effects, which can counteract diabetic complications by mitigating the oxidative stress and inflammation associated with DN. Rutin was used in combination with GLP to explore potential synergistic effects that might enhance therapeutic outcomes. The doses of GLP (0.5 mg/kg) and rutin (50 mg/kg or 100 mg/kg) were chosen according to prior research and preliminary data, to ensure effective glycemic control with minimal adverse effects of GLP.
The potential therapeutic synergy between GLP and rutin in treating DN had not previously been investigated. Therefore, we sought to explore the effects of this combination therapy in treating DN in streptozotocin (STZ)-induced diabetic rats.
Materials and methods
Materials
STZ and rutin were obtained from Ottochemie Laboratories, Mumbai, India, whereas GLP was obtained from Balaji Chemicals, Surat, India. The biochemical estimation kits used in the study were sourced from Meril Diagnostic Pvt. Ltd., India. These substances were kept at 2–4°C and shielded from direct sunlight. All other drugs and chemicals were of analytical grade and were obtained from Sigma-Aldrich, India.
Methods
Experimental animals
Wistar rats (Rattus norvegicus) of both sexes, weighing approximately 200–250 g, were obtained from Lacsmi Bioform Pvt. Ltd., Pune 411027. They were housed in standard polypropylene cages under controlled conditions, as follows: room temperature at 22°C±2°C, humidity at 55±5%, and a 12-hour light-dark cycle. The rats were given a standard diet and unlimited access to water. Animal care and use complied with CPCSEA guidelines, and the study protocol was approved by the Institutional Animal Ethics Committee of K.B.H.S.S. Institute of Pharmacy Malegaon (registration no. 1566/PO/Re/S/11/CPCSEA, dated 23/12/2011; CPCSEA No. 1277).
Induction of diabetes in rats
Fasted rats were injected intraperitoneally (i.p.) with 55 mg/kg body weight (BW) STZ dissolved in chilled citrate buffer (pH 4.5) [33]. A single i.p. injection of STZ (55 mg/kg) was administered to the experimental animals. Glucose levels were then verified, and animals with confirmed diabetes animals were fed normal food and water for 4 weeks (28 days) to allow for DN development. Subsequently, treatment was started for 45 days for each group wise, as described in the Materials and methods. Seventy-two hours later, blood Glu levels were measured. Blood samples were collected from the lateral tail vein, coagulated, and centrifuged. Serum Glu concentrations were measured with a Dr. Morepen glucometer. Rats with serum Glu levels of 250 mg/dL or higher were classified as diabetic and included in further pharmacological studies. The rats were maintained on their regular diets throughout the study.
Experimental design
The first group consisted of normal rats. Diabetic rats with serum Glu levels ≥250 mg/dL were divided into six groups, denoted groups 2–7, with six rats per group (n=6).
Group 1 was the control (NC) group, in which rats were orally administered 1% Na CMC for 45 days.
Group 2 was the diabetic control (DC) group, in which rats were orally administered 1% Na CMC for 45 days.
Group 3 received GLP at a dose of 0.5 mg/kg orally in 1% Na CMC for 45 days.
Group 4 received rutin (RUT-1) at a dose of 50 mg/kg orally in 1% Na CMC for 45 days.
Group 5 received rutin (RUT-2) at a dose of 100 mg/kg orally in 1% Na CMC for 45 days.
Group 6 received a combination of GLP (0.5 mg/kg) and a low dose of rutin (50 mg/kg) (GR-1) orally in 1% Na CMC for 45 days.
Group 7 received a combination of GLP (0.5 mg/kg) and a high dose of rutin (100 mg/kg) (GR-2) orally in 1% Na CMC for 45 days [34–36].
The dosages and intervention times for GLP and rutin were determined on the basis of established protocols and previous literature. For GLP, a dose of 0.5 mg/kg was used, in alignment with the standard dosing regimens for diabetic rat models, to achieve effective therapeutic levels without causing excessive adverse effects. Rutin was tested at two doses, 50 mg/kg (RUT-1) and 100 mg/kg (RUT-2), to evaluate dose-dependent effects and optimize therapeutic outcomes. The intervention duration of 45 days was selected to provide a sufficient period for assessing chronic treatment effects on diabetes-related parameters, and allowing for comprehensive evaluation of therapeutic efficacy and safety.
Physiological parameters
Each rat’s BW was recorded before treatment began and on the final day of the study.
Serum parameters
On the 45th day, blood samples were collected from the retro-orbital plexus, coagulated, and centrifuged to obtain the serum. Kidney function markers (blood urea nitrogen, serum albumin, and serum creatinine), lipid levels (serum triglycerides, total cholesterol, LDL, and HDL), HbA1c, and total protein were analyzed with Meril diagnostics kits. Inflammatory cytokines (TNF-α, IL-1β, and IL-6) were measured with a commercial ELISA kit according to the manufacturer’s instructions [36].
Renal hypertrophy and organ collection
After the investigations concluded, animals were euthanized with an overdose of isoflurane. The kidneys were then extracted and rinsed with cold saline. The kidneys were subsequently weighed, and the kidney-to-BW ratio was calculated to assess renal hypertrophy [37]. One kidney from each animal was promptly fixed in 10% neutral buffered formalin for histopathological inspection, and the other kidney was subjected to tissue homogenization for biochemical analyses.
Measurement of antioxidant markers in kidney homogenates
For preparation of tissue homogenates, isolated kidneys were sliced into small pieces while submerged in chilled sucrose solution (0.25 M). The pieces were then homogenized in 10% w/v Tris hydrochloride buffer (10 mM, pH 7.4). The homogenate was centrifuged at 10,000 rpm for 15 minutes at 0°C with a Remi-8plus centrifuge. The supernatant was used for assessment of oxidative stress biomarkers and other inflammatory markers. Oxidative markers including lipid peroxidation (LPO), glutathione (GSH), Na+/K+ ATPase activity, nitric oxide (NO) levels, and inorganic phosphorus (Pi) were determined from kidney homogenate according to previously described protocols [38–40].
Tissue parameter assessment
Lipid peroxidation assays
LPO was measured with the method described by Slater and Sawyer (1971). Thiobarbituric acid (0.67% w/v) was prepared by dissolving 0.67 g in 50 mL hot distilled water and adjusting the volume to 100 mL. Trichloroacetic acid (10% w/v) was prepared by dissolving 10 g in 60 mL distilled water and adjusting the volume to 100 mL. A standard malondialdehyde solution (50 mM) was prepared from 1,1,3,3-tetraethoxypropane, diluted to create a working standard (23 ng/mL). For the assay, 2 mL tissue homogenate was mixed with 2 mL 10% TCA and incubated in an ice bath for 15 minutes. After centrifugation, 2 mL clear supernatant was combined with 2 mL thiobarbituric acid, heated in a boiling water bath for 10 minutes, and cooled in an ice bath. The color was measured at 532 nm against a reagent blank, and the results are expressed as nmol MDA/mg tissue.
Reduced glutathione assays
Reduced GSH was determined with the method by Moron et al. [39]. A 20% w/v trichloroacetic acid solution was prepared by dissolving 20 g in distilled water to a final volume of 100 mL. Phosphate buffer (0.2 M, pH 8.0) was prepared by dissolving 30.2 g sodium phosphate in 600 mL distilled water, adjusting the pH to 8.0 with sodium hydroxide, and adjusting the volume to 1000 mL. DTNB reagent (0.6 mM) was prepared by dissolving 60 mg in 50 mL buffer and adjusting the volume to 100 mL. Standard GSH solution was prepared by dissolving 10 mg in 60 mL distilled water and adjusting the volume to 100 mL. Tissue homogenate was mixed with 20% TCA and centrifuged, and 0.25 mL supernatant was reacted with 2 mL DTNB reagent and 3 mL phosphate buffer. The color developed was read at 412 nm against a reagent blank and expressed as μg GSH/mg protein.
Nitric oxide assays
NO levels were estimated with the method of Guevara (1998). Griess reagent was prepared by mixing sulfanilamide (1% w/v), naphthylethylenediamine dihydrochloride (0.1% w/v), and ortho-phosphoric acid (2.5% v/v). To 1 mL tissue homogenate, 1 mL Griess reagent was added and incubated at 37°C for 15 minutes. Absorbance was read at 540 nm against a Griess reagent blank, with sodium nitrite solution as the standard.
Membrane bound ATPase assays
Sodium-potassium dependent adenosine triphosphatase (Na+/K+ ATPase) was assayed with the method of Bonting (1970). Tris hydrochloride buffer (92 mM, pH 7.5) was prepared by dissolving 11.13 g of Tris in 900 mL distilled water, adjusting the pH to 7.5 with hydrochloric acid, and adjusting the volume to 1000 mL. Magnesium sulfate (5 mM), potassium chloride (5 mM), sodium chloride (60 mM), and EDTA (0.1 mM) solutions were prepared accordingly. ATP solution (40 mM) was prepared by dissolving 0.220 g in 4 mL distilled water and adjusting the volume to 10 mL. In a test tube with 0.2 mL homogenate; 1 mL Tris buffer; and 0.2 mL each of magnesium sulfate, sodium chloride, potassium chloride, EDTA, and ATP were added. The mixture was incubated at 36°C for 15 minutes, and the reaction was stopped with 1 mL 10% TCA. After centrifugation, the phosphorus content in the supernatant was estimated as described for the determination of Pi.
Inorganic phosphorus determination
Pi was estimated according to a method using ammonium molybdate reagent (2.5% w/v) and 1-amino-2-naphthol-4-sulfonic acid (ANSA) reagent. Ammonium molybdate reagent was prepared by dissolving 2.5 g in 100 mL 3 M sulfuric acid. ANSA reagent was prepared by dissolving 250 mg ANSA in a mixture of 15% sodium metabisulfite and 20% sodium sulfite. A standard phosphorus solution (80 μg/mL) was prepared from potassium dihydrogen orthophosphate. To 1 mL supernatant, 1 mL ammonium molybdate reagent and 0.5 mL ANSA reagent were added. The developed color was measured at 620 nm against a blank. A standard curve was prepared with various phosphorus standard concentrations, and the results are expressed as μM Pi liberated/mg protein/min.
Kidney histopathology
Kidney samples fixed in 10% formalin were dehydrated, embedded in paraffin, and sectioned into 5 μm slices with a microtome. These sections were stained with hematoxylin and eosin, as well as periodic acid-Schiff solution, and pathological changes were analyzed under a microscope at 400× magnification. The tissues were also sent to Shribios Innovation Laboratory, Pune, for histopathological analysis [40–42].
Statistical analysis
Statistical analysis was conducted with one-way analysis of variance (ANOVA), followed by Bonferroni’s multiple comparison test for all parameters. Data for each parameter were analyzed with one-way ANOVA with the Bonferroni test, performed in GraphPad Prism software, version 8.2, USA. Results are shown as mean±SD. Significance was determined as p>0.05 (non-significant), p<0.05 (significant), or p<0.01 (highly significant) [40].
Results
Physiological parameters
Effects of GLP and rutin alone or in combination on body weight in STZ induced diabetes in rats
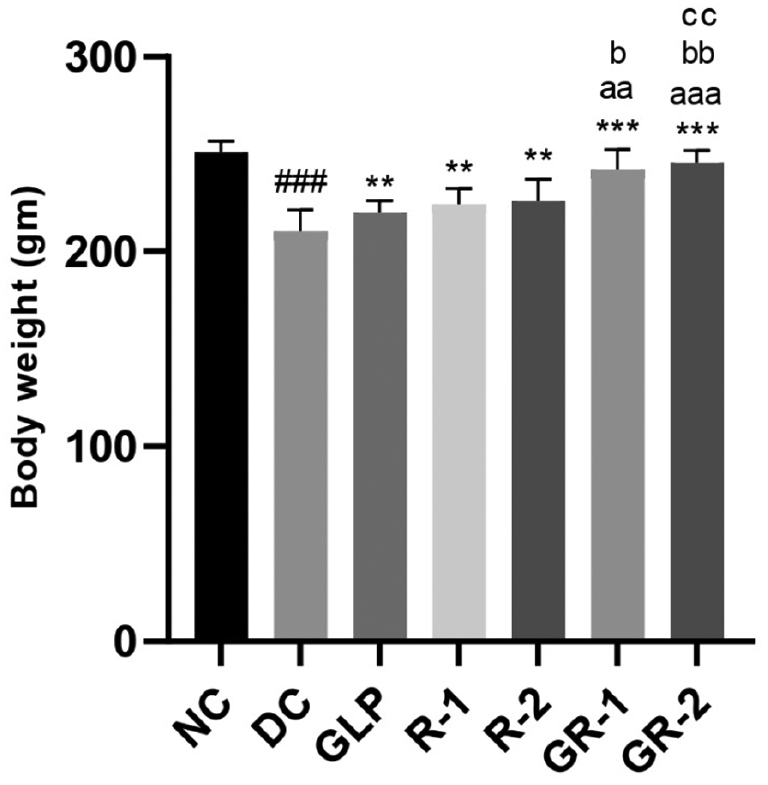
In STZ-induced diabetic rats, BW significantly decreased in the DC group (###p<0.001). GLP and rutin (RUT-1 and RUT-2) treatments, significantly increased BW, to levels above those in the DC group (***p<0.001). The combination of GLP and rutin (GR-1 and GR-2) showed greater weight gain in GR-1 than GLP and (aap<0.01) and RUT-1 (bp<0.05), and GR-2 significantly higher than GLP (aaap<0.001), RUT-1 (bbp<0.01), and RUT-2 (ccp<0.01). These findings indicated that both treatments, alone or in combination, improved BW, and combined treatments, particularly at higher doses, were most effective (Table 1 and Figure 1).
Table 1 Effects of Glimepiride and Rutin on BW (g) in STZ Induced Diabetes in Rats
| Group | BW (initial) (g) | BW (final) (g) |
|---|---|---|
| NC | 231.1±10.18 | 250.9±5.73 |
| DC | 235.7±11.78 | 210.3±11.15### |
| GLP | 231.8±9.06 | 219.8±6.37** |
| RUT-1 | 236.1±6.57 | 224.3±8.14** |
| RUT-2 | 228.0±8.81 | 225.8±11.34** |
| GR-1 | 230.2±14.96 | 242.2±10.32***, aa, b |
| GR-2 | 230.5±10.63 | 245.5±6.44***, aaa, bb, cc |
NC, normal control; DC, diabetic control; GLP, glimepride 0.5 mg/kg; RUT-1, rutin 50 mg/kg; RUT-2, rutin 100 mg/kg; GR-1, glimepride 0.5 mg/kg + rutin 50 mg/kg; GR-2, glimepride 0.5 mg/kg + rutin 100 mg/kg. Results are presented as means±SD (n=6). ANOVA with Bonferroni test: ###p<0.001with respect to NC; **p<0.01 with respect to DC; ***p<0.001 with respect to DC; aap<0.01 with respect to GLP; aaap<0.001 with respect to GLP; bp<0.05 with respect to RUT-1; bbp<0.01 with respect to RUT-1; ccp<0.01 with respect to RUT-2.
Figure 1 Effects of GLP and rutin alone or in combination on BW in STZ induced diabetes in rats (n=6).
Serum parameters
Table 2 illustrates the effects of GLP, rutin (RUT-1 and RUT-2), or their combination (GR-1 and GR-2) on serum Glu and serum BUN levels in STZ-induced diabetic rats. The diabetic DC group exhibited significantly higher serum Glu (383.7±4.30 mg/dL) and BUN levels (87.41±4.61 mg/dL) than the NC group, which had serum Glu and BUN levels of 106.1±2.88 mg/dL and 24.91±3.25 mg/dL, respectively. Treatment with GLP alone markedly decreased serum Glu to 140.9±3.57 mg/dL and serum BUN to 43.16±2.77 mg/dL. Similarly, rutin treatments (RUT-1 and RUT-2) decreased serum Glu (to 150.5±2.97 mg/dL and 135.3±3.99 mg/dL, respectively) and serum BUN levels (to 45.36±3.25 mg/dL and 37.65±3.22 mg/dL, respectively). Notably, the combined treatments (GR-1 and GR-2) elicited the most significant improvements: GR-1 decreased serum Glu to 116.7±4.47 mg/dL and BUN to 32.37±3.88 mg/dL, whereas GR-2 further lowered these levels to 110.2±3.83 mg/dL and 27.39±3.98 mg/dL. These results suggested that both GLP and rutin effectively ameliorated hyperglycemia and renal dysfunction in diabetic rats, and their combination provided synergistic benefits, particularly at high doses.
Table 2 Effect of Glimepiride and Rutin Alone and in Combination on Serum Parameters in STZ Induced Diabetes in Rats
| Group | Serum Glucose (mg/dL) | Serum BUN (mg/dL) |
|---|---|---|
| NC | 106.1±2.88 | 24.91±3.25 |
| DC | 383.7±4.30### | 87.41±4.61### |
| GLP | 140.9±3.57*** | 43.16±2.77*** |
| RUT-1 | 150.5±2.97*** | 45.36±3.25*** |
| RUT-2 | 135.3±3.99*** | 37.65±3.22*** |
| GR-1 | 116.7±4.47***, aaa, bbb, ccc | 32.37±3.88***, aaa, bbb |
| GR-2 | 110.2±3.83***, aaa, bbb, ccc | 27.39±3.98***, aaa, bbb, ccc |
NC, normal control; DC, diabetic control; GLP, glimepride 0.5 mg/kg; RUT-1, rutin 50 mg/kg; RUT-2, rutin 100 mg/kg; GR-1, glimepride 0.5 mg/kg + rutin 50 mg/kg; GR-2, glimepride 0.5 mg/kg + rutin 100 mg/kg. Results are presented as means±SD (n=6). ANOVA with Bonferroni test: ###p<0.001with respect to NC; ***p<0.001 with respect to DC; aaap<0.001 with respect to GLP; bbbp<0.001 with respect to RUT-1; cccp<0.001 with respect to RUT-2.
Table 3 shows the effects of GLP, rutin (RUT-1 and RUT-2), or their combination (GR-1 and GR-2) on serum albumin, creatinine, IL-1β, and IL-6 levels in STZ-induced diabetic rats. The DC group had significantly lower serum albumin (3.48±0.32 mg/dL), and higher creatinine (1.72±0.04 mg/dL), IL-1β (127.2±8.86 pg/mL), and IL-6 (127.2±8.86 pg/mL) levels, than the NC group. Treatments with GLP, RUT-1, and RUT-2 improved these parameters, by increasing serum albumin, and decreasing serum creatinine, IL-1β, and IL-6. The combination treatments (GR-1 and GR-2) yielded the most significant improvements. GR-2 treatment resulted in a serum albumin level of 5.35±0.29 mg/dL, creatinine level of 0.66±0.04 mg/dL, IL-1β level of 66.92±4.36 pg/mL, and IL-6 level of 66.92±4.36 pg/mL, thus demonstrating superior efficacy in mitigating the adverse effects of diabetes than either treatment alone.
Table 3 Effect of Glimepiride and Rutin Alone and in Combination on Serum Parameters in STZ Induced Diabetes in Rats
| Group | Serum Albumin (mg/dL) | Serum Creatinine (mg/dL) | Serum IL-1β Level (pg/mL) | Serum IL-6 Level (pg/mL) |
|---|---|---|---|---|
| NC | 5.55±0.30 | 0.60±0.02 | 51.78±4.39 | 51.78±4.39 |
| DC | 3.48±0.32### | 1.72±0.04### | 127.2±8.86### | 127.2±8.86### |
| GLP | 4.71±0.17*** | 0.92±0.03*** | 94.43±4.59*** | 94.43±4.59*** |
| RUT-1 | 4.63±0.28*** | 0.97±0.04*** | 98.24±9.14*** | 98.24±9.14*** |
| RUT-2 | 4.49±0.25*** | 0.83±0.04*** | 94.09±3.01*** | 94.09±3.01*** |
| GR-1 | 5.13±0.23***, a, b, cc | 0.73±0.04***, aaa, bbb, ccc | 82.73±4.08***, a, bb, c | 82.73±4.08***, a, bbb, c |
| GR-2 | 5.35±0.29***, aaa, bbb, ccc | 0.66±0.04***, aaa, bbb, ccc | 66.92±4.36***, aaa, bbb, ccc | 66.92±4.36***, aaa, bbb, ccc |
NC, normal control; DC, diabetic control; GLP, glimepride 0.5 mg/kg; RUT-1, rutin 50 mg/kg; RUT-2, rutin 100 mg/kg; GR-1, glimepride 0.5 mg/kg + rutin 50 mg/kg; GR-2, glimepride 0.5 mg/kg + rutin 100 mg/kg. Results are presented as means±SD (n=6). ANOVA with Bonferroni test: ###p<0.001with respect to NC; ***p<0.001 with respect to DC; ap<0.05 with respect to GLP; aaap<0.001 with respect to GLP; bp<0.05 with respect to RUT-1; bbp<0.01 with respect to RUT-1; bbbp<0.001 with respect to RUT-1; cp<0.05 with respect to RUT-2. ccp<0.01 with respect to RUT-2. cccp<0.001 with respect to RUT-2.
Table 4 shows the effects of GLP, rutin (RUT-1 and RUT-2), or their combination (GR-1 and GR-2) on lipid profiles in STZ-induced diabetic rats. The DC group showed higher serum cholesterol (233.0±4.14 mg/dL), LDL (96.88±3.77 mg/dL), and triglycerides (168.2±4.37 mg/dL), but lower HDL (42.71±2.24 mg/dL), than the NC group. Treatments with GLP, RUT-1, and RUT-2 resulted in significant improvements comprising decreased serum cholesterol, LDL, and triglycerides, and increased HDL. The combination treatments (GR-1 and GR-2) exhibited the most pronounced benefits. GR-2 treatment achieved the following levels: serum cholesterol, 149.2±4.46 mg/dL; HDL, 63.49±2.43 mg/dL; LDL, 58.94±1.42 mg/dL; and triglycerides, 82.30±2.89 mg/dL. Thus, both GLP and rutin, particularly in combination, effectively improved the lipid profile in diabetic rats. As shown in Table 5 and Figure 2, in STZ-induced diabetic rats, the DC group had considerably higher serum HbA1C levels (###p<0.001) than the NC group. Treatment with GLP and rutin (RUT-1 and RUT-2) led to significantly lower HbA1C levels (***p<0.001) than observed in the DC group. Combined treatments (GR-1 and GR-2) led to even greater decreases in HbA1C, with GR-1 showing significant decreases compared with GLP (aap<0.01) and RUT-1 (bbbp<0.001), and GR-2 showing significant decreases compared with GLP (aaap<0.001), RUT-1 (bbbp<0.001), and RUT-2 (cccp<0.001). Thus, GLP and rutin, particularly in combination, effectively lowered HbA1C levels in diabetic rats.
Table 4 Effect of Glimepiride and Rutin Alone and in Combination on Cholesterol and Triglyceride in STZ Induced Diabetes in Rats
| Group | Cholesterol (mg/dL) | HDL (mg/dL) | LDL (mg/dL) | Serum Triglyceride (mg/dL) |
|---|---|---|---|---|
| NC | 146.7±6.37 | 63.99±2.18 | 57.16±2.57 | 80.02±2.17 |
| DC | 233.0±4.14### | 42.71±2.24### | 96.88±3.77### | 168.2±4.37### |
| GLP | 168.9±3.04*** | 59.24±1.42*** | 67.24±3.64*** | 92.98±2.11*** |
| RUT-1 | 174.0±3.29*** | 57.78±1.23*** | 70.85±1.71*** | 94.16±2.79*** |
| RUT-2 | 164.4±4.20*** | 58.02±1.51*** | 65.11±3.30*** | 89.47±3.11*** |
| GR-1 | 157.6±3.05***, aaa, bbb | 62.73±2.19***, a, bb, cc | 60.72±2.10***, aaa, bbb | 86.04±2.82***, aa, bbb |
| GR-2 | 149.2±4.46***, aaa, bbb, ccc | 63.49±2.43***, aa, bbb, ccc | 58.94±1.42***, aaa, bbb, c | 82.30±2.89***, aaa, bbb, cc |
NC, normal control; DC, diabetic control; GLP, glimepride 0.5 mg/kg; RUT-1, rutin 50 mg/kg; RUT-2, rutin 100 mg/kg; GR-1, glimepride 0.5 mg/kg + rutin 50 mg/kg; GR-2, glimepride 0.5 mg/kg + rutin 100 mg/kg. Results are presented as means±SD (n=6). ANOVA with Bonferroni test: ###p<0.001with respect to NC; ***p<0.001 with respect to DC; ap<0.05 with respect to GLP; aap<0.01 with respect to GLP; aaap<0.001 with respect to GLP; bbp<0.01 with respect to RUT-1; bbbp<0.001 with respect to RUT-1; cp<0.05 with respect to RUT-2. ccp<0.01 with respect to RUT-2. cccp<0.001 with respect to RUT-2.
Table 5 Effects of GLP and Rutin Alone or in Combination on HbA1c and TNF-α in STZ Induced Diabetes in Rats
| Group | Serum HbA1C (%) | Serum TNF-α (pg/mL) |
|---|---|---|
| NC | 5.56±0.26 | 240.5±13.87 |
| DC | 14.17±0.37### | 401.4±14.15### |
| GLP | 7.17±0.31*** | 304.7±9.76*** |
| RUT-1 | 8.14±0.36*** | 312.2±9.01*** |
| RUT-2 | 6.92±0.65*** | 308.1±8.01*** |
| GR-1 | 6.17±0.36***, aa, bbb | 283.1±5.35***, a, bbb, cc |
| GR-2 | 5.72±0.43***, aaa, bbb, ccc | 265.5±8.88***, aaa, bbb, ccc |
NC, normal control; DC, diabetic control; GLP, glimepride 0.5 mg/kg; RUT-1, rutin 50 mg/kg; RUT-2, rutin 100 mg/kg; GR-1, glimepride 0.5 mg/kg + rutin 50 mg/kg; GR-2, glimepride 0.5 mg/kg + rutin 100 mg/kg. Results are presented as means±SD (n=6). ANOVA with Bonferroni test: ###p<0.001with respect to NC; ***p<0.001 with respect to DC; ap<0.05 with respect to GLP; aap<0.01 with respect to GLP; aaap<0.001 with respect to GLP; bbbp<0.001 with respect to RUT-1; ccp<0.01 with respect to RUT-2. cccp<0.001 with respect to RUT-2.
Figure 2 Effects of GLP and rutin alone or in combination on HbA1c and TNF-α in STZ induced diabetes in rats (n=6).
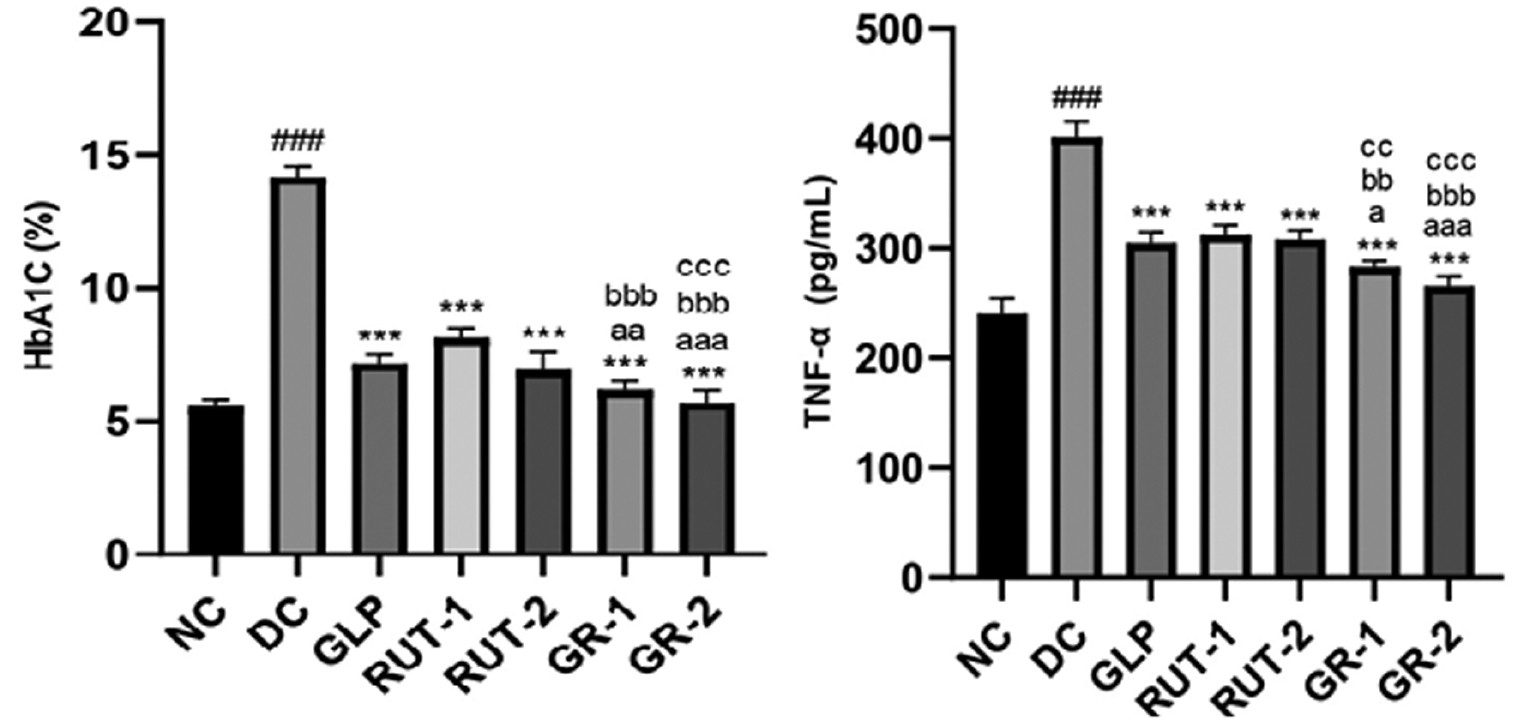
As shown in Table 5 and Figure 2, serum TNF-α levels were considerably higher in STZ-induced diabetic rats in the DC group than the NC group (###p<0.001). GLP and rutin (RUT-1 and RUT-2) treatments led to significantly lower TNF-α levels (***p<0.001) than observed in the DC group. Combined treatments (GR-1 and GR-2) further decreased the TNF-α levels, with GR-1 showing significant decreases compared with GLP (ap<0.05), RUT-1 (bbp<0.01), and RUT-2 (ccp<0.01), and GR-2 showing significant decreases compared with GLP (aaap<0.001), RUT-1 (bbbp<0.001), and RUT-2 (cccp<0.001). These findings indicated that both GLP and rutin, particularly in combination, effectively decreased serum TNF-α levels in diabetic rats, thus suggesting anti-inflammatory effects.
As shown in Table 6, in STZ-induced diabetic rats in the DC group, compared with the NC group, serum SGPT levels were significantly higher, total protein levels were lower, and CRP levels were higher. Treatment with GLP, rutin (RUT-1 and RUT-2), or their combination (GR-1 and GR-2) led to improvements in these parameters with respect to those observed in the DC group. Specifically, GR-2 elicited the most significant decreases in SGPT and CRP levels, and increase in total protein levels, thereby suggesting improved liver function and decreased inflammation. These results underscore the promise of these treatments, predominantly in combination, in ameliorating liver dysfunction and inflammation in diabetic conditions.
Table 6 Effect of Glimepiride and Rutin Alone and in Combination on Serum SGPT Level in STZ Induced Diabetes in Rats
| Group | SGPT (mg/dL) | Total Protein (TP) (mg/dL) | CRP (mg/dL) |
|---|---|---|---|
| NC | 23.22±2.64 | 7.39±0.16 | 1.26±0.19 |
| DC | 75.42±2.83### | 4.84±0.32### | 3.55±0.28### |
| GLP | 32.68±1.34*** | 6.81±0.28*** | 2.16±0.11*** |
| RUT-1 | 33.61±2.14*** | 6.48±0.55*** | 2.25±0.21*** |
| RUT-2 | 30.53±2.58*** | 6.65±0.32*** | 1.95±0.23*** |
| GR-1 | 27.47±1.88***, aa, bbb | 7.09±0.33***, b, c | 1.55±0.13***, aaa, bbb, c |
| GR-2 | 25.47±2.11***, aaa, bbb, cc | 7.28±0.42***, a, bb, cc | 1.33±0.15***, aaa, bbb, ccc |
Results are presented as means±SD (n=6). ANOVA with Bonferroni test: ###p<0.001with respect to NC; ***p<0.001 with respect to DC; ap<0.05 with respect to GLP; aap<0.01 with respect to GLP; aaap<0.001 with respect to GLP; bp<0.05 with respect to RUT-1; bbp<0.01 with respect to RUT-1; bbbp<0.001 with respect to RUT-1; cp<0.05 with respect to RUT-2; ccp<0.01 with respect to RUT-2. cccp<0.001 with respect to RUT-2.
Renal hypertrophy and organ collection
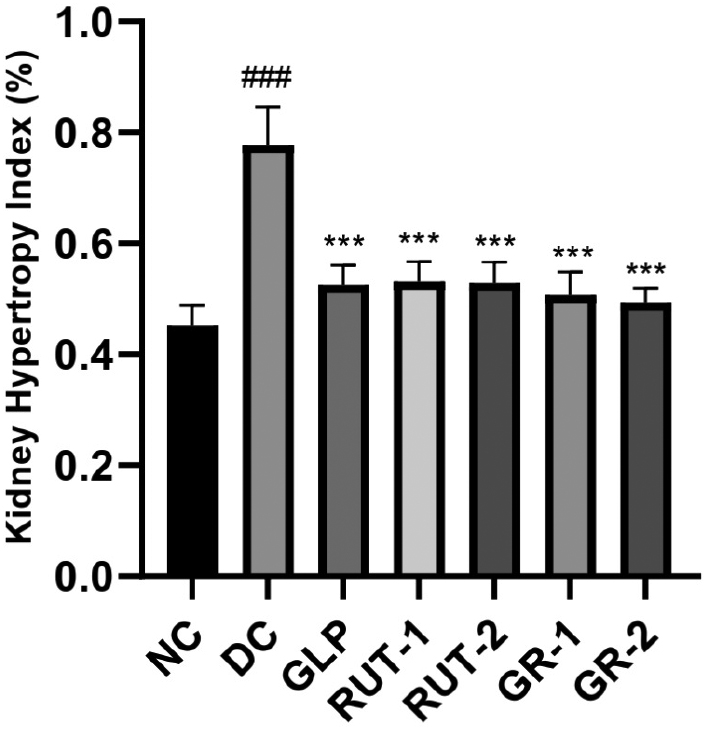
As shown in Table 7 and Figure 3, in rats with STZ-induced diabetes, the renal hypertrophy index was considerably higher in the DC group than the NC group (###p<0.001). Treatment with GLP, rutin (RUT-1 and RUT-2), or their combination (GR-1 and GR-2) resulted in a notably lower kidney hypertrophy index than observed in the DC group (***p<0.001). These findings suggested that both GLP and rutin, alone or in combination, effectively decrease renal hypertrophy in diabetic rats.
Table 7 Effects of GLP and Rutin Alone or in Combination on Renal Weight (g) and the Renal Hypertrophy Index in STZ Induced Diabetes in Rats
| Group | Final BW (g) (A) | Renal Weight (g) (B) | Renal Hypertrophy index (%) (B/A ×100) |
|---|---|---|---|
| NC | 250.9±5.75 | 1.13±0.08 | 0.45±0.04 |
| DC | 210.3±11.15 | 1.63±0.08 | 0.78±0.07### |
| GLP | 219.8±6.37 | 1.16±0.09 | 0.53±0.04*** |
| RUT-1 | 224.3±8.14 | 1.21±0.08 | 0.53±0.04*** |
| RUT-2 | 225.8±11.34 | 1.19±0.08 | 0.53±0.04*** |
| GR-1 | 242.2±10.32 | 1.22±0.05 | 0.51±0.04*** |
| GR-2 | 245.5±6.44 | 1.13±0.08 | 0.49±0.03*** |
NC, normal control; DC, diabetic control; GLP, glimepride 0.5 mg/kg; RUT-1, rutin 50 mg/kg; RUT-2, rutin 100 mg/kg; GR-1, glimepride 0.5 mg/kg + rutin 50 mg/kg; GR-2, glimepride 0.5 mg/kg + rutin 100 mg/kg. Results are presented as means±SD (n=6). ANOVA with Bonferroni test: ###p<0.001with respect to NC; ***p<0.001 with respect to DC.
Figure 3 Effects of GLP and rutin alone or in combination on renal weight and the renal hypertrophy index in STZ induced diabetes in rats (n=6).
Measurement of antioxidant markers in kidney homogenates
Oxidative stress parameters
LPO
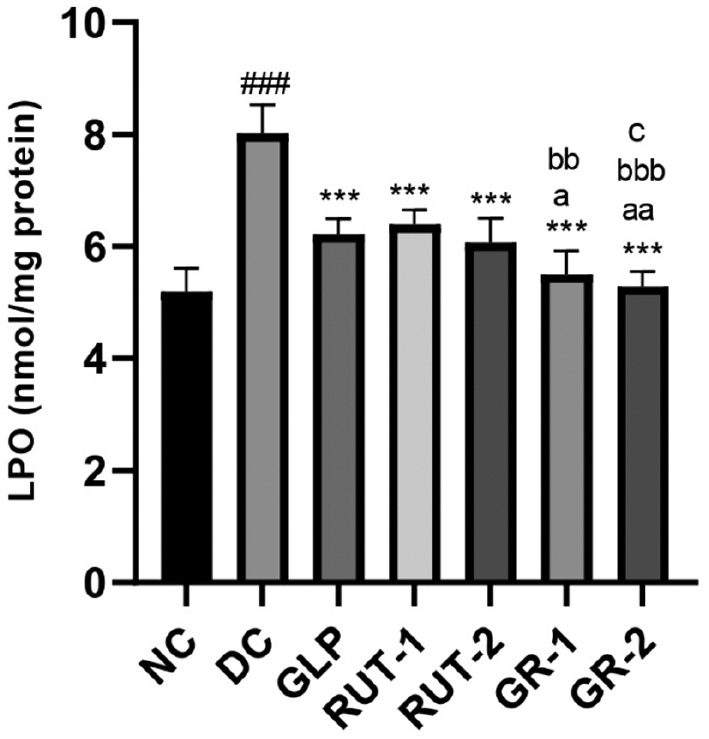
As shown in Table 8 and Figure 4, in STZ-induced diabetic rats, kidney homogenate LPO levels were markedly improved in the DC group compared with the NC group (###p<0.001). Management with GLP, rutin (RUT-1 and RUT-2), or their combination (GR-1 and GR-2) resulted in significantly lower kidney homogenate LPO levels than observed in the DC group (***p<0.001). Furthermore, the combined treatments (GR-1 and GR-2) elicited even greater decreases in LPO levels than the individual treatments, thereby indicating synergistic effects of GLP and rutin in mitigating kidney oxidative stress in diabetic conditions.
Table 8 Effects of GLP and Rutin Alone or in Combination on LPO in STZ Induced Diabetes in Rats
| Group | Kidney homogenate LPO (nmol/mg protein) |
|---|---|
| NC | 5.20±0.41 |
| DC | 8.02±0.50### |
| GLP | 6.22±0.28*** |
| RUT-1 | 6.39±0.26*** |
| RUT-2 | 6.07±0.43*** |
| GR-1 | 5.50±0.41***, a, bb |
| GR-2 | 5.29±0.26***, aa, bbb, c |
NC, normal control; DC, diabetic control; GLP, glimepride 0.5 mg/kg; RUT-1, rutin 50 mg/kg; RUT-2, rutin 100 mg/kg; GR-1, glimepride 0.5 mg/kg + rutin 50 mg/kg; GR-2, glimepride 0.5 mg/kg + rutin 100 mg/kg. Results are presented as means±SD (n=6). ANOVA with Bonferroni test: ###p<0.001with respect to NC; ***p<0.001 with respect to DC; ap<0.05 with respect to GLP; aap<0.01 with respect to GLP; bbp<0.01 with respect to RUT-1; bbbp<0.001 with respect to RUT-1; cp<0.05 with respect to RUT-2.
Figure 4 Effects of GLP and rutin alone or in combination on CRP in STZ induced diabetes in rats (n=6).
GSH
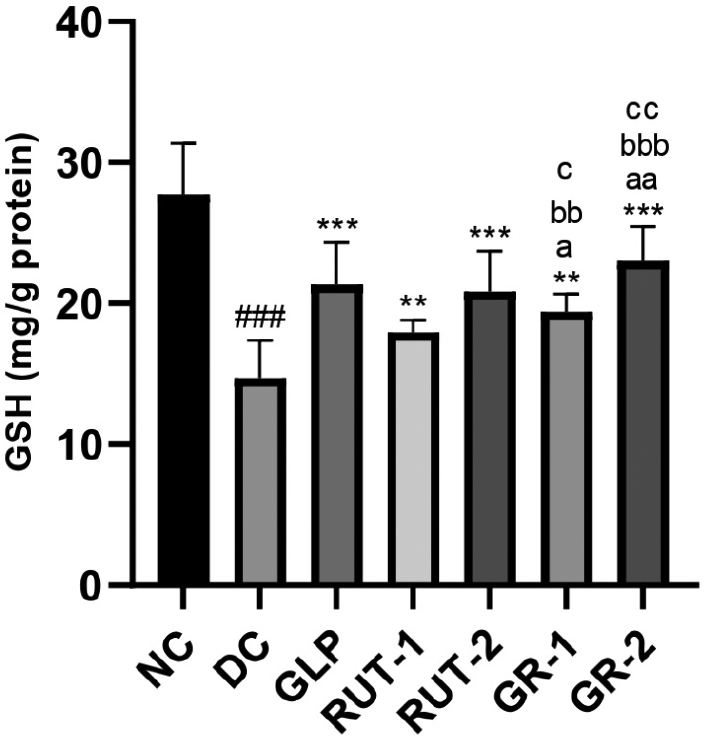
As shown in Table 9 and Figure 5, in STZ-induced diabetic rats, kidney homogenate GSH levels were significantly lower in the DC group than the NC group (###p<0.001). Treatment with GLP, rutin (RUT-1 and RUT-2), or their combination (GR-1 and GR-2) resulted in significantly greater kidney homogenate GSH levels than observed in the DC group (***p<0.001). Additionally, the combined treatments (GR-1 and GR-2) elicited greater increases in GSH levels than the individual treatments, thereby suggesting a synergistic effect of GLP and rutin in enhancing kidney antioxidant capacity in diabetic conditions.
Table 9 Effects of GLP and Rutin Alone or in Combination on GSH Content in STZ Induced Diabetes in Rats
| Group | Kidney homogenate GSH (mg/g protein) |
|---|---|
| NC | 27.74±3.61 |
| DC | 14.70±2.70### |
| GLP | 21.37±2.96** |
| RUT-1 | 17.96±0.87** |
| RUT-2 | 20.86±2.87** |
| GR-1 | 19.40±1.29**, a, bb, c |
| GR-2 | 23.02±2.44***, aa, bbb, cc |
NC, normal control; DC, diabetic control; GLP, glimepride 0.5 mg/kg; RUT-1, rutin 50 mg/kg; RUT-2, rutin 100 mg/kg; GR-1, glimepride 0.5 mg/kg + rutin 50 mg/kg; GR-2, glimepride 0.5 mg/kg + rutin 100 mg/kg. Results are presented as means±SD (n=6). ANOVA with Bonferroni test: ###p<0.001with respect to NC; **p<0.01 with respect to DC; ***p<0.001 with respect to DC; ap<0.05 with respect to GLP; aap<0.01 with respect to GLP; bbp<0.01 with respect to RUT-1; bbbp<0.001 with respect to RUT-1; cp<0.05 with respect to RUT-2; ccp<0.01 with respect to RUT-2.
Figure 5 Effects of GLP and rutin alone or in combination on GSH content in STZ induced diabetes in rats (n=6).
Nitric oxide
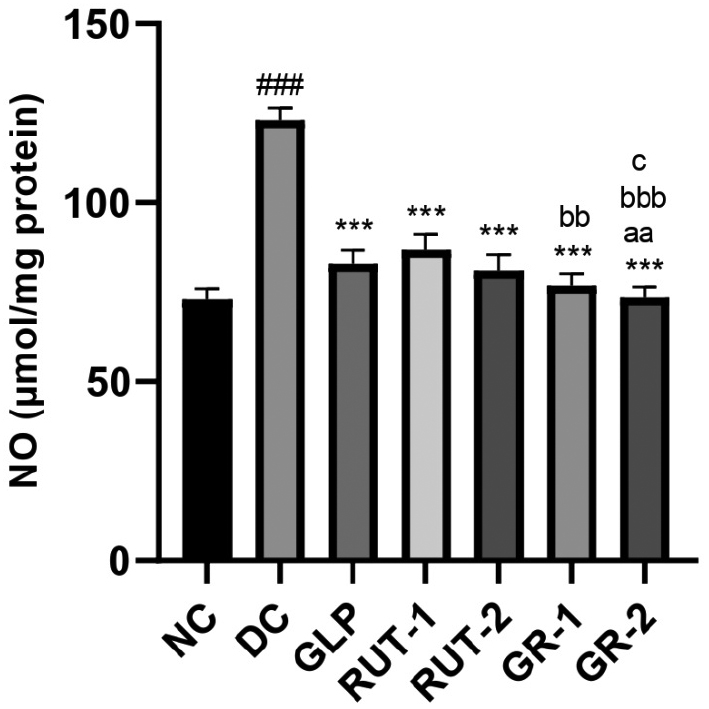
As shown in Table 10 and Figure 6, in STZ-induced diabetic rats, kidney homogenate NO levels were considerably higher in the DC group than the NC group (###p<0.001). Management with GLP, rutin (RUT-1 and RUT-2), or their combination (GR-1 and GR-2) resulted in substantially lower kidney homogenate NO levels than observed in the DC group (***p<0.001). Additionally, GR-1 and GR-2 led to lower NO levels than the individual treatments, and GR-2 elicited the most significant decrease. These findings suggested that both GLP and rutin, alone or in combination, effectively mitigate NO elevation in diabetic kidney tissue, and the combination therapy has the greatest efficacy.
Table 10 Effects of GLP and Rutin Alone or in Combination on NO Content in STZ Induced Diabetes in Rats
| Group | Kidney homogenate NO (μmol/mg protein) |
|---|---|
| NC | 72.93±3.19 |
| DC | 123.0±3.59### |
| GLP | 82.96±3.78*** |
| RUT-1 | 86.77±4.60*** |
| RUT-2 | 81.00±4.46*** |
| GR-1 | 76.97±3.23***, bb |
| GR-2 | 73.49±3.02***, aa, bbb, c |
NC, normal control; DC, diabetic control; GLP, glimepride 0.5 mg/kg; RUT-1, rutin 50 mg/kg; RUT-2, rutin 100 mg/kg; GR-1, glimepride 0.5 mg/kg + rutin 50 mg/kg; GR-2, glimepride 0.5 mg/kg + rutin 100 mg/kg. Results are presented as means±SD (n=6). ANOVA with Bonferroni test: ###p<0.001with respect to NC; ***p<0.001 with respect to DC; aap<0.01 with respect to GLP; bbp<0.01 with respect to RUT-1; bbbp<0.001 with respect to RUT-1; cp<0.05 with respect to RUT-2.
Figure 6 Effects of GLP and rutin alone or in combination on NO content in STZ induced diabetes in rats (n=6).
Kidney histopathology
As shown in Table 11 and Figure 7, histopathological investigation of kidney tissues from STZ-induced diabetic rats revealed various abnormalities in multiple treatment groups, in contrast to the NC group. One animal was randomly selected from each group, and one of its kidneys was investigated for histopathology.
Table 11 Individual Animal Histopathological Examination Findings with Grading
| Animal Groups | Observations |
|---|---|
| Normal control (NC) | Kidney: No abnormalities detected |
| Diabetic control (DC) | Kidney: Multifocal tubular cytoplasmic vacuolation (2) Multifocal tubular dilation (2) Focal tubular atrophy (1) Multifocal dilated Bowman’s space (3) |
| Glimepiride 0.5 mg/kg (GLP) | Kidney: Multifocal tubular cytoplasmic vacuolation (2) Multifocal tubular dilation (2) Multifocal dilated Bowman’s space at glomeruli (2) |
| Rutin 50 mg/kg (RUT 1) | Kidney: Multifocal tubular cytoplasmic vacuolation (1) Focal tubular dilation (1) Focal dilated Bowman’s space at glomeruli (1) |
| Rutin 100 mg/kg (RUT 2) | Kidney: Focal tubular cytoplasmic vacuolation (1) Focal tubular dilation (1) Focal dilated Bowman’s space at glomeruli (1) |
| Glimepiride 0.5 mg/kg + rutin 50 mg/kg (GR 1) | Kidney: Focal tubular cytoplasmic vacuolation (1) Multifocal dilated Bowman’s space at glomeruli (1) |
| Glimepiride 0.5 mg/kg + rutin 100 mg/kg (GR 2) | Kidney: Focal tubular dilation (1) Focal dilated Bowman’s space at glomeruli (1) |
0, nil or normal; 1, mild; 2, minimal; 3, moderate; 4, severe.
Figure 7 Histopathology studies.
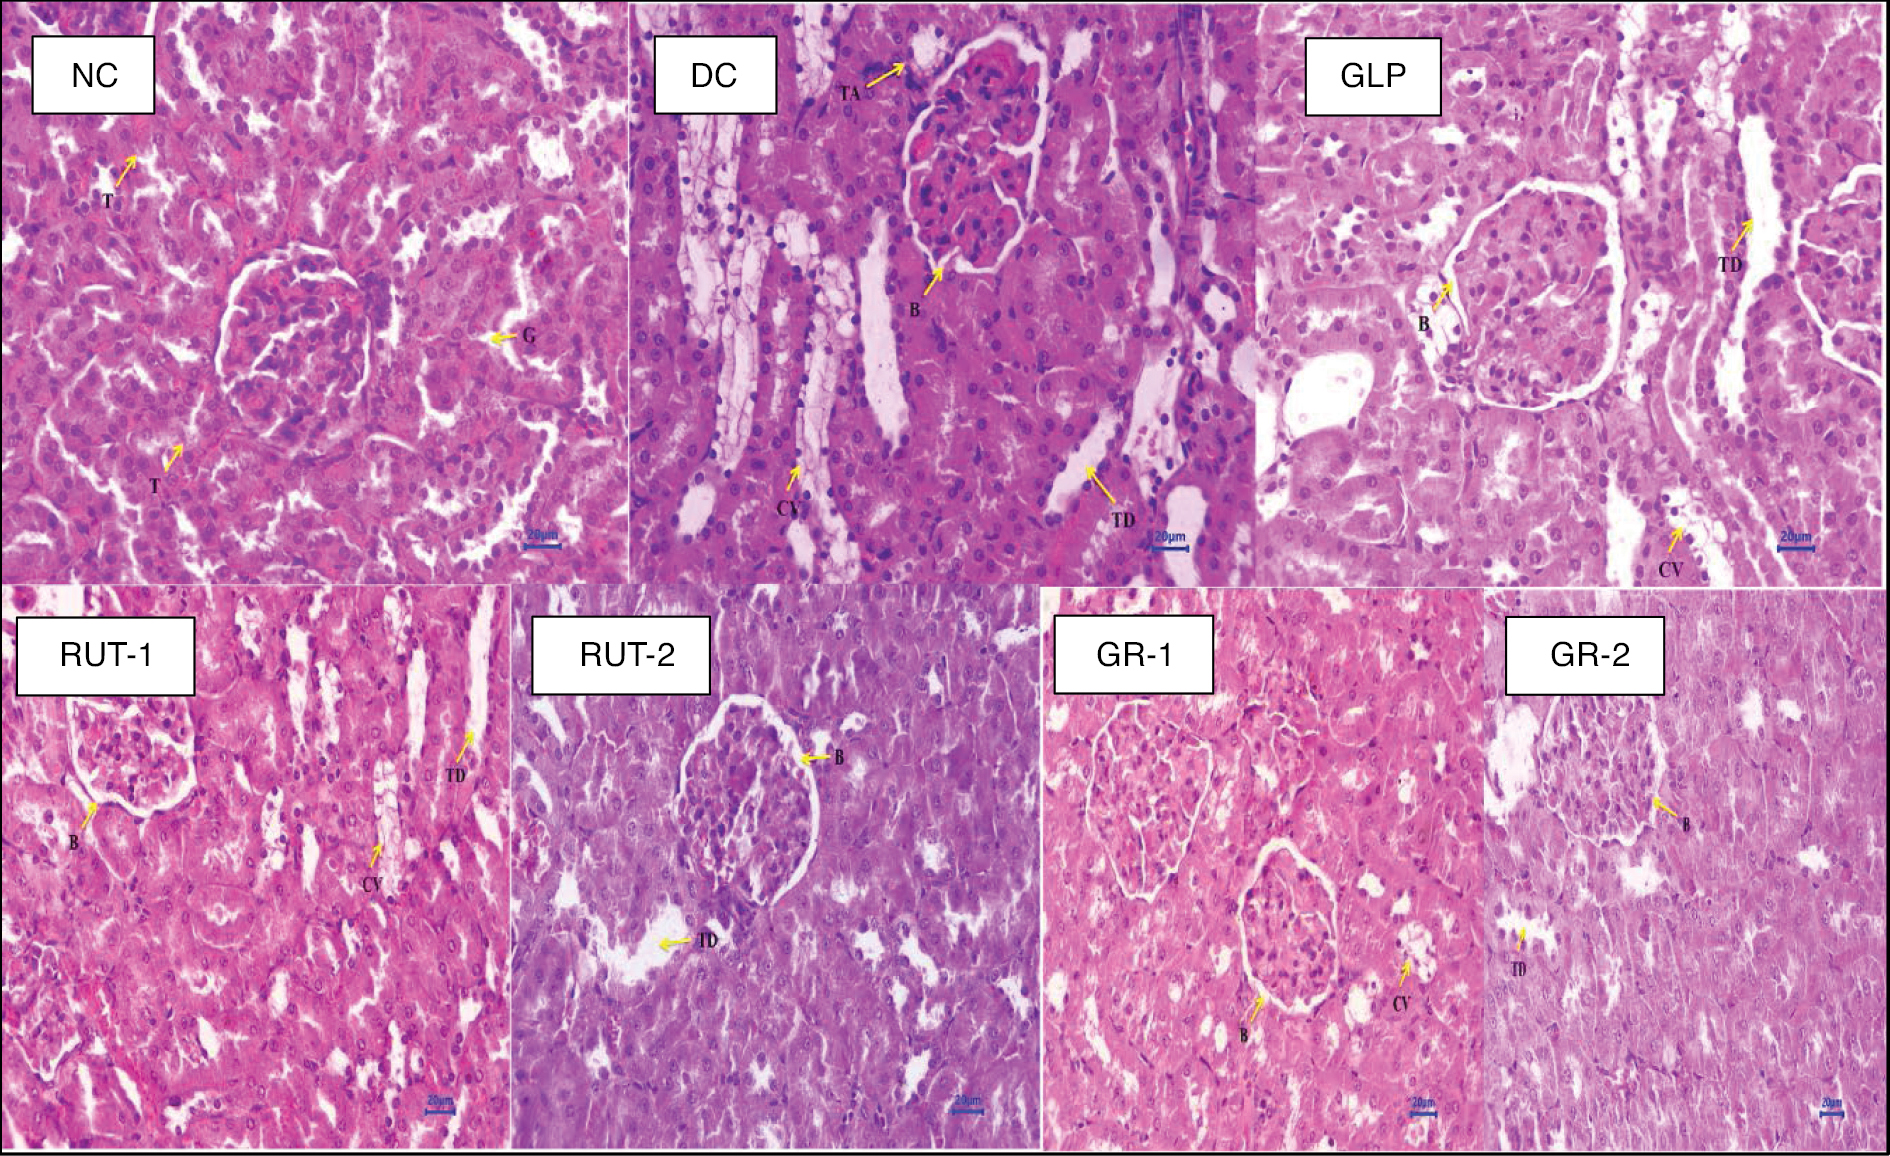
The DC group demonstrated multifocal tubular cytoplasmic vacuolation, tubular dilation, focal tubular atrophy, and a dilated Bowman’s space, indicating renal damage. Treatment with GLP at 0.5 mg/kg was associated with similar abnormalities, albeit with fewer instances of a dilated Bowman’s space. Rutin at 50 mg/kg or 100 mg/kg resulted in fewer abnormalities, primarily involving tubular cytoplasmic vacuolation, tubular dilation, and a focally dilated Bowman’s space. Combining GLP with rutin at both doses showed further improvements, with fewer instances of abnormalities, particularly in tubular dilation and a dilated Bowman’s space. These findings suggested that both GLP and rutin, either alone or in combination, mitigate the histological alterations associated with DN, and the combination therapy shows enhanced efficacy in preserving renal architecture.
Histopathological analysis of kidney tissues revealed distinct differences among treatment groups. The NC group exhibited typical renal histology, whereas the DC group showed tubular dilation, tubular atrophy, a dilated Bowman’s space, and cytoplasmic vacuolation. Treatment with GLP at 0.5 mg/kg, rutin at 50 mg/kg or 100 mg/kg, or their combination led to similar histological changes, including tubular dilation, a dilated Bowman’s space, and cytoplasmic vacuolation. However, combining GLP with rutin elicited improvements, particularly in decreasing tubular dilation.
The histopathological findings underscored the potential synergistic effects of combining GLP with rutin in ameliorating renal damage associated with STZ-induced diabetes in rats. Whereas the individual treatments or their combination exhibited similar histological changes, including tubular dilation, a dilated Bowman’s space, and cytoplasmic vacuolation, the combination therapy elicited improvements, notably in decreasing tubular dilation. These findings suggested that the combined use of GLP and rutin may offer enhanced efficacy in preserving renal architecture and mitigating histopathological alterations associated with DN, thus providing a potentially promising avenue for therapeutic intervention in diabetes-induced renal complications.
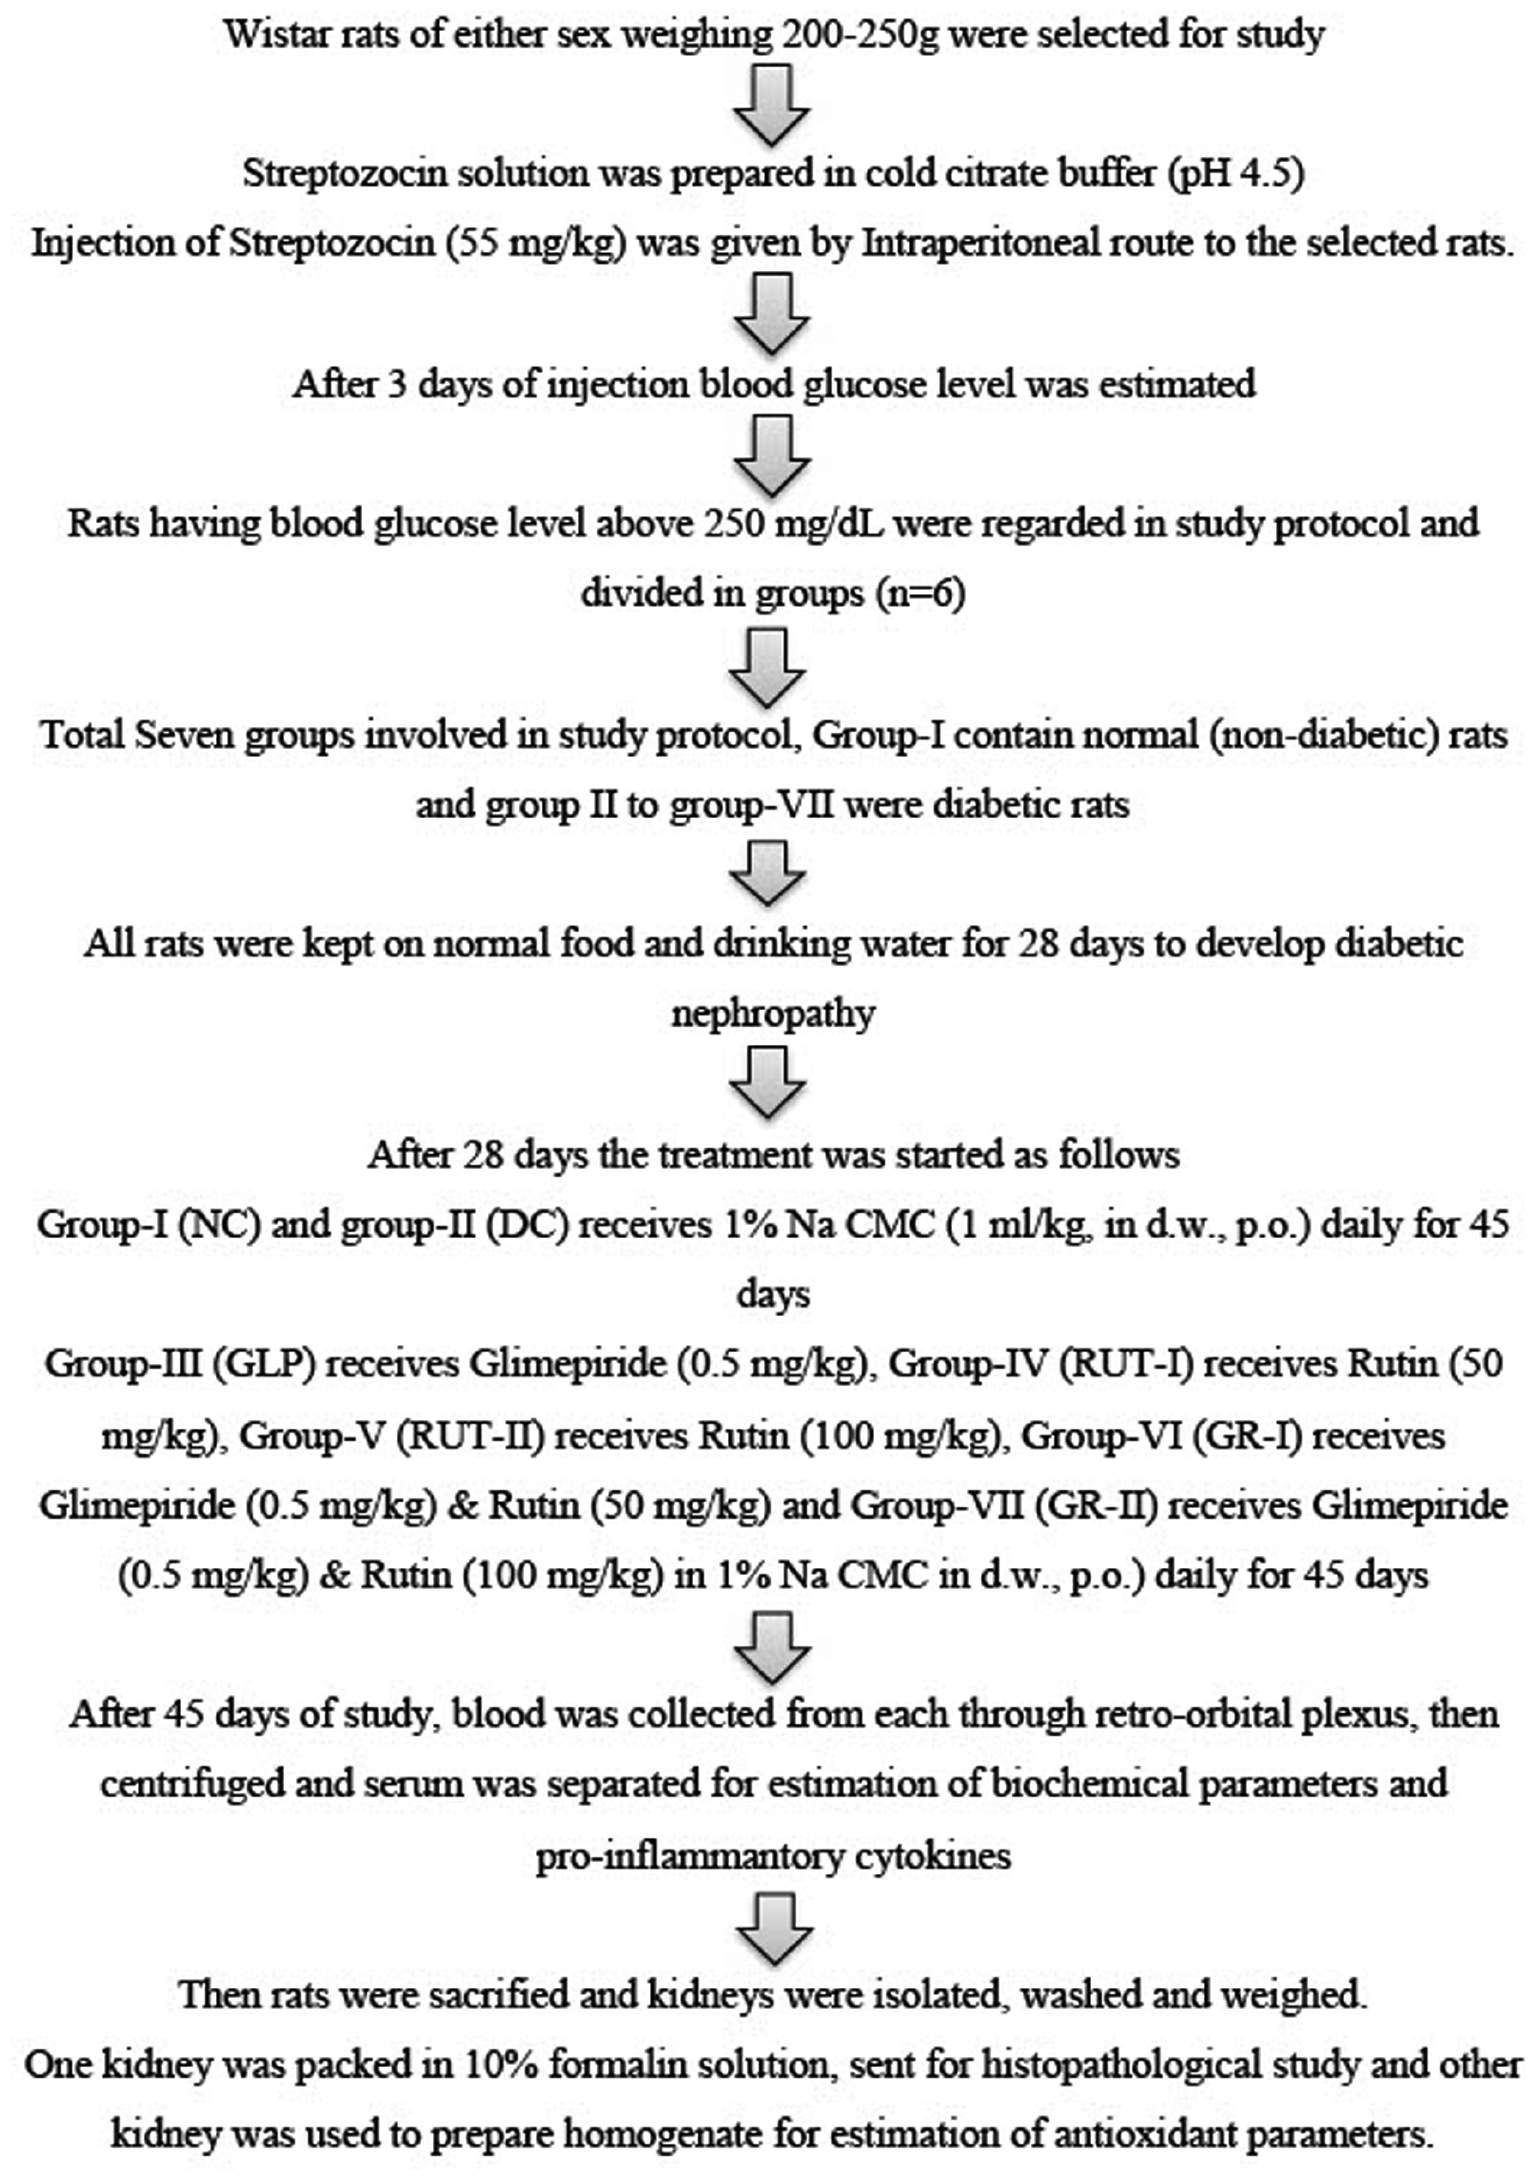
The detailed workflow diagram of the animal experiments is presented in Figure 8.
Figure 8 Workflow diagram of the animal experiments.
Discussion
This study demonstrated that rutin, alone or in combination with GLP, significantly ameliorates DN, probably because of its antioxidant and anti-inflammatory effects. The combination therapy appeared to enhance GLP’s efficacy, thus offering better renal protection and overall diabetic management. We chose doses of GLP at 0.5 mg/kg, and of rutin at 50 mg/kg or 100 mg/kg, on the basis of their established pharmacological profiles and previous research, to ensure effective glycemic control, and enable evaluation of rutin’s efficacy and safety across a range of concentrations. These doses were both effective and well-tolerated, thus suggesting the therapeutic potential of these treatments.
GLP and rutin, particularly in combination, significantly improved various physiological and biochemical parameters in STZ-induced diabetic rats. Both treatments individually ameliorated BW, serum glucose, lipid profiles, and antioxidant markers, but their combination—particularly at higher doses—exhibited superior efficacy. The combination treatments notably decreased blood glucose, improved renal and inflammatory markers, and enhanced overall metabolic health more effectively than either treatment alone. Our experimental model findings therefore highlight the potential of these treatments for managing diabetes and related complications.
Conclusion
This study demonstrated that both GLP and rutin, administered alone or in combination, exerted beneficial effects in mitigating various STZ-induced diabetic complications in rats. These effects included improvements in BW, serum Glu and BUN levels, lipid profiles, HbA1C, inflammatory markers, liver function parameters, kidney hypertrophy, oxidative stress markers, and histopathological alterations associated with DN. Importantly, GLP and rutin combination therapy exhibited synergistic benefits, as evidenced by significant improvements in multiple parameters, thus suggesting a promising approach for the management of diabetes-related complications.
Conflicts of interest
None.
References
- Shi GJ, Shi GR, Zhou JY, Zhang WJ, Gao CY, et al. Involvement of growth factors in diabetes mellitus and its complications: a general review. Biomed Pharmacother 2018;101:510-27. [PMID: 29505922 DOI: 10.1016/j.biopha.2018.02.105]
- Ghaisas MM, Ahire YS, Dandawate PR, Gandhi SP, Mule M. Effects of combination of thiazolidinediones with melatonin in dexamethasone-induced insulin resistance in mice. Indian J of Pharm Sci 2011;73(6):601-07. [PMID: 23112392 DOI: 10.4103/0250-474X.100232]
- Sun H, Saeedi P, Karuranga S, Pinkepank M, Ogurtsova K, et al. IDF Diabetes Atlas: global, regional and country-level diabetes prevalence estimates for 2021 and projections for 2045. Diabetes Res Clin Pract 2022;183:109119. [PMID: 34879977 DOI: 10.1016/j.diabres.2021.109119]
- Argaev-Frenkel L, Rosenzweig T. Redox balance in type 2 diabetes: therapeutic potential and the challenge of antioxidant-based therapy. Antioxidants (Basel) 2023;12(5):994. [PMID: 37237860 DOI: 10.3390/antiox12050994]
- Pathade PA, Ahire YS, Bairagi VA, Abhang DR. Antioxidants therapy in cognitive dysfunction associated with diabetes mellitus: an overview. Research J. Pharmacology and Pharmacodynamics 2011;3(2):39-44.
- Rolo AP, Palmeira CM. Diabetes and mitochondrial function: role of hyperglycemia and oxidative stress. Toxicol Appl Pharmacol 2006;212(2):167-78. [PMID: 16490224 DOI: 10.1016/j.taap.2006.01.003]
- Ahire YS, Bairagi VA, Somavanshi DB, Jadhav SR, Jadhav SB, et al. Expanding telmisartan’s therapeutic horizon: exploring its multifaceted mechanisms beyond cardiovascular disorders. Futur J Pharm Sci 2024;10(1):84. [DOI: 10.1186/s43094-024-00655-9]
- Abdali D, Samson SE, Grover AK. How effective are antioxidant supplements in obesity and diabetes. Med Princ Pract 2015;24(3):201-15. [PMID: 25791371 DOI: 10.1159/000375305]
- Velikova TV, Kabakchieva PP, Assyov YS, Georgiev TA. Targeting inflammatory cytokines to improve type 2 diabetes control. Biomed Res Int 2021;2021(1):7297419. [PMID: 34557550 DOI: 10.1155/2021/7297419]
- Xie Z, Zhong L, Wu Y, Wan X, Yang H, et al. Carnosic acid improves diabetic nephropathy by activating Nrf2/ARE and inhibition of NF-κB pathway. Phytomedicine 2018;47:161-73. [PMID: 30166101 DOI: 10.1016/j.phymed.2018.04.031]
- Kundu A, Dey P, Sarkar P, Karmakar S, Tae IH, et al. Protective effects of Croton hookeri on streptozotocin-induced diabetic nephropathy. Food Chem Toxicol 2020;135:110873. [PMID: 31600566 DOI: 10.1016/j.fct.2019.110873]
- Rivero A, Mora C, Muros M, García J, Herrera H, et al. Pathogenic perspectives for the role of inflammation in diabetic nephropathy. Clin Sci (Lond) 2009;116(6):479-92. [PMID: 19200057 DOI: 10.1042/CS20080394]
- Sies H. Oxidative stress: concept and some practical aspects. Antioxid (Basel) 2020;9(9):852. [PMID: 32927924 DOI: 10.3390/antiox9090852]
- Sies H, Belousov VV, Chandel NS, Davies MJ, Jones DP, et al. Defining roles of specific reactive oxygen species (ROS) in cell biology and physiology. Nat Rev Mol Cell Biol 2022;23(7):499-515. [PMID: 35190722 DOI: 10.1038/s41580-022-00456-z]
- Demirci-Çekiç S, Özkan G, Avan AN, Uzunboy S, Çapanoğlu E, et al. Biomarkers of oxidative stress and antioxidant defense. J Pharm Biomed Anal 2022;209:114477. [PMID: 34920302 DOI: 10.1016/j.jpba.2021.114477]
- Kapucu A. Crocin ameliorates oxidative stress and suppresses renal damage in streptozotocin induced diabetic male rats. Biotech Histochem 2021;96(2):153-60. [PMID: 32835521 DOI: 10.1080/10520295.2020.1808702]
- Duan S, Lu F, Song D, Zhang C, Zhang B, et al. Current challenges and future perspectives of renal tubular dysfunction in diabetic kidney disease. Front Endocrinol (Lausanne) 2021;12:661185. [PMID: 34177803 DOI: 10.3389/fendo.2021.661185]
- Rehman MU, Tahir M, Khan AQ, Khan R, Lateef A, et al. Chrysin suppresses renal carcinogenesis via amelioration of hyperproliferation, oxidative stress and inflammation: plausible role of NF-κB. Toxicol Lett 2013;216(2-3):146-58. [PMID: 23194824 DOI: 10.1016/j.toxlet.2012.11.013]
- Sanajou D, Haghjo AG, Argani H, Aslani S. AGE-RAGE axis blockade in diabetic nephropathy: current status and future directions. Eur J Pharmacol 2018;833:158-64.[PMID: 29883668 DOI: 10.1016/j.ejphar.2018.06.001]
- Xu L, Hiller S, Simington S, Nickeleit V, Maeda N, et al. Influence of different levels of lipoic acid synthase gene expression on diabetic nephropathy. PLoS One 2016;11(10):e0163208. [PMID: 27706190 DOI: 10.1371/journal.pone.0163208]
- Samsu N. Diabetic nephropathy: challenges in pathogenesis, diagnosis, and treatment. Biomed Res Int 2021;2021:1497449. [PMID: 34307650 DOI: 10.1155/2021/1497449]
- Sagoo MK, Gnudi L. Diabetic nephropathy: an overview. Methods Mol Biol 2020;2067:3-7. [PMID: 31701441 DOI: 10.1007/978-1-4939-9841-8_1]
- Pelle MC, Provenzano M, Busutti M, Porcu CV, Zaffina I, et al. Up-date on diabetic nephropathy. Life (Basel) 2022;12(8):1202. [PMID: 36013381 DOI: 10.3390/life12081202]
- Warren AM, Knudsen ST, Cooper ME. Diabetic nephropathy: an insight into molecular mechanisms and emerging therapies. Expert Opin Ther Targets 2019;23(7):579-91. [PMID: 31154867 DOI: 10.1080/14728222.2019.1624721]
- Tsuprykov O, Ando R, Reichetzeder C, von Websky K, Antonenko V, et al. The dipeptidyl peptidase inhibitor linagliptin and the angiotensin II receptor blocker telmisartan show renal benefit by different pathways in rats with 5/6 nephrectomy. Kidney Int 2016;89(5):1049-1061. [PMID: 27083282 DOI: 10.1016/j.kint.2016.01.016]
- Sato-Horiguchi C, Ogawa D, Wada J, Tachibana H, Kodera R, et al. Telmisartan attenuates diabetic nephropathy by suppressing oxidative stress in db/db mice. Nephron Exp Nephrol 2012;121(3-4):e97-e108. [PMID: 23307263 DOI: 10.1159/000343102]
- Balakumar P, Bishnoi HK, Mahadevan N. Telmisartan in the management of diabetic nephropathy: a contemporary view. Curr Diabetes Rev 2012;8(3):183-90. [PMID: 22429010 DOI: 10.2174/157339912800563972]
- Benson SC, Pershadsingh HA, Ho CI, Chittiboyina A, Desai P, et al. Identification of telmisartan as a unique angiotensin II receptor antagonist with selective PPARgamma-modulating activity. Hypertension. 2004;43(5):993-1002. [PMID: 15007034 DOI: 10.1161/01.HYP.0000123072.34629.57]
- Saitoh Y, Hongwei W, Ueno H, Mizuta M, Nakazato M. Telmisartan attenuates fatty-acid-induced oxidative stress and NAD(P)H oxidase activity in pancreatic beta-cells. Diabetes Metab 2009;35(5):392-7. [PMID: 19713141 DOI: 10.1016/j.diabet.2009.04.005]
- Shigihara N, Uchida T, Yorifuji T, Toyofuku Y, Tamaki M, et al. Olmesartan and telmisartan comparably preserve pancreatic beta-cell mass with reduction of oxidative stress in db/db mice. Diabetol Int 2014;5:62. [DOI: 10.1007/s13340-013-0135-x]
- Habauzit V, Sacco SM, Gil-Izquierdo A, Trzeciakiewicz A, Morand C, et al. Differential effects of two citrus flavanones on bone quality in senescent male rats in relation to their bioavailability and metabolism. Bone 2011;49(5):1108-16. [PMID: 21820093 DOI: 10.1016/j.bone.2011.07.030]
- Gelen V, Yıldırım S, Şengül E, Çınar A, Çelebi F, et al. Naringin attenuates oxidative stress, inflammation, apoptosis, and oxidative DNA damage in acrylamide-induced nephrotoxicity in rats. Asian Pac J Trop Biomed 2022;12(5):223. [DOI: 10.4103/2221-1691.343390]
- Chen F, Wei G, Xu J, Ma X, Wang Q. Naringin ameliorates the high Glu-induced rat mesangial cell inflammatory reaction by modulating the NLRP3 Inflammasome. BMC Complement Altern Med 2018;18(1):192. [PMID: 29929501 DOI: 10.1186/s12906-018-2257-y]
- Zhang J, Yang S, Li H, Chen F, Shi J. Naringin ameliorates diabetic nephropathy by inhibiting NADPH oxidase 4. Eur J Pharmacol 2017;804:1-6. [PMID: 28395989 DOI: 10.1016/j.ejphar.2017.04.006]
- Dubey VK, Patil CR, Kamble SM, Tidke PS, Patil KR, et al. Oleanolic acid prevents progression of streptozotocin induced diabetic nephropathy and protects renal microstructures in Sprague Dawley rats. J Pharmacol Pharmacother 2013;4(1):47-52. [PMID: 23662024 DOI: 10.4103/0976-500X.107678]
- Mahmoud AM, Ashour MB, Abdel-Moneim A, Ahmed OM. Hesperidin and naringin attenuate hyperglycemia-mediated oxidative stress and proinflammatory cytokine production in high fat fed/streptozotocin-induced type 2 diabetic rats. J Diabetes Complications 2012;26(6):483-90. [PMID: 22809898 DOI: 10.1016/j.jdiacomp.2012.06.001]
- Mestry SN, Dhodi JB, Kumbhar SB, Juvekar AR. Attenuation of diabetic nephropathy in streptozotocin-induced diabetic rats by Punica granatum Linn. leaves extract. J Tradit Complement Med 2017;7(3):273-80. [PMID: 28725620 DOI: 10.1016/j.jtcme.2016.06.008]
- Slater TF, Sawyer BC. The stimulatory effects of carbon tetrachloride and other halogenoalkanes on peroxidative reactions in rat liver fractions in vitro. General features of the systems used. Biochem J 1971;123(5):805-14. [PMID: 4399399 DOI: 10.1042/bj1230805]
- Moron MS, Depierre JW, Mannervik B. Levels of glutathione, glutathione reductase and glutathione S-transferase activities in rat lung and liver. Biochim Biophys Acta 1979;582(1):67-78. [PMID: 760819 DOI: 10.1016/0304-4165(79)90289-7]
- Bonting SL. Sodium-potassium activated adenosine triphosphatase and cation transport. Membrane ion transport. 1970. Available from: https://cir.nii.ac.jp/crid/1572543025326615168#citations_container.
- Guevara I, Iwanejko J, Dembińska-Kieć A, Pankiewicz J, Wanat A, et al. Determination of nitrite/nitrate in human biological material by the simple Griess reaction. Clin Chim Acta 1998;274(2):177-88. [PMID: 9694586 DOI: 10.1016/s0009-8981(98)00060-6]
- Parayanthala Valappil M, Santhakumar S, Arumugam S. Determination of oxidative stress related toxicity on repeated dermal exposure of hydroxyapatite nanoparticles in rats. Int J Biomater 2014;2014(1):476942. [PMID: 25587279 DOI: 10.1155/2014/476942]