Enhanced Drug Dissolution of Nitrofurantoin Using a Solid Dispersion Technique
1D.S.T.S. Mandal’s College of Pharmacy, Solapur, Maharashtra 413004, India
*Correspondence to: Mr. D. S. Bhosale, D.S.T.S. Mandal’s College of Pharmacy, Solapur, Maharashtra 413004, India. E mail: deepakraobhosale@gmail.com
Received: May 22 2024; Revised: July 4 2024; Accepted: July 9 2024; Published Online: August 1 2024
Cite this paper:
Bhosale DS, Kalshetti MS. Enhanced Drug Dissolution of Nitrofurantoin Using a Solid Dispersion Technique. BIO Integration 2024; 5: 1–8.
DOI: 10.15212/bioi-2024-0025. Available at: https://bio-integration.org/
Download citation
© 2024 The Authors. This is an open access article distributed under the terms of the Creative Commons Attribution License (https://creativecommons.org/licenses/by/4.0/). See https://bio-integration.org/copyright-and-permissions/
Abstract
Background: Nitrofurantoin is a BCS II drug with a low solubility and dissolution rate. Therefore, the pharmaceutical applications of nitrofurantoin are limited. The purpose of the current study was to enhance the solubility, dissolution, and bioavailability of nitrofurantoin by formulating a solid dispersion (SD).
Methods: The SD was developed using 32 factorial designs considering poloxamer 188 and the trituration time as independent variables, and solubility and drug release as dependent variables. The developed SD was characterized for solubility, FTIR, DSC, XRD, in vitro dissolution, and pharmacokinetic studies in rats.
Results: Nitrofurantoin:poloxamer 188 at a 1:1 ratio had higher solubility than nitrofurantoin. The solubility of nitrofurantoin was directly related to the amount of poloxamer 188 and trituration time. In addition, poloxamer 188 concentration was directly related to the DR45 (%), while the rate of stirring was inversely related to the DR45 (%). An FTIR study revealed excellent drug excipient compatibility. The crystallinity of the drug was decreased, which indicated a more amorphous nature of the drug in XRD and DSC studies. Compared to pure drug dispersion, the optimized formulation exhibited a 3.88-fold improvement in the bioavailability of nitrofurantoin, whereas compared to the marketed formulation, a 1.77-fold enhancement in bioavailability was noted.
Conclusion: This study indicated that SD could be a potential carrier system to enhance the solubility, dissolution, and bioavailability of nitrofurantoin.
Keywords
Bioavailability, dissolution, nitrofurantoin, poloxamer 188, solid dispersion, solubility.
Introduction
Nearly 40% of new chemical entities (NCEs) are classified as poorly water-soluble drugs, which poses significant challenges in formulation development. The solubility behavior of these drugs remains a critical factor that directly influences oral bioavailability, which in turn affects the absorption rate from the gastrointestinal tract [1, 2]. As a result, a large number of significant pharmaceutical drugs either never make it to market or never realize their full therapeutic potential. “Solid dispersion” (SD) describes a kind of solid goods that consists of two or more different components (usually a hydrophilic medicament and a crystalline or amorphous matrix). Within the matrix, the medication may be distributed in a crystalline, amorphous, or molecular form [3, 4]. SD technologies hold great promise in enhancing the solubility, dissolution rate, and bioavailability of drugs classified under BCS Class II because the bioavailability of such drugs is heavily influenced by solubility and permeability.
Solid dosage forms in sustained delivery often consist of dual constituents (a hydrophilic matrix and a hydrophobic drug). The matrix exhibits a crystalline or amorphous structure [1–4]. Medications can be formulated into molecularly dispersed amorphous particles or crystalline particles. SD technologies have significant promise in improving solubility, the rate of dissolution, and the bioavailability of BCS Class II drugs because therapeutic bioavailability is dependent on solubility and permeability variables [5–8]. Improving the dissolving properties of the weakly water-soluble drug, nitrofurantoin, was the goal of this research project [9, 10]. Nitrofurantoin is used for the treatment of uncomplicated lower urinary tract infections [11–13]. Nitrofurantoin must be ingested orally. Nausea, vomiting, loss of appetite, diarrhea, and headaches are typical negative reactions [14]. Occasionally, numbness, lung issues, and liver problems can occur [15, 16]. Nitrofurantoin was selected due to the limited solubility in water. The solubility and dissolution rates were improved by conjugating nitrofurantoin with various carriers. To create the granules, the physical mixing and melt granulation method was used [17]. Some of the carriers used in solid dispersion may possess wetting properties, suggesting that enhanced wetting could potentially decrease agglomeration and augment the surface area.
Materials and methods
Materials
The nitrofurantoin used in this study was generously provided by Ahmedabad’s Sun Pharma Pvt. Ltd. (Ahmedabad, India). Poloxamer 188, polyethylene glycol 6000, and gelucire 50/13 were purchased from Sigma-Aldrich (Mumbai, Maharashtra, India). Triple distilled water was used in this study.
Methods
UV analysis
A stock solution of nitrofurantoin (1 mg/10 ml) was initially prepared in distilled water and subsequently diluted to achieve solutions ranging from 2–18 g/ml. Samples were analyzed at 241 nm using a UV-visible spectrophotometer (UV mini-1900, Shimadzu Corporation, Japan) with distilled water as the reference. A calibration curve was plotted.
Solubility study
A solubility study involving nitrofurantoin with different polymers was performed at different ratios, as shown in Table 1. The polymers were melted in a beaker and nitrofurantoin was added to each beaker in ratios of 1:0.5, 1:1, and 1;1.5 under continuous stirring to mix nitrofurantoin uniformly. After solidification, the mass was transferred to a flask containing water, shaken for 72 h, then diluted to obtain the absorbance using a UV spectrophotometer set to 340 nm. The readings were repeated and plotted, as previously described [18].
Table 1 Solubility Analysis
| Batch | Solubility (mg/ml) |
|---|---|
| NF-Poloxamer 188 (1:0.5) | 0.619 |
| NF-Poloxamer 188 (1:1) | 0.950 |
| NF-Poloxamer 188 (1:1.5) | 0.637 |
| NF-PEG 6000 (1:0.5) | 0.576 |
| NF-PEG 6000 (1:1) | 0.817 |
| NF-PEG 6000 (1:1.5) | 0.657 |
| NF-Gelucire 50/13 (1:0.5) | 0.694 |
| NF-Gelucire 50/13 (1:1) | 0.687 |
| NF-Gelucire50/13 (1:1.5) | 0.711 |
Experimental design
The concentration of poloxamer 188 emerged as a crucial factor in the formulation, whereas trituration time was identified as a critical aspect of the process. The impact of altering 3 levels (−1, 0, and +1) of the key process and formulation parameters on the critical quality attributes of the optimized formulation was methodically evaluated using a 32 factorial design. Both the quantity of nitrofurantoin used and the length of time the nitrofurantoin was stirred were constant throughout the trial.
Solid dispersion method
One gram of the nitrofurantoin/polymer samples was used to create mixtures of propylene glycol (PG) and each polymeric excipient at a 3:1 ratio. After dissolving the samples in 50 ml of acetone for 20 min while stirring, the samples were moved to a flask with a circular bottom. A rotavapor (Rotary Evaporator IKA Make RV 10 Digital, Pune, Maharashtra, India) was used to extract acetone at 40°C. After evaporation, the remaining solvent was extracted from the particles in the flask by vacuum-drying for a further 24 h. After 10 min of grinding, the solid material was sieved using an 80-μm sieve [18].
Fourier transform infrared (FTIR) spectroscopy analysis
The current study was performed using an IR spectrophotometer (Agilent Cary 630 FTIR spectrometer, USA) with a dry potassium bromide mixture and scanned between 4000 and 500 cm−1 [19].
Differential scanning colorimetry (DSC) analysis
Thermograms were obtained using DSC for nitrofurantoin, poloxamer 188, the physical mixture, and the optimized SD. The recordings were made using a nitrogen flow rate of 30 milliliters per minute and a heating rate of 10° per minute, covering a range of 40°C to 360°C [19].
Powder X-ray diffraction (PXRD) analysis
The PXRD patterns of the pure medication, polymer, physical mixing, and optimum formulation were collected using a diffractometer (Rigaku, Auburn Hills, MI USA). The samples were scanned at a rate of 20°C/min between 2θ values of 10 and 80.
In vitro dissolution study
The dissolving characteristics of the nitrofurantoin from the melt granulates were evaluated by comparing to a commercial formulation (Niftran 100mg Capsule, sun pharmaceuticals, Vadodara, Gujrath, India) using the basket method. The experiment was carried out in a 900-ml vessel with 0.1 N HCl as the dissolution media at 37 ± 0.5°C and a constant speed of 75 rpm. Test solution samples (5 ml each) were manually removed at regular intervals for up to 1 h. The removed samples were then replaced with an equivalent volume of new media at the same temperature to confirm sink conditions were maintained. After suitable dilution, the obtained samples were examined for the presence of nitrofurantoin. Using a UV spectrophotometer, the amount of dissolved nitrofurantoin was measured at 241 nm and the percentage cumulative drug release was computed.
Pharmacokinetic study
Animals
Healthy Wistar albino rats of both sexes, weighing 180–240 grams, were used to measure a variety of pharmacokinetic characteristics. The animals were housed in cages that were maintained according to standard operating protocols. The animals had unlimited access to regular food and water. The rats fasted for an entire night before the studies began with water available. The Institutional Animal Ethical Committee approved the experimental procedure (approval no. IAEC/Sangli/2022-2023/03).
Animal grouping
Three groups of three rats each were created at random. A 50 mg/kg oral dosage of the drug solution, diluted in 1% carboxymethyl cellulose, was administered to Group I. Groups II and Group III were administered the optimized formulation and marketed formulation, respectively. Initially, the rats were anesthetized using mild chloroform anesthesia. The blood samples (0.5 mL) were obtained at intervals (0.5, 1, 2, 4, and 12 h) via retro-orbital puncture. The plasma samples were centrigued at 4000 rpm for 10 min at 4°C and stored at −20°C until the experiments were completed.
Sample preparation
After plasma samples achieved equilibrium at room temperature, the samples were put into Eppendorf tubes. Each tube was then filled with 200 μL of diethyl ether and vortexed for 2 min. Following a 10-min centrifugation at 4000 rpm, HPLC (LC- 4000 Jasco Tokyo, Japan) analysis was performed on the clear supernatant. An HPLC system with a UV/visible detector, a C18 column (250 × 4.6 mm, 5 μm), and an R-HPLC pump was used for the HPLC study. The mobile phase consisted of acetonitrile (30:70 v/v) and phosphate buffer (pH 3.3). The column temperature was maintained at 40°C, the wavelength was set at 241 nm, and the flow rate was set at 1 mL/min.
Pharmacokinetic parameters estimation
A non-compartmental approach was used to calculate the pharmacokinetic parameters. The Cmax and Tmax were computed. The AUC0–∞ was computed using the trapezoidal rule.
Results and discussion
PEG 6000 at a concentration of 1:1.5 demonstrated the maximum solubility when nitrofurantoin was compared to different polymers, as follows: PEG 6000 (1:1) > gelucire 50/13 (1:1.5) > gelucire 50/13 (1:1), as shown in Table 1. Additional polymeric materials exhibited rather low solubilities. FTIR, DSC, and XRD all showed that there were no drug carrier interactions.
Experimental design
Equations with statistically significant F ratios (P < 0.05) had adjusted R2 values in the range of 0.9–1 (Tables 2 and 3) and non-significant lack of fit values (P > 0.05) were produced by the regression analysis of the experimental runs.
Table 2 Preparation of Melt Granulates with 32 Factorial Designs
| Formulation Code | Independent Variables | Dependant Variables | ||||
|---|---|---|---|---|---|---|
| Y1 | Y2 | |||||
| X1 | Poloxamer 188 Concentration (%) | X2 | Trituration Time (min) | Solubility (mg/ml) | Drug Release at 45 min (%) | |
| NF1 | −1 | 0.5 | +1 | 45 | 0.657 ± 0.011 | 87.69 ± 1.3 |
| NF2 | 0 | 1 | +1 | 45 | 0.705 ± 0.008 | 94.38 ± 1.5 |
| NF3 | +1 | 1.5 | +1 | 45 | 0.743 ± 0.010 | 98.71 ± 1.8 |
| NF4 | −1 | 0.5 | 0 | 30 | 0.637 ± 0.012 | 84.88 ± 1.6 |
| NF5 | 0 | 1 | 0 | 30 | 0.697 ± 0.009 | 93.46 ± 2.2 |
| NF6 | +1 | 1.5 | 0 | 30 | 0.732 ± 0.014 | 98.58 ± 1.7 |
| NF7 | −1 | 0.5 | −1 | 15 | 0.619 ± 0.014 | 82.33 ± 1.3 |
| NF8 | 0 | 1 | −1 | 15 | 0.688 ± 0.007 | 91.32 ± 2.3 |
| NF9 | +1 | 1.5 | −1 | 15 | 0.711 ± 0.008 | 95.90 ± 1.6 |
Table 3 Statistical Analysis of Design
| Responses | Sources | ||||
|---|---|---|---|---|---|
| Model P-value | Adj-R2 | Lack of Fit Test P-value | |||
| Solubility (mg/ml) | 0.0001 | 0.9531 | 0.1227 | ||
| DR45 (%) | 0.0008 | 0.9902 | 0.2489 | ||
The mean standard deviation (n = 3) was used to express all values, where +1 denotes a higher level, −1 is a lower level, and 0 is the median. The data fit these model equations quite well. When the sign was positive, there was antagonism; when the sign was negative, there was synergy.
 (1)
(1)
 (2)
(2)
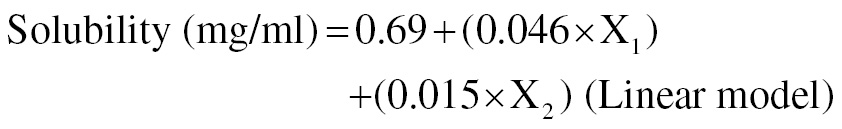
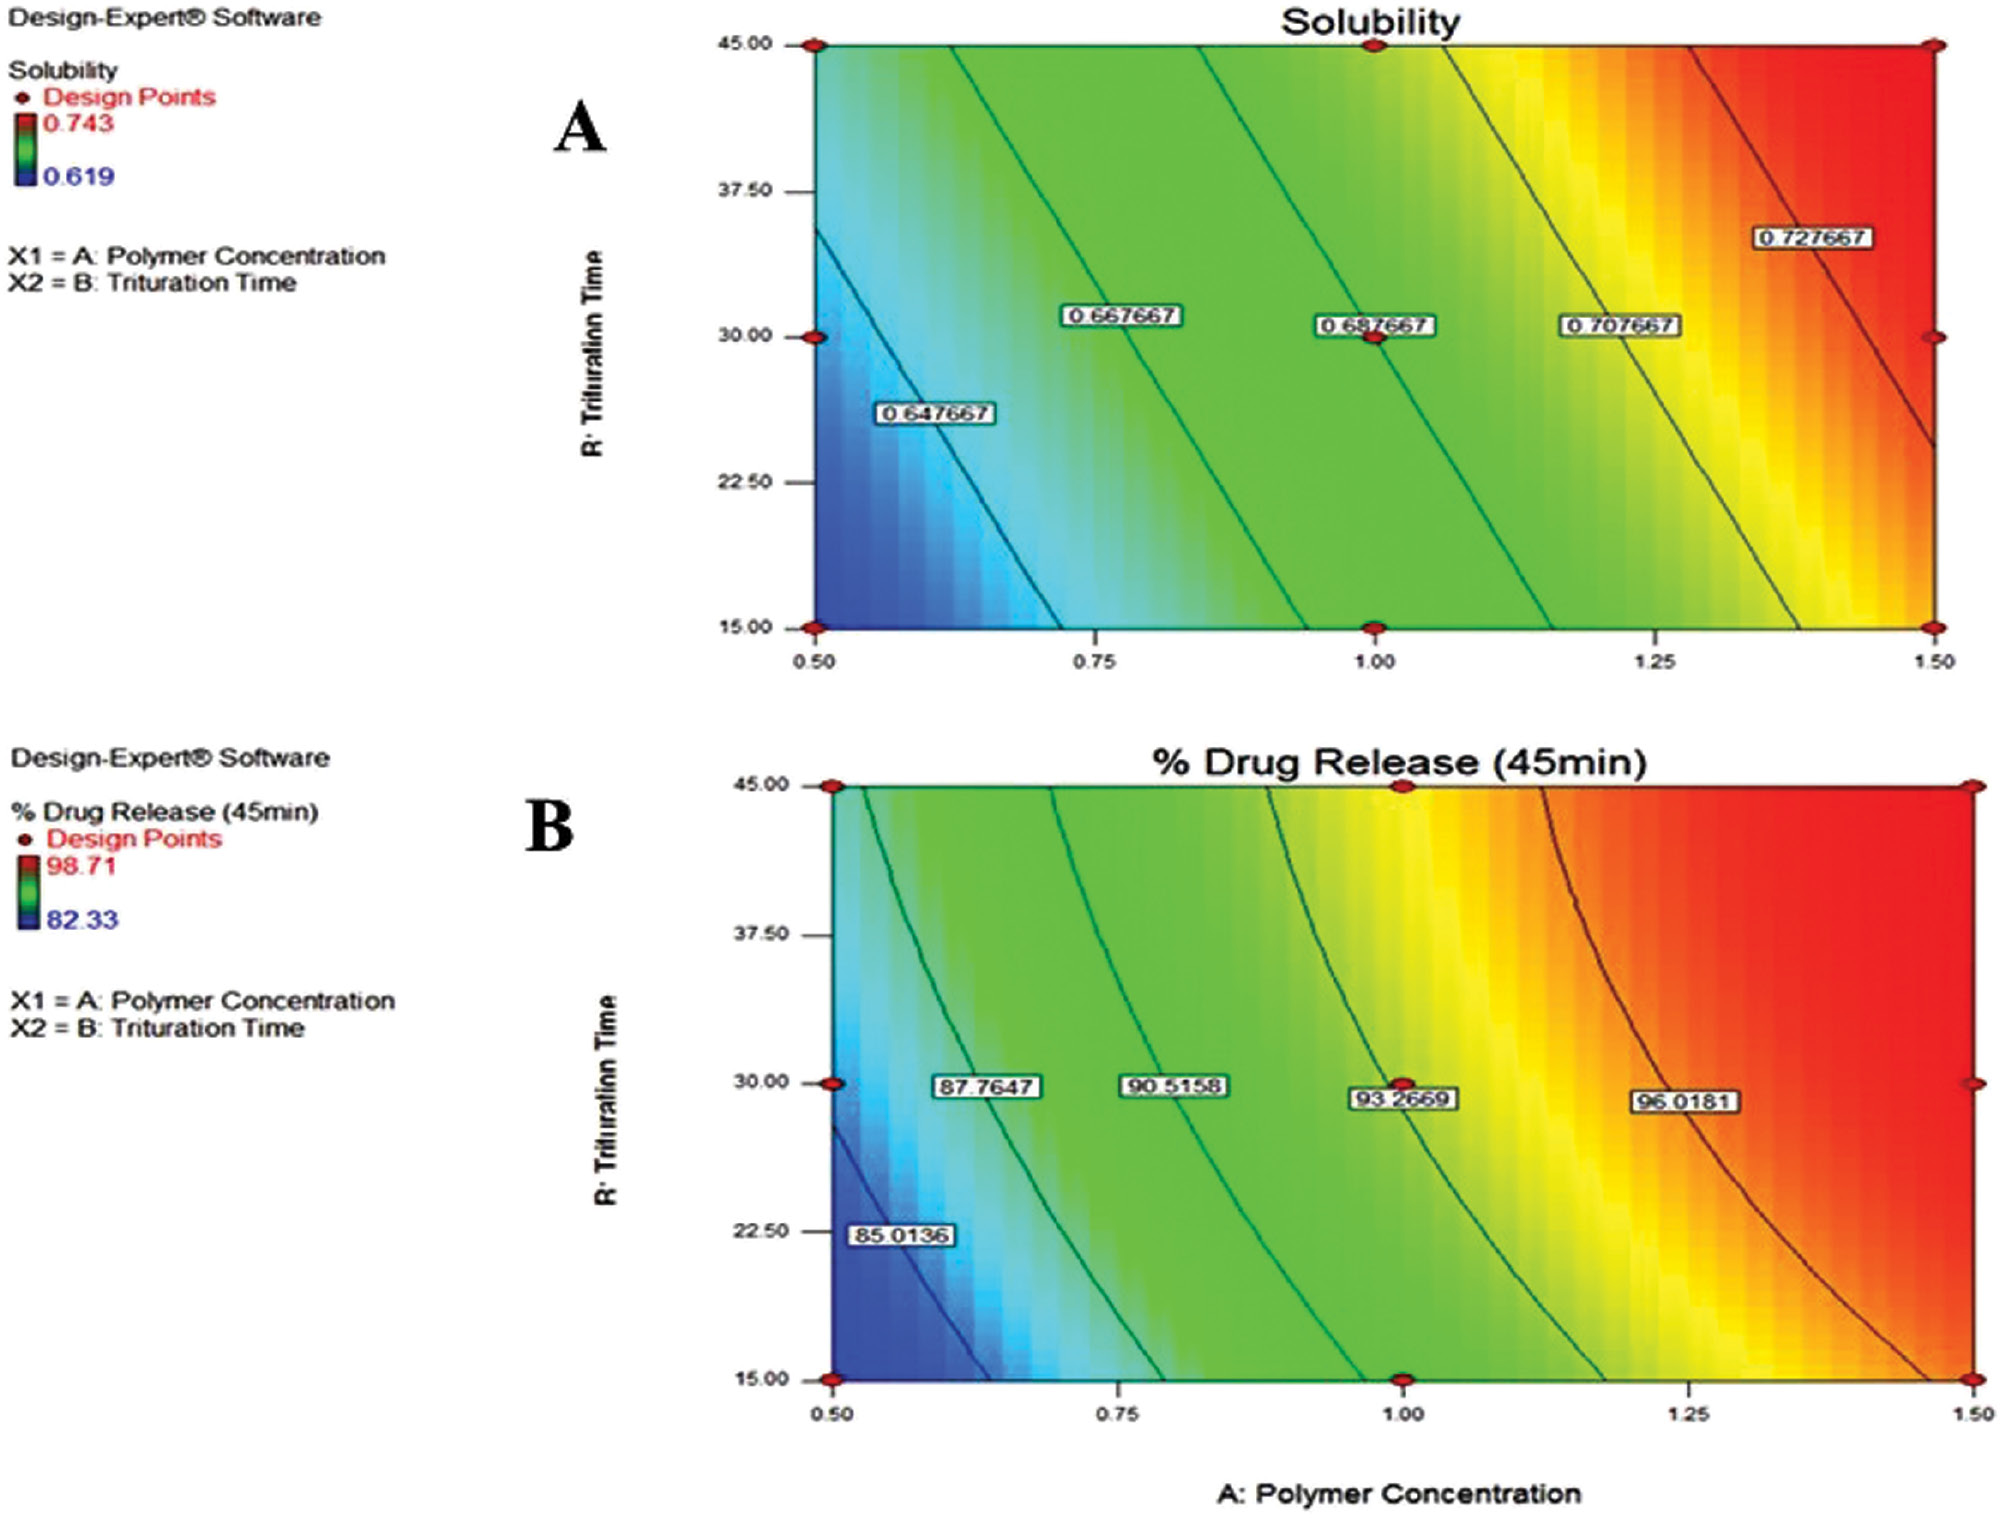
The poloxamer 188 concentration and trituration duration were shown to enhance solubility (mg/ml [Equation 1]). The rate of stirring was inversely linked to DE45 (%), as shown in Figure 1 (Equation 2). The concentration of poloxamer 188 was directly related to DR45 (%), as shown in Figure 2.
Figure 1 3D surface response plots with the effect of poloxamer 188 concentration (%) and trituration time (min) on (A) solubility and (B) DR45 (%).
Figure 2 Contour plots with the effect of poloxamer 188 concentration (%) and trituration time (min) on (A) solubility and (B) DR45 (%).
By examining the desirability function, Design-Expert was utilized to determine the optimal formulation. The results of verifying the model are shown in Table 4, which also compares the predicted and observed solubility and DR45 (%) values according to the model equations.
Table 4 Observed and Predicted Values of the Experiment
| Factors | Predicted Value | Observed Value* | |||
|---|---|---|---|---|---|
| Poloxamer 188 Concentration (%) | Trituration Time (min) | Solubility (mg/ml) | DE45 (%) | Solubility (mg/ml) | DE45 (%) |
| 1.5 | 45 | 0.708 | 98.96 | 0.743 ± 0.010 | 98.71 ± 1.8 |
*All values are the mean ± SD (n = 3).
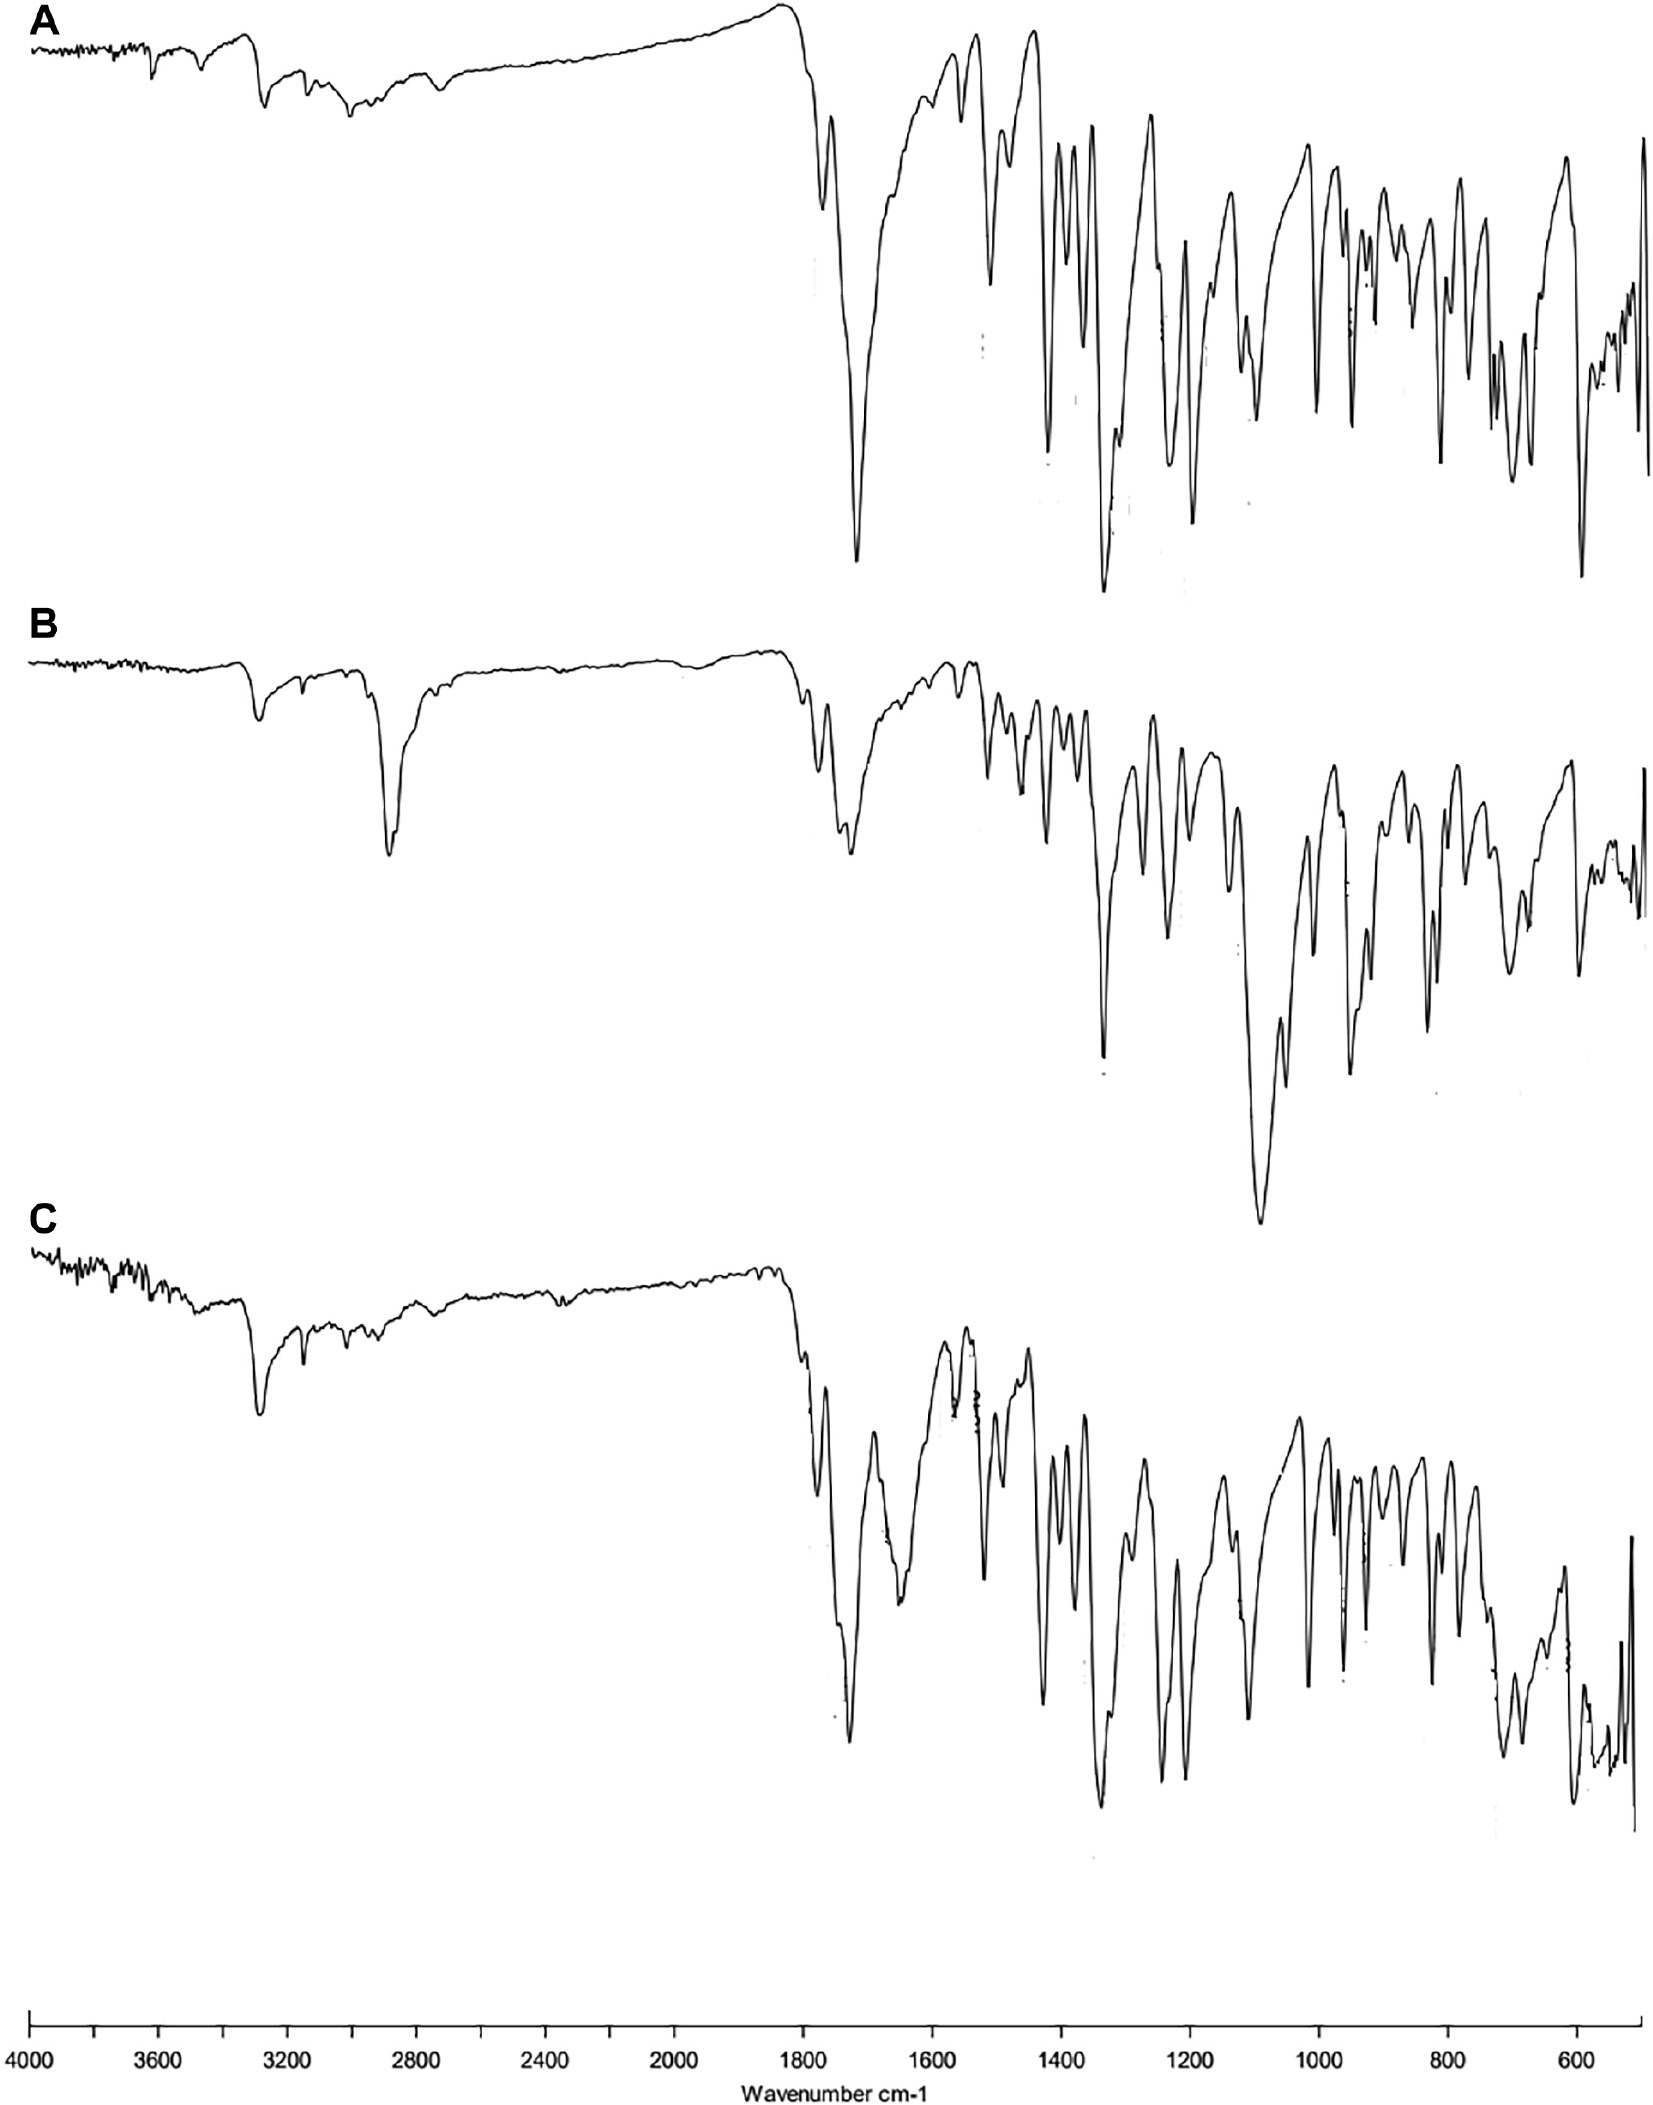
FTIR
The spectra of the pure drug showed peaks at 3312.48 cm−1 (N-H stretch), 1641.52 cm−1 (C=O stretch), 1568.41 cm−1 (N-H bending), 1513.12 cm−1 (C=C stretch), and 743.14 cm−1 (aromatic stretch; Figure 3). The FT-IR spectra of formulations showed nearly all the peaks without affecting the position and trends, which indicated the absence of well-defined interactions.
Figure 3 FTIR spectra of (A) pure drug, (B) physical mixture, and (C) optimized formulation.
XRD
Sharper diffraction peaks indicate more crystalline nitrofurantoin. The peaks were noted with decreased intensities at the same positions in the physical mixture (Figure 4). The diffraction patterns of the optimized formulation were somewhat diffuse compared to pure drug, indicating that crystallinity was decreased.
Figure 4 PXRD pattern of (A) pure drug, (B) physical mixture, and (C) optimized formulation.
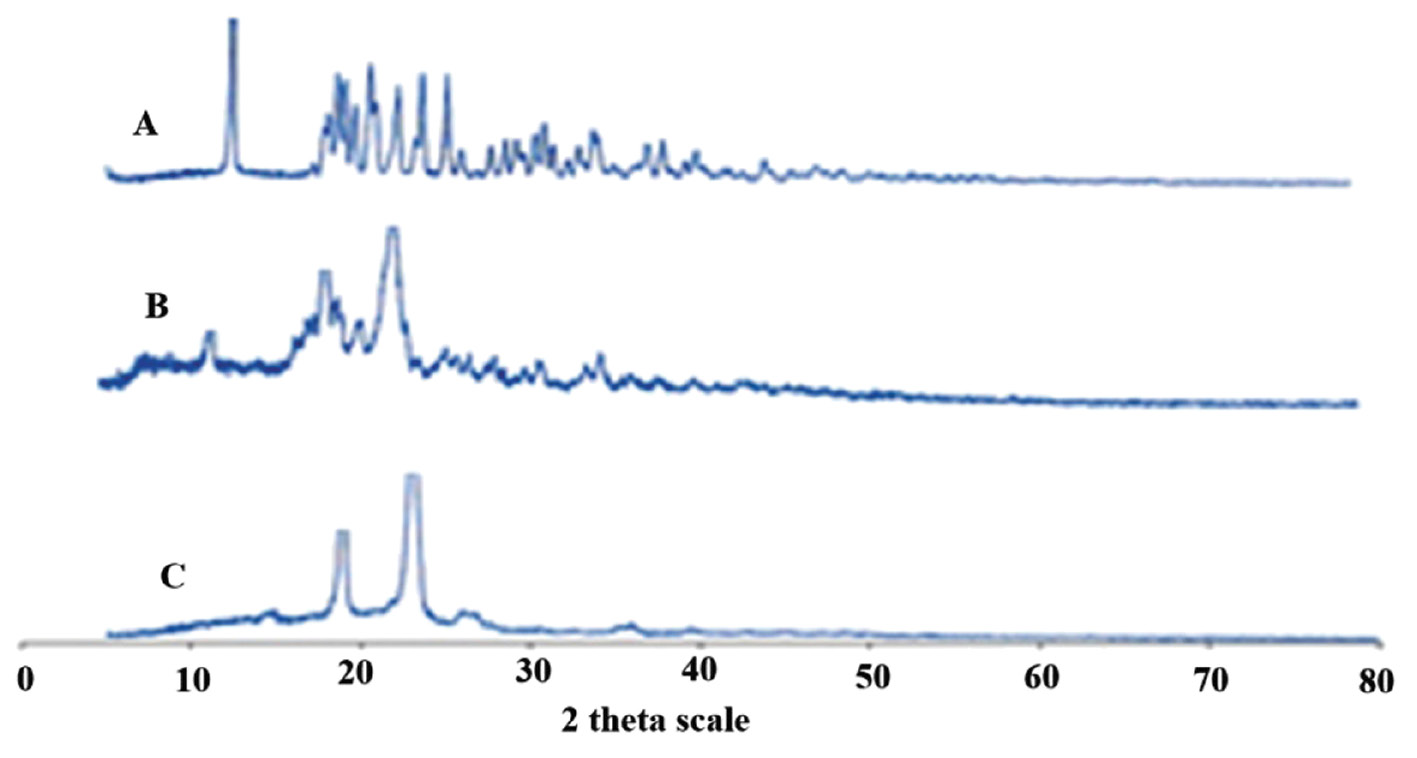
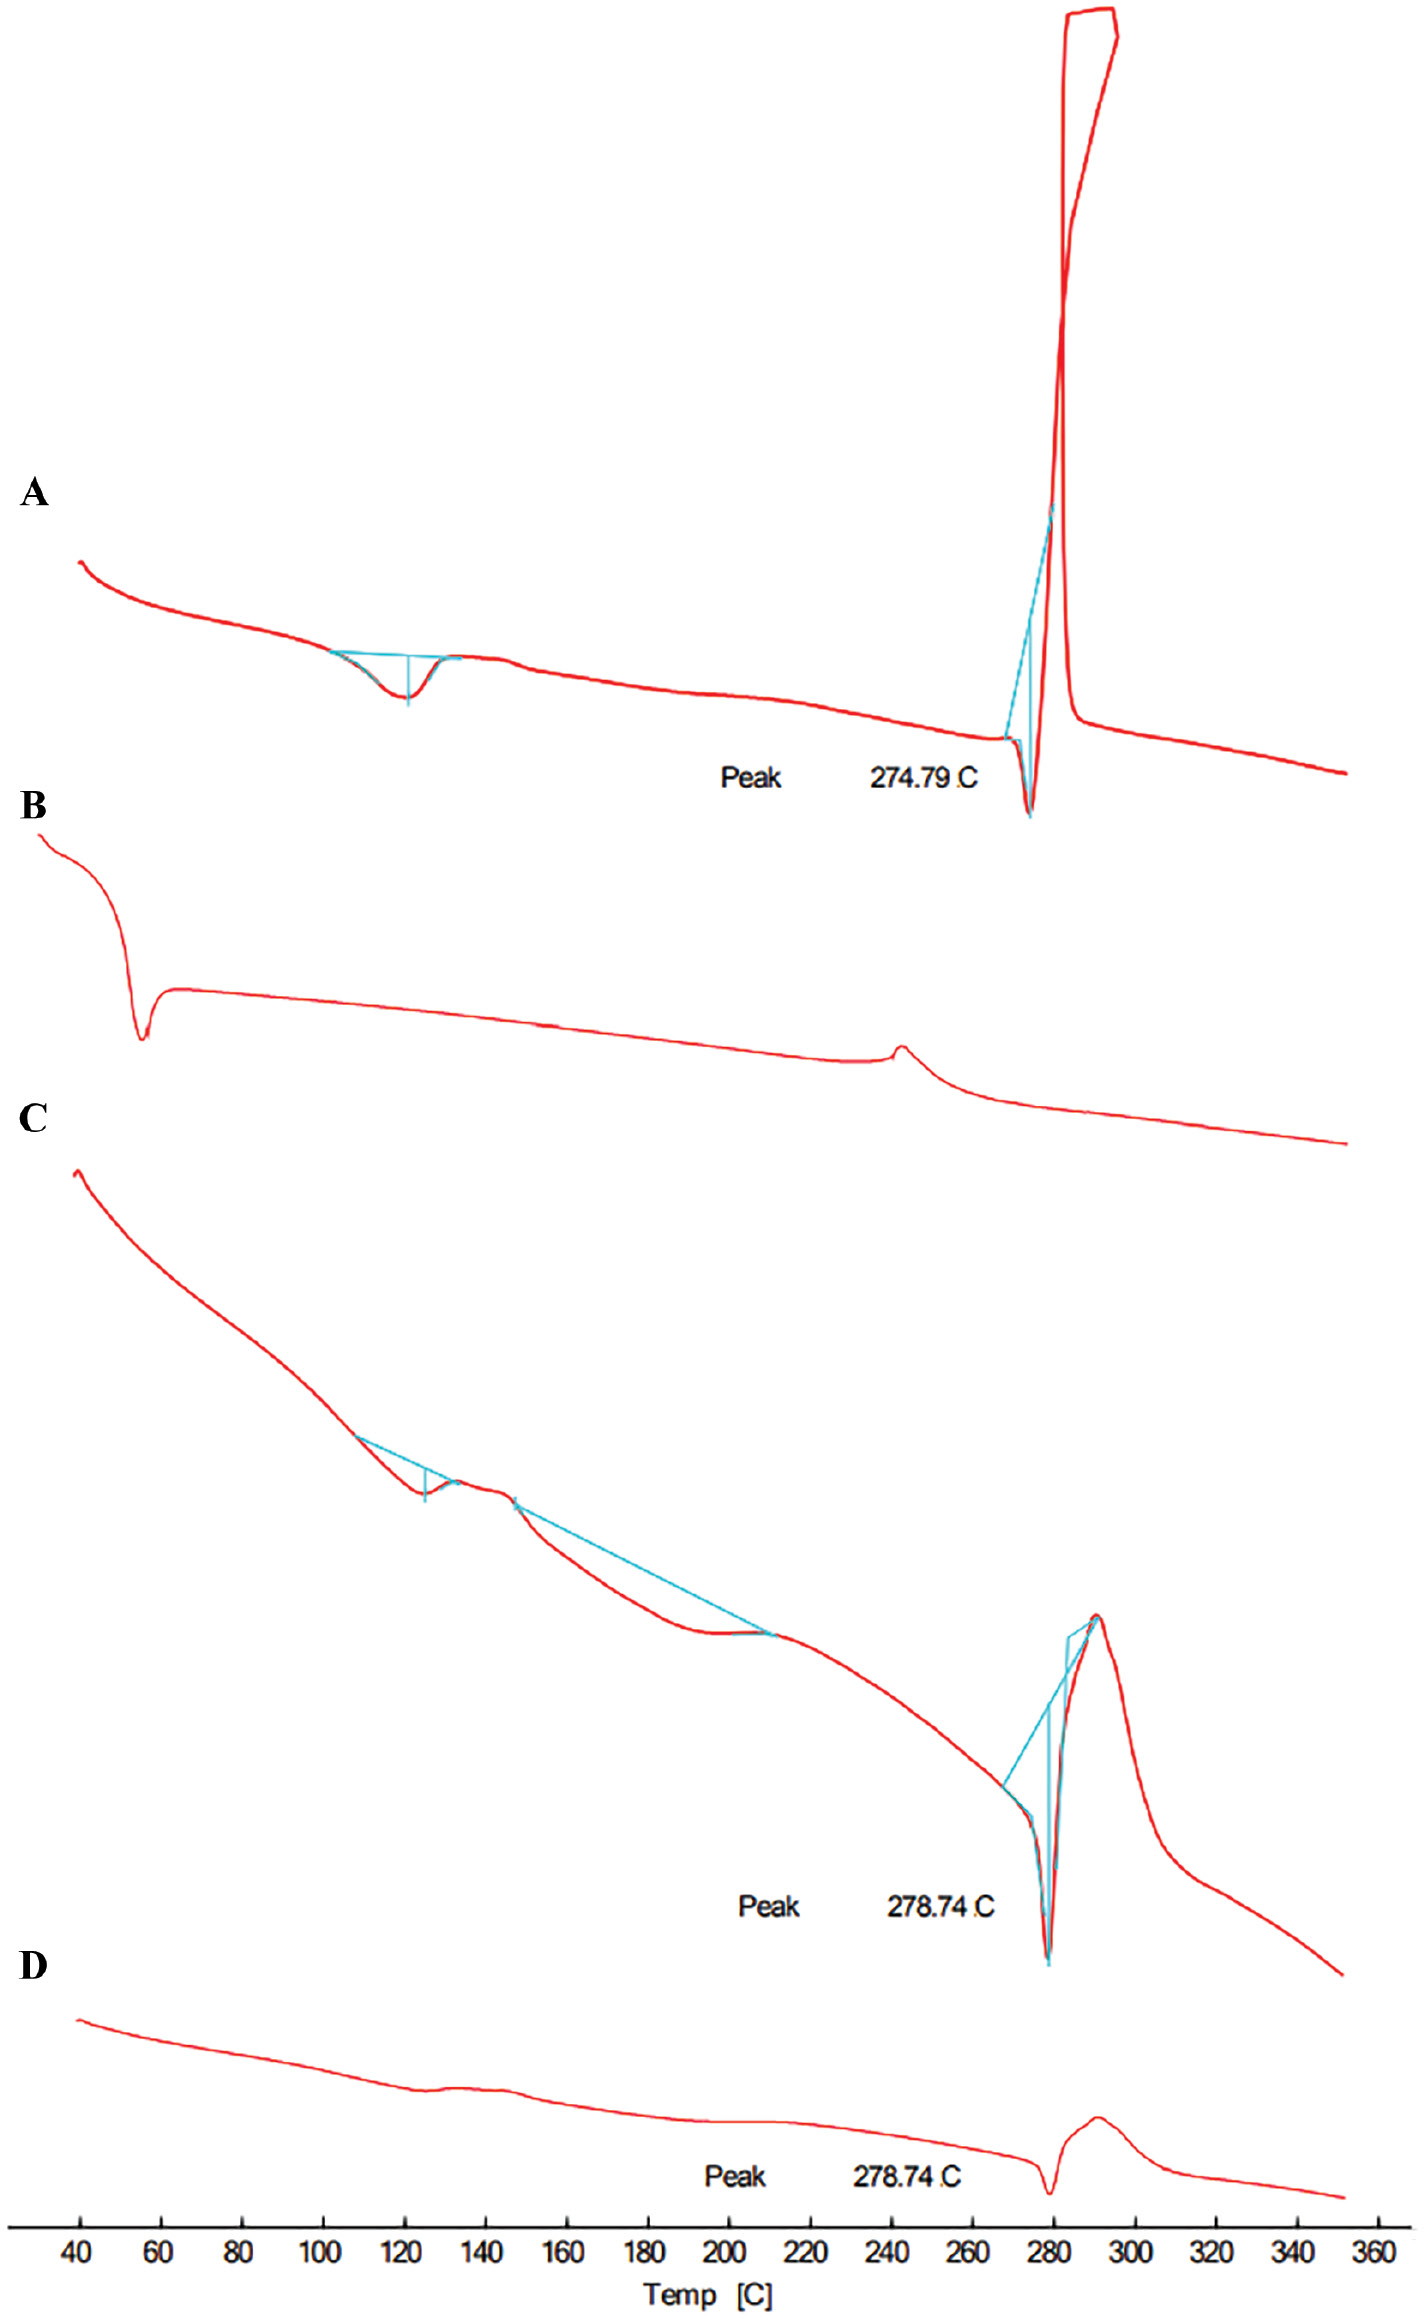
Figure 5 displayed a clear melting peak at 274.79°C in the DSC thermogram of nitrofurantoin, showing that the molecule had a crystalline structure. Subsequently, an exothermic peak was observed, which is indicative of drug melting and subsequent decomposition. The endothermic peaks of the physical mixture and the final medication formulation were attenuated to 278.74°C in the testing. This finding could be because the medication dissolves into the molten polymer, which might be the reason for decreased post-melting degradation of the drug. As can be seen from the results presented above, both crystallinity and main interactions were stable throughout the drug formulation process.
Figure 5 DSC of (A) nitrofurantoin, (B) poloxamer 188, (C) physical mixture, and (D) solid dispersion.
In vivo study
After administration of the prepared formulation, marketed formulation, and pure drug, different pharmacokinetic parameters were estimated and compared. The estimated pharmacokinetic parameters are reported in Table 5. Compared to pure drug dispersion, the optimized formulation exhibited a 3.88-fold improvement in the bioavailability of nitrofurantoin compared to the marketed formulation (1.77-fold enhancement in bioavailability).
Table 5 Pharmacokinetic Parameter
| Formulation | Cmax (μg/ml) | tmax (h) | t1/2 (h) | Ke (h−1) | AUC0–18h (μg.h/ml) | MRT (h) |
|---|---|---|---|---|---|---|
| Pure drug dispersion | 0.637 ± 0.091 | 2.1 | 1.74 ± 0.19 | 0.398 | 1.198 ± 0.093 | 1.116 |
| Optimized formulation | 2.124 ± 0.063 | 2.2 | 1.96 ± 0.12 | 0.353 | 4.651 ± 1.121 | 2.004 |
| Marketed formulation | 1.607 ± 0.039 | 2.0 | 1.92 ± 0.09 | 0.360 | 2.631 ± 0.453 | 1.857 |
All values are the mean ± standard deviation (n = 6).
Conclusion
The purpose of this work was to improve the solubility, dissolution, and bioavailability of nitrofurantoin using a SD formulation. Employing a 32 factorial design, SDs were developed with poloxamer 188 and trituration time as variables. Poloxamer 188 at a 1:1 ratio exhibited optimal solubility enhancement. The poloxamer 188 concentration directly correlated with DR45 (%), while the stirring rate inversely affected the DR45 (%). FTIR confirmed excellent drug-excipient compatibility and XRD/DSC revealed decreased drug crystallinity in the optimized formulation. The optimized SD exhibited a 3.88-fold improvement in bioavailability over pure drug dispersion and 1.77-fold over the marketed formulation. This study underscores SD potential in enhancing poorly soluble drugs like nitrofurantoin.
Conflict of interest
The authors declare that there are no conflicts of interest.
References
- Varshney HM, Chatterjee A. Solubility enhancement of poorly hydrophilic drugs by using different newer techniques: a review. Int J Ther Appl 2012;6(8):8-13.
- Wairkar SM, Gaud RS. Solid dispersions: solubility enhancement technique for poorly soluble drugs. Int J Res Pharm Biomed Sci 2013;4(3):847-54.
- Pawar AR, Choudhari PD. Novel techniques for solubility, dissolution rate and bioavailability enhancement of class II and IV drugs. Asian J Biomed Pharm Sci 2012;2(13):9-14.
- Kumar KV, Arunkumar N, Verma PR, Rani C. Preparation and in vitro characterization of Valsartan solid dispersions using skimmed milk powder as carrier. Int J PharmTech Res 2009;1(3):431-7.
- Reddy N, Reddy A, Srinivasan S, Kavitha K, Kumar R, et al. Review on: better solubility enhancement of poorly water-soluble drugs. IJIPS 2013;1(4):267-73.
- Argade PS, Magar DD, Saudagar RB. Solid dispersion: solubility enhancement technique for poorly water soluble drugs. J Adv Pharm Edu Res 2013;3(4):427-39.
- Saffoon N, Uddin R, Huda N, Sutradhar KB. Enhancement of oral bioavailability and solid dispersion: a review. J App Pharm Sci 2011;1(7):13-20.
- Rosemarie O, Heinz E. Physicochemical properties of antibacterial compounds: implications for drug discovery. J Med Chem 2008;51(10):2871-8. [PMID: 18260614 DOI: 10.1021/jm700967e]
- Leeson PD, Davis AM. Time-related differences in the physical property profiles of oral drugs. J Med Chem 2004;47:6338-48. [PMID: 15566303 DOI: 10.1021/jm049717d]
- Al-Obaidi H, Buckton G. Evaluation of griseofulvin binary and ternary solid dispersions with HPMC AS. AAPS PharmSciTech 2009;10:1172-7. [PMID: 19842041 DOI: 10.1208/s12249-009-9319-x]
- Munoz-Davila MJ. Role of old antibiotics in the era of antibiotic resistance. Highlighted nitrofurantoin for the treatment of lower urinary tract infections. Antibiotics (Basel) 2014;3(1):39-48. [PMID: 27025732 DOI: 10.3390/antibiotics3010039]
- Hussain A, Smith G, Khan KA, Bukhari NI, Pedge NI, et al. Solubility and dissolution rate enhancement of ibuprofen by co-milling with polymeric excipients. Eur J Pharm Sci 2018;123:395-403. [PMID: 30076953 DOI: 10.1016/j.ejps.2018.08.001]
- Singh N, Gandhi S, McArthur E, Moist L, Jain AK, et al. Kidney function and the use of nitrofurantoin to treat urinary tract infections in older women. Can Med Assoc J 2015;187(9):648-56. [PMID: 25918178 DOI: 10.1503/cmaj.150067]
- Kannigadu C, N’Da D. Recent advances in the synthesis and development of nitroaromatics as anti-infective drugs. Curr Pharm Des 2020;26(36):4658-74. [PMID: 32228417 DOI: 10.2174/1381612826666200331091853]
- Dobrek L. Lower urinary tract disorders as adverse drug reactions–a literature review. Pharmaceuticals 2023;16(7):1031. [PMID: 37513941 DOI: 10.3390/ph16071031]
- Aladawi M, Shelly S, Dyck PJ, Koster M, Engelstad J, et al. Nitrofurantoin and minocycline–associated vasculitic neuropathy: case reports and literature review. J Clin Neuromuscul Dis 2022;24(2):85-94. [PMID: 36409339 DOI: 10.1097/CND.0000000000000404]
- Raijada D, Arnfast L, Bond AD, Aho J, Bøtker J, et al. Dehydration of nitrofurantoin monohydrate during melt extrusion. Cryst Growth Des 2017;17(7):3707-15. [DOI: 10.1021/acs.cgd.7b00316]
- Nyavanandi D, Narala S, Mandati P, Alzahrani A, Kolimi P, et al. Twin screw melt granulation: alternative approach for improving solubility and permeability of a non-steroidal anti-inflammatory drug ibuprofen. AAPS PharmSciTech 2023;24(1):47. [PMID: 36703024 DOI: 10.1208/s12249-023-02512-z]
- Nyavanandi D, Mandati P, Narala S, Alzahrani A, Kolimi P, et al. Feasibility of high melting point hydrochlorothiazide processing via cocrystal formation by hot melt extrusion paired fused filament fabrication as a 3D-printed cocrystal tablet. Int J Pharm 2022;628:122283. [PMID: 36244563 DOI: 10.1016/j.ijpharm.2022.122283]