Formulation and Evaluation of Budesonide-loaded Nanosponges for Colon-specific Drug Delivery Systems
1Department of Pharmaceutics, Shree Panchvati Education Society’s SNPT Institute of Pharmacy, Nashik 422003, Maharashtra, India
2Department of Pharmaceutics, MET’s Institute of Pharmacy, Bhujbal Knowledge City, Adgaon, Nashik 422003, Maharashtra, India
*Correspondence to: Chetana Kapadne, Assistant Professor (M. Pharm, Pharmaceutics), Shree Panchavati Education Society’s SNPT Institute of Pharmacy, Near Nimani Bus Stand, Panchvati, Nasik 422003, Maharashtra, India. Mobile: +8554976636, E-mail: chetana.kapadne.ck@gmail.com
Received: May 14 2024; Revised: June 6 2024; Accepted: July 4 2024; Published Online: July 31 2024
Cite this paper:
Kapadne C, Birari S, Gulecha V et al. Formulation and Evaluation of Budesonide-loaded Nanosponges for Colon-specific Drug Delivery Systems. BIO Integration 2024; 5: 1–12.
DOI: 10.15212/bioi-2024-0024. Available at: https://bio-integration.org/
Download citation
© 2024 The Authors. This is an open access article distributed under the terms of the Creative Commons Attribution License (https://creativecommons.org/licenses/by/4.0/). See https://bio-integration.org/copyright-and-permissions/
Abstract
Background: The purpose of this work was to complex budesonide with cyclodextrin-based nanosponges to improve its solubility and stability. The current study focused on polysaccharide systems that have undergone minimal chemical alteration and have been used to target the colon. These targeted delivery and polysaccharide-based complexation methods are anticipated to aid in the creation of medication formulations for disorders affecting the colon, such as colorectal cancer. The goal of the current work was to use a Quality by Design (QbD) strategy to create budesonide-loaded nanosponges. The system consisted of nanosponges loaded with budesonide.
Methods: Nanosponges were formulated through microwave-assisted synthesis. Studies on drug release were conducted with a method changing power of hydrogen (pH) with enzyme. Quality by Design-based optimization with a 32 full factorial design was applied for the optimization of the process parameters including the β-cyclodextrin:diphenyl carbonate ratio and the reaction time. Responses were measured for three dependent variables: practical yield, percentage drug release, and percentage drug release at the fifth hour.
Results and Conclusions: The optimization model indicated a yield of 76.21%, a percentage drug release at the fifth hour of 24.61%, and a total drug release after 7 hours of 87.58%. The observed responses of the optimized process closely matched the predicted values. The above budesonide-loaded nanosponge formulations provide a targeted medicine for the colon and may be an effective method for treating colonic illness.
Keywords
Budesonide, colonic drug delivery, nanosponges, quality by design.
Introduction
The development of nano-technology-based products is an emerging trend in medicinal fields [1]. To ensure the quality and safety of the final products, most regulatory authorities recommend using the QbD concept, which enables both time and cost savings [2]. This work was also aimed at maximizing yield & minimizing reaction time by optimizing the reaction condition through the QbD approach (Table 1).
Table 1 Difference between the Traditional Approach and QbD Approach [12]
| Aspects | Traditional Approach | QbD Approach |
|---|---|---|
| Pharmaceutical Development | Empirical | Systematic, multivariate experiments |
| Quality | Assured by testing and inspection | Built into products and processes by design; based on scientific understanding |
| Manufacturing Process | “Frozen process” discourages changes | “Flexible process” is adjustable within design space |
| Product Specifications | Based on batch history | Based on product performance requirements |
| Control Strategy | Intermediate and end product testing | Risk based |
| Focus | Reproducibility: avoids or ignores variation | Robustness: understand and control variation |
| Lifecycle Management | Post approval changes are needed | Continuous improvement enabled within design space |
For drug delivery, the oral route is considered most convenient. However; drug bioavailability is significantly affected when the drug travels through variable environments in the gastro intestinal tract (GIT). This effect is particularly considerable for drugs that must target colon sites in diseases including colorectal cancer and ulcerative colitis, and that are unstable in the upper GIT. This issue can be resolved by creating targeted drug delivery systems that release the medication only after it enters the colon, but resist release in the stomach and intestines. Such formulations are known as colon-specific drug delivery systems [3]. To formulate successful colon-specific drug delivery systems, two factors must be considered: the colonic microflora and site pH. The colon is rich in microorganisms and contains more than 400 species of bacteria and fungi [3]. The average pH range of the caecum and colon lumen is 6.8–7.0, and the terminal ileum has the highest pH (7.5–8.0) [4]. The colon site microflora secrete several enzymes for the breakdown of polysaccharides which is not present at any other site of the GIT. This aspect serves as a basis for the development of formulations containing polysaccharides such as β-cyclodextrins (BCDs) [5]. Polysaccharide-based microbial enzyme triggering mechanisms are considered the most reliable colonic delivery route. Numerous hydrolytic and reducing enzymes ferment these polysaccharides, thereby releasing the medication into the colon. The upper half of the gastrointestinal system, comprising the stomach and duodenum, has a microbiota content below 103–104 CFU/mL, whereas the microflora of the colon ranges from 1 011 to 1 012 CFU/mL. This aspect ensures selectivity for colon medication administration. BCD has been extensively explored in formulations enabling continuous release of medicines, notably in the colon. In this work, however, the inclusion-complex-forming property of BCD was used to transport the medication into the colon. Because BCD is digested by alpha-amylase in the colon breaks down BCD, therefore it may be possible to transfer the medication to the site of action more successfully [5–7].
BCDs are not absorbed or hydrolyzed in the small intestine or stomach. The extensive microflora present in the colon breaks BCDs into small saccharides and facilitates their absorption in the colon [8, 9].
Recently, a novel concept using nanosponges, based on a combination of nanotechnology and BCD, has been developed to target the colon specifically. BCDs react with several crosslinking agents, including carboxylic acids, pyromellitic anhydride, and activated carbonyl compounds, thus creating unique nanoporous materials [10]. The reaction creates a three-dimensional structure composed of BCD units that contain hydrophilic and hydrophobic nano-sized gaps enabling the encapsulation, transportation, and selective release of various organic and inorganic entities. These properties have significant uses in pharmaceutics, biomedicine, cosmetic, bioremediation processes, water purification, catalysis, agrochemistry, gas entrapping & other fields due to their high inclusion constants of around 108–109 [11]. Limitations in drug efficacy and delivery, as well as associated adverse effects, have prompted researchers to search for nanocarriers with unique properties, optimal effectiveness, specificity, and minimal adverse effects. One effective solution is using nanostructures to transport antiviral drugs or other formulations. Biocompatibility, porosity, biomimetic features, sustained release behavior, and therapeutic activity (e.g., antimicrobial action against pathogenic bacteria) are some advantages of nanosponges in this context. As such, nanosponges may be a good candidate for enhancing the bioavailability, stability, and solubility of therapeutic agents or drugs to produce the intended pharmacokinetic effects [13].
BCD is enzymatically degraded by alpha-amylase enzymes. The alpha-amylase enzymes hydrolyze BCD’s alpha-1,4-glucoside linkages. BCD is believed to be destroyed by colonic bacteria rather than metabolized while passing through the small intestine.
Nanosponges can be prepared through a variety of methods. Microwave irradiation can substantially decrease the time required for the formation of nanosponges [14].
The primary objective of this research was to create a simple, cost-effective, and scalable process for synthesizing budesonide-loaded nanosponges. This work was also aimed at maximizing yield and minimizing reaction time by optimizing the reaction conditions through the QbD approach.
Shorter development times, fewer demands on human resources, more effective objective orientation, and reproducible results are all possible outcomes of QbD-based prediction [15, 16].
Materials and methods
A gift sample of budesonide with 98% purity was provided by Cipla Ltd. (Kurkumbh, Pune, India). BCD (KLEPTOSE®) with 98% purity was provided as a gift sample from Roquette, offering the best nature (Lestrem, France). is Diphenyl carbonate with 99% purity (CUN30779/PG/11) was purchased from Research-Lab Fine, Chem Industries (Mumbai, India) & Dimethyl formamide grade LR with 99% purity was purchased from SD fine-Chem Limited (Baroda, Gujarat, India) & used for synthesis.
Risk assessment through failure mode effect analysis
The Failure Mode Effect Analysis (FMEA) model, a frequently used risk management technique, facilitates assessment of possible process failure modes and how they might affect the quality of the final product. For determining the priority of all variables, we used a risk score matrix based on the overall risk priority number (RPN). Risk was quantified by assessment of each factor’s severity (S), probability (P), and detectability (D). The RPN score was calculated by multiplication of the S, P, and D scores for each risk factor (Tables 2 and 3) [17]
 (1)
(1)
Table 2 Score Scale [2]
| Rank | Failure | ||
|---|---|---|---|
| Occurrence | Severity | Detectability | |
| 1 | Unlikely to occur | Very low | Always |
| 2 | Occurs rarely | Low | Regular |
| 3 | Occasionally occurs | Moderate | Likely |
| 4 | Occurs moderately | High | Low |
| 5 | Occurs frequently | – | – |
Table 3 Failure Mode and Effects
| Sr. No | Risk Area | Failure Mode | Failure Effect | S | O | D | RPN |
|---|---|---|---|---|---|---|---|
| Raw Material | |||||||
| 1 | Drug sub’s | a) Particle size | Effects on dissolution rate and flow properties, content uniformity, and clinical performance | 4 | 4 | 3 | 48 |
| b) Solubility | Effects on dissolution rate and clinical performance | 4 | 4 | 3 | 48 | ||
| c) Presence of moisture | Effects on dissolution rate, flow properties, and clinical performance | 2 | 4 | 4 | 32 | ||
| 2 | Excipients | a) Change in the ratio of β-cyclodextrin to diphenyl carbonate | Decreasing percentage practical yield and decreasing entrapment efficiency; change in dissolution rate; effects on clinical performance | 4 | 5 | 4 | 80 |
| 3 | Microwave power level | Variation in watt power | Decreasing percentage practical yield and change in particle size, ultimately affecting dissolution rate | 3 | 5 | 4 | 60 |
| 4 | Drying | Improper drying | Effects on structure of nanosponges | 3 | 4 | 2 | 24 |
| 5 | Mixing | Improper mixing | Nonuniformity, affecting dissolution rate and flow properties | 4 | 3 | 3 | 36 |
| 6 | Reaction time | Decreasing reaction time | Decreasing percentage practical yield, affecting nanosponge structure and ultimately decreasing entrapment efficiency and dissolution rate; changes in clinical performance | 4 | 5 | 4 | 80 |
| 7 | Drug loading | Improper stirring | Decreasing entrapment efficiency, dissolution rate, content uniformity, and changes in clinical performance | 4 | 4 | 3 | 48 |
(Sub’s: Substance; S: Severity ranking; O: Probability of occurrence; D: Probability of detection; RPN: Risk priority number).
Improvement index (II, Jain [12]):
 (2)
(2)
Formulation of BCD-based nanosponges
In a 250 ml flask, BCD and diphenyl carbonate (DPC) were dissolved in dimethyl formamide and microwaved in Cata’s scientific microwave system. The temperature was measured with a fiber optic probe installed in the microwave chamber. The reaction conditions used for trial batches were maintained as described in Table 4. The nanosponges were prepared at 280 W and 320 W; however; the nanosponges formed at 280 W showed the highest yield. Hence, 280 W was considered optimal for further studies [14].
Table 4 32 Factorial Design
| Formulation Variables | Level Coded | Dependent Variable | ||
|---|---|---|---|---|
| −1 | 0 | +1 | ||
| X1 = BCD:DPC (ratio) | 2 | 4 | 6 | Y1 = Percentage practical yield (%) |
| X2 = time (min) | 10 | 15 | 20 | Y2 = Percentage drug release (%) Y3 = Percentage drug release at the fifth hour |
Drug loading
Nanosponges were pre-treated to achieve a median particle size below 500 nm. Nanosponges were soaked in methanol, sonicated to remove agglomerates, and centrifuged to yield the colloidal fraction. The supernatant was separated, and the material was freeze dried. Nanosponges were created in an aqueous solution. The excess drug was distributed throughout the aqueous nanosponge suspension, and the suspension was continuously stirred throughout the entire duration of the complex creation process. After complexation, the unreacted drug was centrifuged. The solvent was then evaporated to produce solid nanosponges [11].
Factorial design experiments
A 32 full factorial experimental design was used to optimize the formulation of nanosponges. Three-level designs were used to address the situation of nominal factors at three levels and to predict any curvature in the response function. Investigating a quadratic relationship between the response and each of the components was facilitated by a third level for continuous factors. The BCD and DPC concentrations (BCD:DPC ratio) (X1) and reaction time (X2) were chosen as independent variables, because they were likely to affect the desired response variables’ percentage practical yield, percentage drug release, and percentage drug release at 5 hours. The results obtained for the trial batches indicated that a BCD:DPC ratio of 1:6 showed the highest percentage drug release, and showed the lowest percentage drug release at the fifth hour. At reaction times of 15 and 20 mins, the overall percent drug release was much higher and at reaction times of 15 and 20 mins, the percentage drug release at fifth hour was significant lower. The factors were studied at three levels to evaluate the presence of interactions [18].
Percentage practical yield
The percentage yield of nanosponges in all formulations was calculated by comparison of the final weight of the product after drying to the total weight of the medication, polymer, and other excipients used to make the nanosponges [19].
Percentage yield of nanosponges was calculated with the following formula:
 (3)
(3)
Percentage drug content
Percentage drug content was determined for budesonide-loaded nanosponges with a UV spectrophotometer (Jasco V630 PC). After that 10 mg of loaded nanosponges was dissolved in 100 mL 0.1 N HCl Solvent, 1 mL stock solution was extracted with a pipette, diluted with 10 mL 0.1 N HCl, and subjected to UV spectrophotometry [20].
Entrapment efficiency
Percentage entrapment efficiency was estimated by collection of filtrate from the dispersion after ultracentrifugation. The supernatant was collected, filtered, and analyzed with UV spectroscopy. After 10 mg nanosponges was added to 5 mL methanolic hydrochloric acid (HCl:Methanol, 10:1), or HCl, the mixture was shaken for 1 min with a vortex shaker in volumetric flask. Methanolic HCl was used to adjust the volume to 10 mL. After filtering and dilution of the solution, the concentration of budesonide was measured at 246 nm with a UV spectrophotometer [21].
 (4)
(4)
In vitro dissolution study
A drug loaded into the nanosponge structure can be held and released gradually over time. Hydrophilic cyclodextrin nanosponges (CD-NS) can alter the rate of budesonide release, thus allowing for improved drug uptake across biological barriers and serving as a potent drug transporter in immediate release formulations. Hydrophobic CD-NS can be used as a prolonged release carrier for water-soluble medicines, including peptide and protein therapeutics [22].
A US pharmacopoeia (USP) dissolution type II apparatus was used to conduct dissolution studies of nanosponges at 37°C under 50 rpm rotation. After the nanosponges were added to the dissolving liquid, aliquots were taken at prearranged intervals & filtered through Whatman no. 41 filter paper. The filtrates were subsequently examined with a UV spectrophotometer (246 nm). The GI tract’s conditions were simulated with the continuous dissolving method USP. For the first 2 hours (stage I), 700 mL 0.1 N HCl (pH 1.2) was added to the nanosponges. After 2 hours, 233.3 mL 0.2 M tribasic sodium phosphate solution was added to each vessel, and the pH was raised to 6.8 with either 2 M HCl or 2 M NaOH. The dissolution process was then extended for 3 hours (stage II). At the start of the fifth hour (stage III), 1% α-amylase was added to the buffer to examine the effects of the enzyme on drug release in all formulations [23, 24].
X-ray powder diffraction
The production of complexes and their chemical breakdown can be ascertained according to diffraction peaks from a combination of substances. The crystalline structure and diffraction patterns of the medication were altered by the intricate production process involving nanosponges. A Bruker AXS D8 Advance X-ray diffractometer was used to determine the X-ray powder diffraction patterns of a powdered sample of budesonide-loaded CD-NS, 1:4. After exposure to monochromatized Cu Kα radiation (1.5406 Å), the sample was examined between 3° and 70º (2θ). The voltage and current were 40 kV and 30 mA, respectively [20].
Particle size analysis
The nanosponge formulation was appropriately diluted with deionized water until the desired intensity was reached. The polydispersity index & average diameter might be estimated using Malvern zetasizer Nano-ZS (Malvern Instruments, Malvern, UK) or laser light diffractometry to assess the particle sizes of the loaded & unloaded nanosponges [25].
Zeta potential analysis
The zeta potential of prepared CD was measured with Malvern Instruments (Malvern, UK). The formulation was diluted appropriately with deionized water until the desired intensity was reached. The average charge and mobility of the optimized batch of budesonide-loaded nanosponges were measured over a 60-second analysis period. After sample dilution with distilled water at room temperature, the potential was measured [20].
Differential scanning colorimetry
Thermoanalytical techniques can ascertain whether a drug material experiences any modifications before the thermal breakdown of the developed delivery mechanism. The drug substance may change by melting, evaporating, breaking down, oxidizing, or undergoing a polymorphic transition indicating complex formation. Differential thermal analysis and differential scanning calorimetry (DSC) thermograms can be examined for broadening, shifting, the introduction of new peaks, or the elimination of specific peaks. A molecule-wide distribution of the drug within the polymer was demonstrated by the absence of the drug melting peak of the crystal structure in the DSC thermogram. Samples of 1–4 mg were placed in an aluminum pan press and covered with aluminum. The reference was an empty pan press sealed in the same manner. The sample was heated from 35° to 3000°C at a rate of 100°C per minute while a nitrogen flow of 10 mL per minute was used to quantify the thermograms (Shimadzu DSC-60) [26].
Scanning electron microscopy
Scanning electron microscopy (SEM) analysis of the sample can be used for qualitative analysis of particles. SEM data are useful in assessing particle size and form, which are crucial components of CD-NS. The produced formulations were subjected to SEM examination with SEM Image Inside version 2.32.
A small amount of nanosponge suspension was used as the SEM sample (Image Inside version 2.32). The samples underwent 90 seconds of accelerating voltage 8 kV sputter coating after being vacuum-dried [20].
Design space
According to International council for Harmonization (ICH) Q8 (R1), design space is the multidimensional combination and interaction of input factors (e.g., material qualities), and process parameters have been shown to provide quality assurance. This concept originated in the initial ICH Q8 proposals, which specified the design space as “the established range of process parameters that has been demonstrated to provide quality assurance.” The design space additionally contains process parameter ranges that have been demonstrated to be acceptable, as well as the related critical quality attribute (CQA) values. The final design space was created by combining the results of all previous studies and considering the quality objective profile [ICH Q8(R1), Jain [12]] [27].
Results and discussion
Risk assessment
FMEA indicates potential causes that may alter nanosponges’ CQAs. However, the effects of all these parameters on the quality features of nanosponges are very difficult to control or determine. Hence, selecting only those elements known to have high or considerable effects on the quality attributes of the product is crucial, to explain and understand a major part of the experimental variances. Herein, the FMEA tool was used to create a risk estimation matrix showing the different risk levels associated with these factors. Numerous active pharmaceutical ingredient characteristics, material characteristics, and process factors used in the formulation and development of nanosponges were included in the FMEA. Published reports and early research clearly indicated that the product’s CQAs are greatly affected by the ratio of BCD to DPC, and the reaction time. Because they have little to no effect on the product’s performance, factors with little influence on quality attributes can be easily controlled and removed from the study; in contrast, factors with moderate or high risk or influence should be thoroughly examined for their effects on the quality attributes the nanosponges. To establish the design space, only key factors with a high risk level were chosen and further optimized. Thus, a methodical connection was made between the creation of the experimental plan and regression analysis (RA) [28, 29].
Percentage practical yield and entrapment efficiency
Percentage drug release
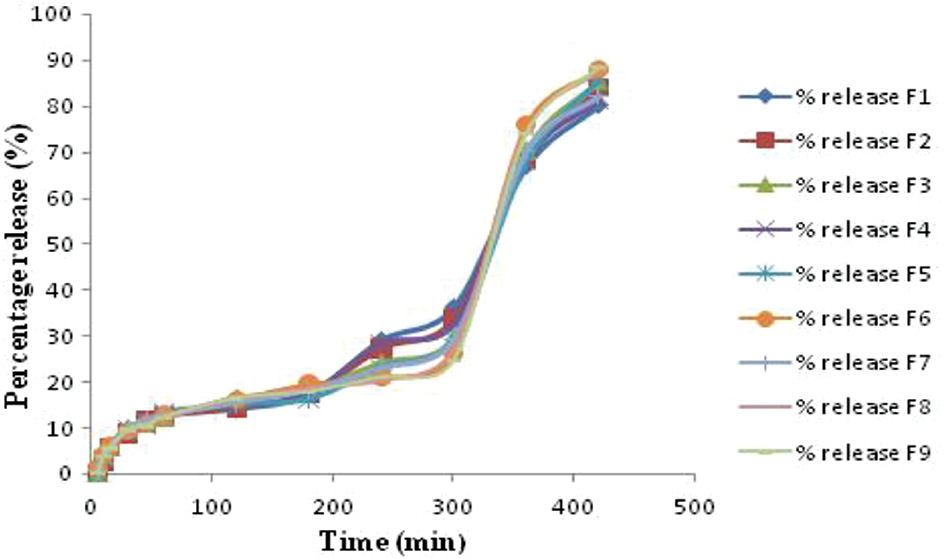
The percentage practical yield and entrapment efficiency for all formulated batches of nano sponges are given in Table 5. According to in vitro release statistics, each formulation exhibited a sustained release of the medication for as many as 5 hours. The percentage cumulative drug release over 420 min for all formulations is shown in Table 6. In vitro drug release studies indicated that increasing the BCD:DPC ratio decreased drug release to some extent, whereas adding amylase enzyme increased release. Moreover, increasing the reaction time increased the percentage cumulative drug release. The F9 batch exhibited the highest drug release (Figure 1).
Table 5 Percentage Practical Yield and Entrapment Efficiency
| Sr. No. | Batches | Percentage Practical Yield | Entrapment Efficiency |
|---|---|---|---|
| 1 | F1 | 60.98 ± 0.008 | 75.39% ± 0.0081 |
| 2 | F2 | 63.56 ± 0.0124 | 77.59% ± 0.0249 |
| 3 | F3 | 66.36 ± 0.0141 | 74.5% ± 0.0205 |
| 4 | F4 | 62.61 ± 0.0262 | 79.13% ± 0.0169 |
| 5 | F5 | 68.96 ± 0.0081 | 75.89% ± 0.0244 |
| 6 | F6 | 72.21 ± 0.0124 | 77.21% ± 0.0205 |
| 7 | F7 | 68.45 ± 0.0205 | 73.78% ± 0.0244 |
| 8 | F8 | 74.65 ± 0.0169 | 73.92% ± 0.0262 |
| 9 | F9 | 78.52 ± 0.0169 | 77.35% ± 0.0571 |
Table 6 Percentage Drug Release
| Time | F1 | F2 | F3 | F4 | F5 | F6 | F7 | F8 | F9 |
|---|---|---|---|---|---|---|---|---|---|
| 5 | 0.16 ± 0.0001 | 0.20 ± 0.017 | 0.26 ± 0.038 | 0.28 ± 0.049 | 0.31 ± 0.0233 | 1.21 ± 0.016 | 0.60 ± 0.1333 | 1.21 ± 0.123 | 0.33 ± 0.019 |
| 10 | 3.30 ± 0.0002 | 2.49 ± 0.379 | 4.05 ± 0.635 | 3.09 ± 0.410 | 3.43 ± 0.395 | 3.89 ± 0.327 | 4.11 ± 0.282 | 3.89 ± 0.295 | 3.99 ± 0.263 |
| 15 | 5.34 ± 0.002 | 5.78 ± 0.204 | 5.91 ± 0.241 | 5.77 ± 0.241 | 5.83 ± 0.058 | 5.77 ± 0.028 | 5.37 ± 0.203 | 5.77 ± 0.202 | 5.69 ± 0.059 |
| 30 | 9.09 ± 0.135 | 8.71 ± 0.286 | 10.05 ± 0.543 | 9.10 ± 0.395 | 9.66 ± 0.389 | 9.12 ± 0.262 | 9.67 ± 0.259 | 9.12 ± 0.259 | 9.67 ± 0.258 |
| 45 | 11.07 ± 0.061 | 11.62 ± 0.199 | 11.09 ± 0.231 | 10.69 ± 0.212 | 11.27 ± 0.239 | 10.89 ± 0.237 | 11.64 ± 0.304 | 10.89 ± 0.306 | 10.52 ± 0.306 |
| 60 | 12.65 ± 0.103 | 12.66 ± 0.104 | 12.29 ± 0.149 | 13.40 ± 0.483 | 13.04 ± 0.461 | 12.65 ± 0.308 | 12.66 ± 0.182 | 12.65 ± 0.182 | 12.28 ± 0.311 |
| 120 | 14.04 ± 0.092 | 14.42 ± 0.103 | 16.48 ± 0.101 | 14.98 ± 0.368 | 15.18 ± 0.409 | 16.10 ± 0.487 | 15.55 ± 0.376 | 16.10 ± 0.37 | 16.47 ± 0.541 |
| 180 | 17.09 ± 0.194 | 17.48 ± 0.217 | 18.43 ± 0.590 | 17.48 ± 0.590 | 16.36 ± 0.458 | 19.45 ± 0.171 | 18.24 ± 0.691 | 18.64 ± 0.693 | 17.86 ± 0.827 |
| 240 | 28.96 ± 0.093 | 27.29 ± 0.724 | 24.20 ± 0.789 | 28.36 ± 0.305 | 23.17 ± 0.332 | 20.97 ± 0.387 | 22.98 ± 0.197 | 20.34 ± 0.287 | 21.01 ± 0.311 |
| 300 | 36.19 ± 0.056 | 33.76 ± 0.249 | 29.74 ± 0.756 | 32.67 ± 0.527 | 29.46 ± 0.594 | 26.19 ± 0.217 | 29.34 ± 0.059 | 27.16 ± 0.748 | 24.76 ± 0.677 |
| 360 | 66.98 ± 0.046 | 68.36 ± 0.693 | 70.21 ± 0.545 | 68.40 ± 0.590 | 68.16 ± 0.954 | 75.81 ± 0.641 | 70.26 ± 0.314 | 74.69 ± 0.298 | 74.06 ± 0.323 |
| 420 | 80.26 ± 0.198 | 83.96 ± 0.692 | 85.41 ± 0.528 | 81.26 ± 0.0.239 | 85.69 ± 0.292 | 87.92 ± 0.404 | 82.31 ± 0.484 | 87.68 ± 0.320 | 88.38 ± 0.563 |
Figure 1 Cumulative percentage drug release.
Statistical analysis
Accurate and convincing interpretation of study results can be ensured by statistical analysis, which includes fitting mathematical models to data, selecting the best possible model by conducting appropriate statistical tests, and determining the values of independent formulation variables to yield the best possible response.
One frequently used statistical experimental design, factorial design, was applied in this work to optimize the formulations and identify any potential interactions between the selected components. A 32 complete factorial design was used to examine the influence of independent factors on characteristics and performance. The effects of independent variables on drug release percentage, practical yield percentage, and drug release at the fifth hour were assessed. These variables included the BCD:DPC ratio, as well as reaction time at three different levels. Model equations for the responses were obtained by fitting the values of the investigated response measured for each trial batch of formulations in the 32 factorial design. One-way analysis of variance (ANOVA) was used for statistical evaluation of these models. Regression analysis and ANOVA indicated that the selected variables significantly influenced all responses examined [30].
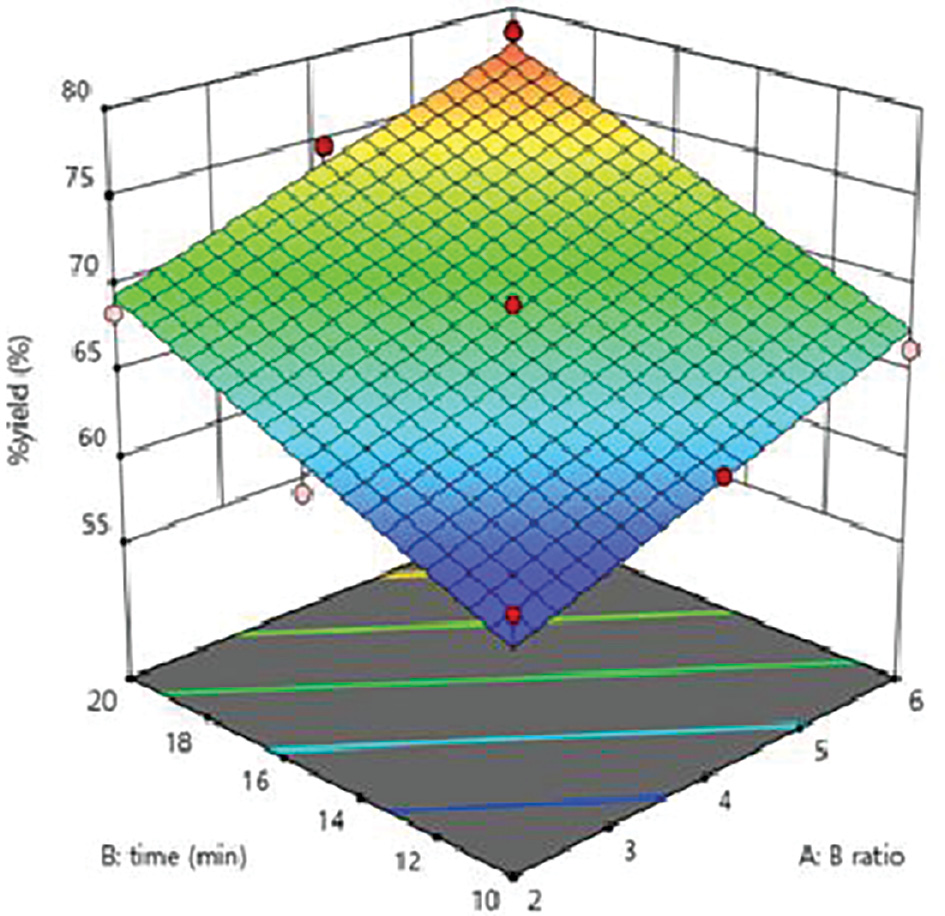
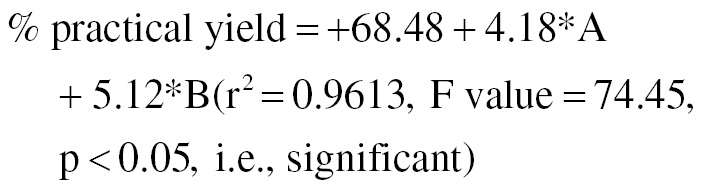
The percentage practical yield of nanosponges was in the range of 60.98–78.52%. Regression analysis revealed that the study’s factors had substantial effects on the percentage practical yield from the formulation (r2 = 0.9613). A 3D surface plot can be used to examine the relationship between a response variable and two predictor factors. This three-dimensional graph enables investigation of desired response values and operating conditions. The DPC ratio, BCD concentration ranges, and reaction times for the best-fit model for optimized formulations composed the 3D surface. The 3D surface demonstrated that the percentage practical yield of the formulation increased with increasing BCD concentration, DPC ratio, and reaction duration (Figure 2).
Figure 2 Response surface curve depicting the effects of factorial values on percentage practical yield.
The regression equation for percentage practical yield was as follows:
 (5)
(5)
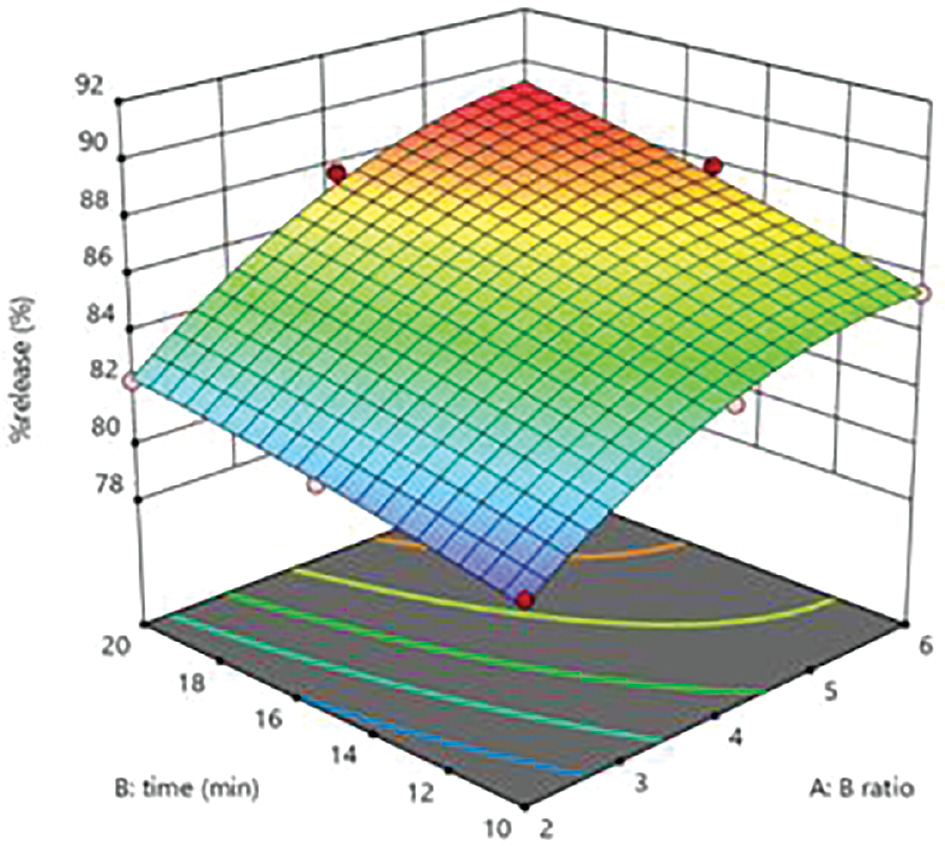
The Table 6 shows that the variables had substantial effects (r2 = 0.9921) on the drug release percentage, which ranged from 80.26% to 88.38%. As the cross-linking agent and polymer ratio increased, the percentage drug release also increases (Figure 3).
Figure 3 Response surface curve depicting the effects of factorial values on percentage drug release.
The drug release percentage regression equation was as follows:
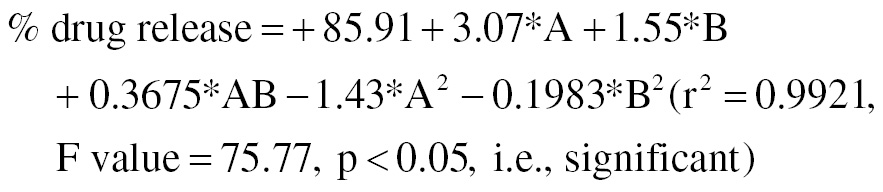 (6)
(6)
The percentage drug release at the fifth hour was in the range of 24.76–36.19%.
The concentration of BCD and DPC ratio and reaction time increases the percentage drug release at fifth hour of formulation decreases because drug release retard due to the complex of BCD with drug (Figure 4).
Figure 4 Response surface curve depicting the effects of factorial values on percentage drug release at the fifth hour.
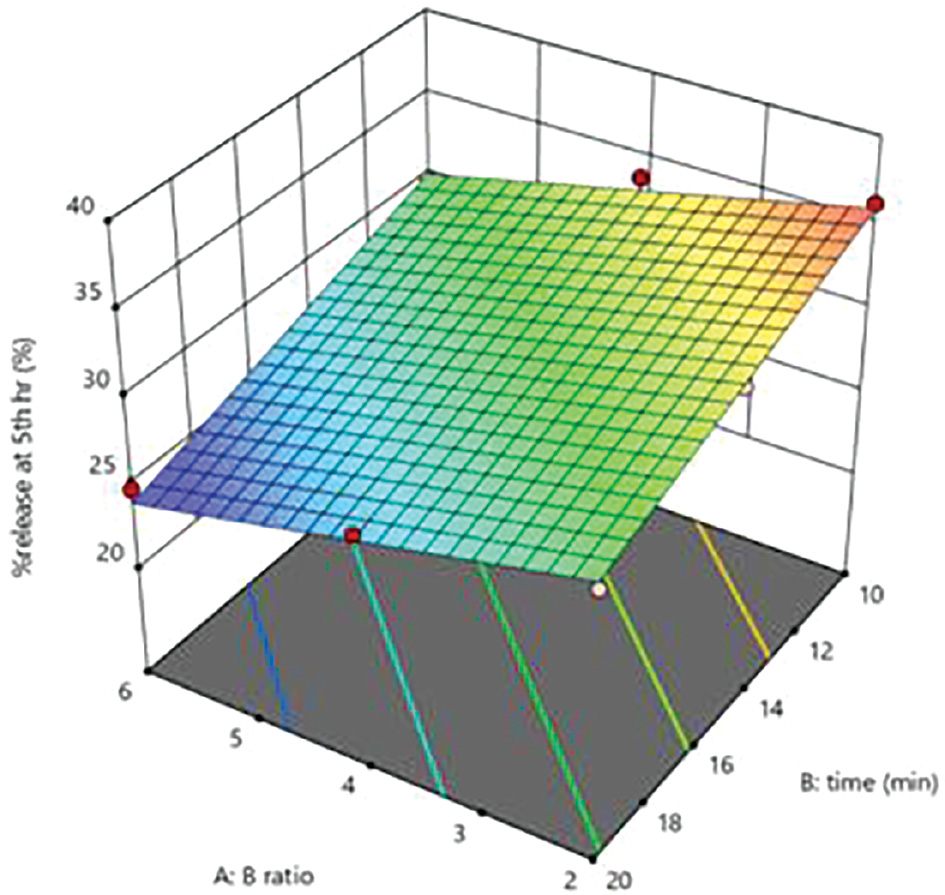
The regression equation for percentage drug release at the fifth hour was as follows:
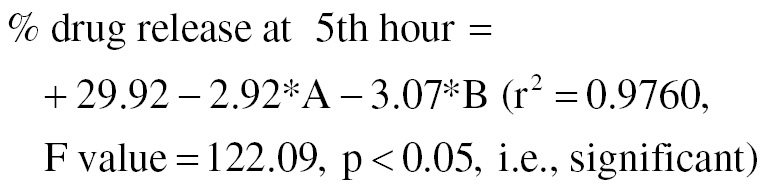 (7)
(7)
In accordance with the 32 factorial design, the optimized nanosponges containing budesonide were formulated with specific process variable settings with numerical analysis. The practical yield (%), drug release (%), and drug release at the fifth hour (%) were also assessed. A BCD:DPC ratio (X1) of 1:6 and reaction time (X2) of 20 min were the settings used for the formulation of optimized nanosponges; these were the only desirable ranges for the independable variables (factors).
The optimized formulation resulted in a practical yield of 76.21 ± 0.719%, drug release of 87.58 ± 0.147%, and drug release at the fifth hour of 24.61 ± 0.243%, with small percentage error values of 1.56, 1.68, and −0.69%. Percentage error evaluation was used to determine the validity of generated model equations and to characterize the domain of applicability of the optimization model. The low percentage error values suggested that the mathematical models derived from the entire 32 factorial design were well fitted.
X-ray powder diffraction
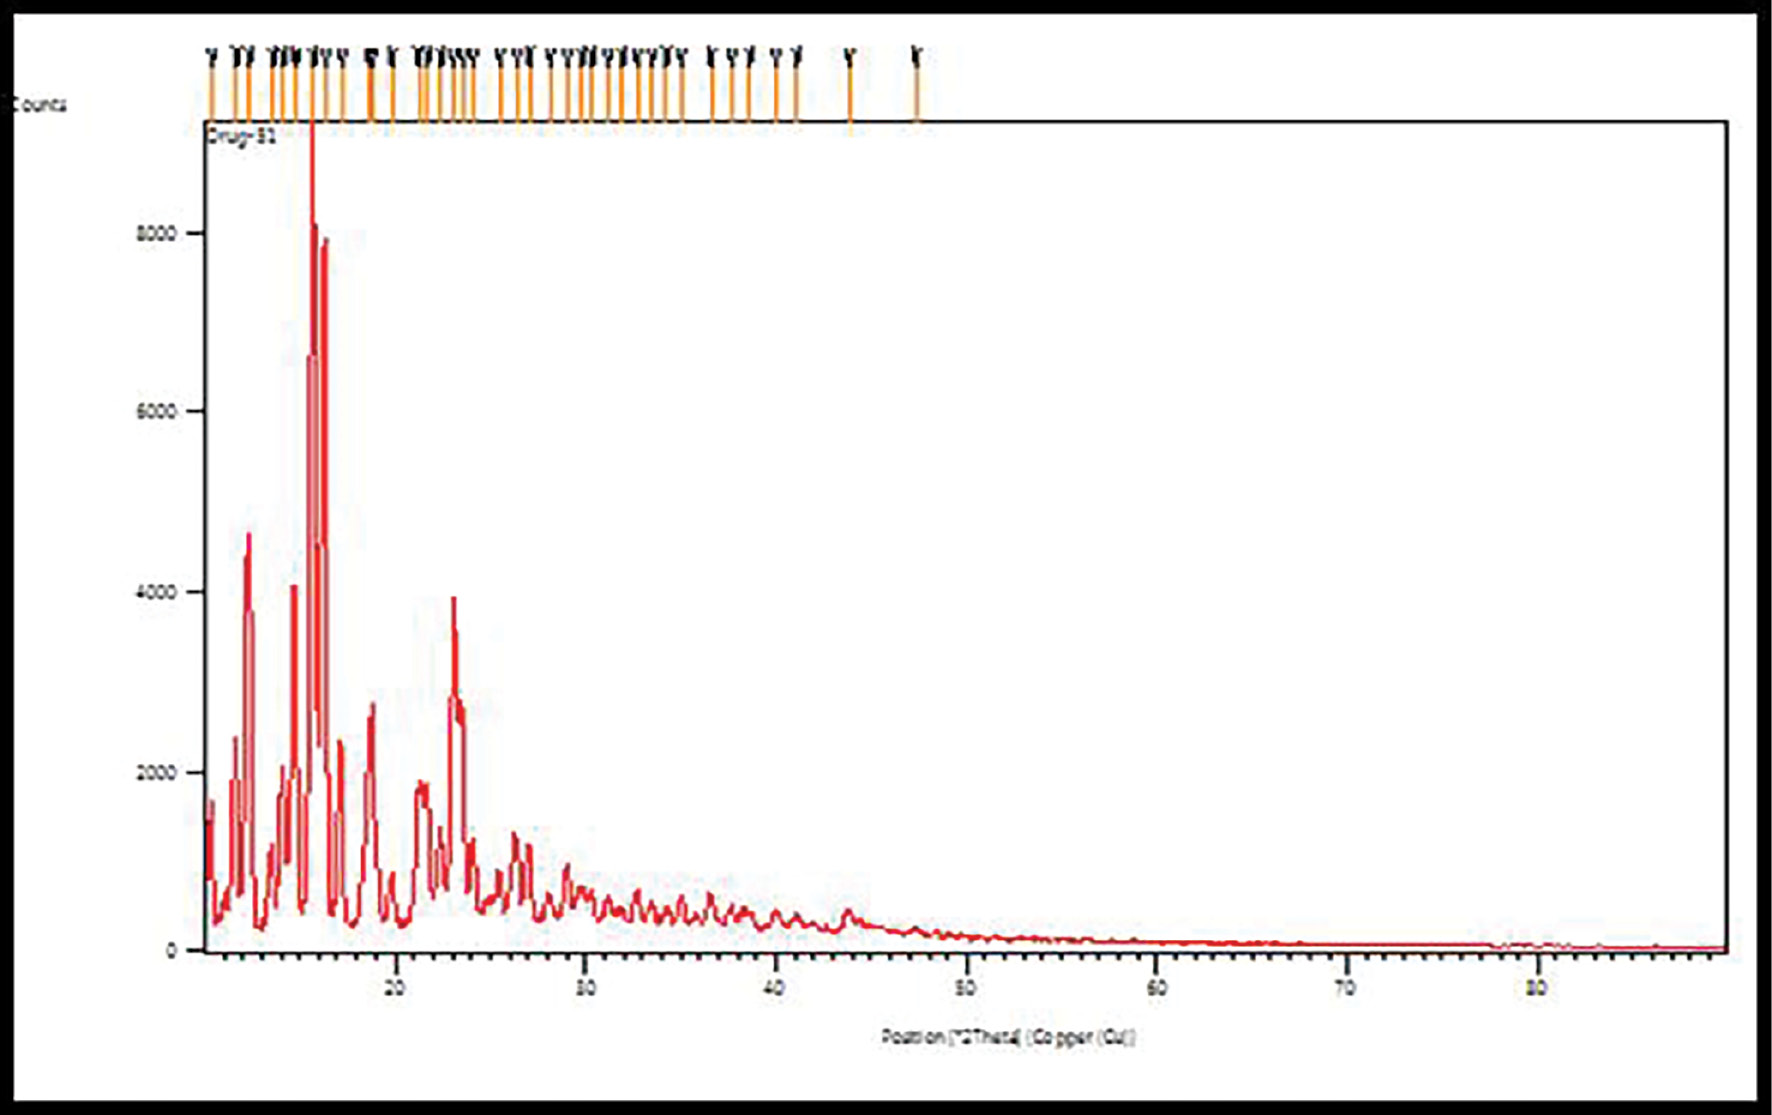
One application of X-ray powder diffraction (XRD) analysis is to determine the crystallinity of a sample. The XRD spectrum showed intense peaks indicating the crystalline nature of budesonide (Figure 5) [31].
Figure 5 X-ray powder diffraction of budesonide.
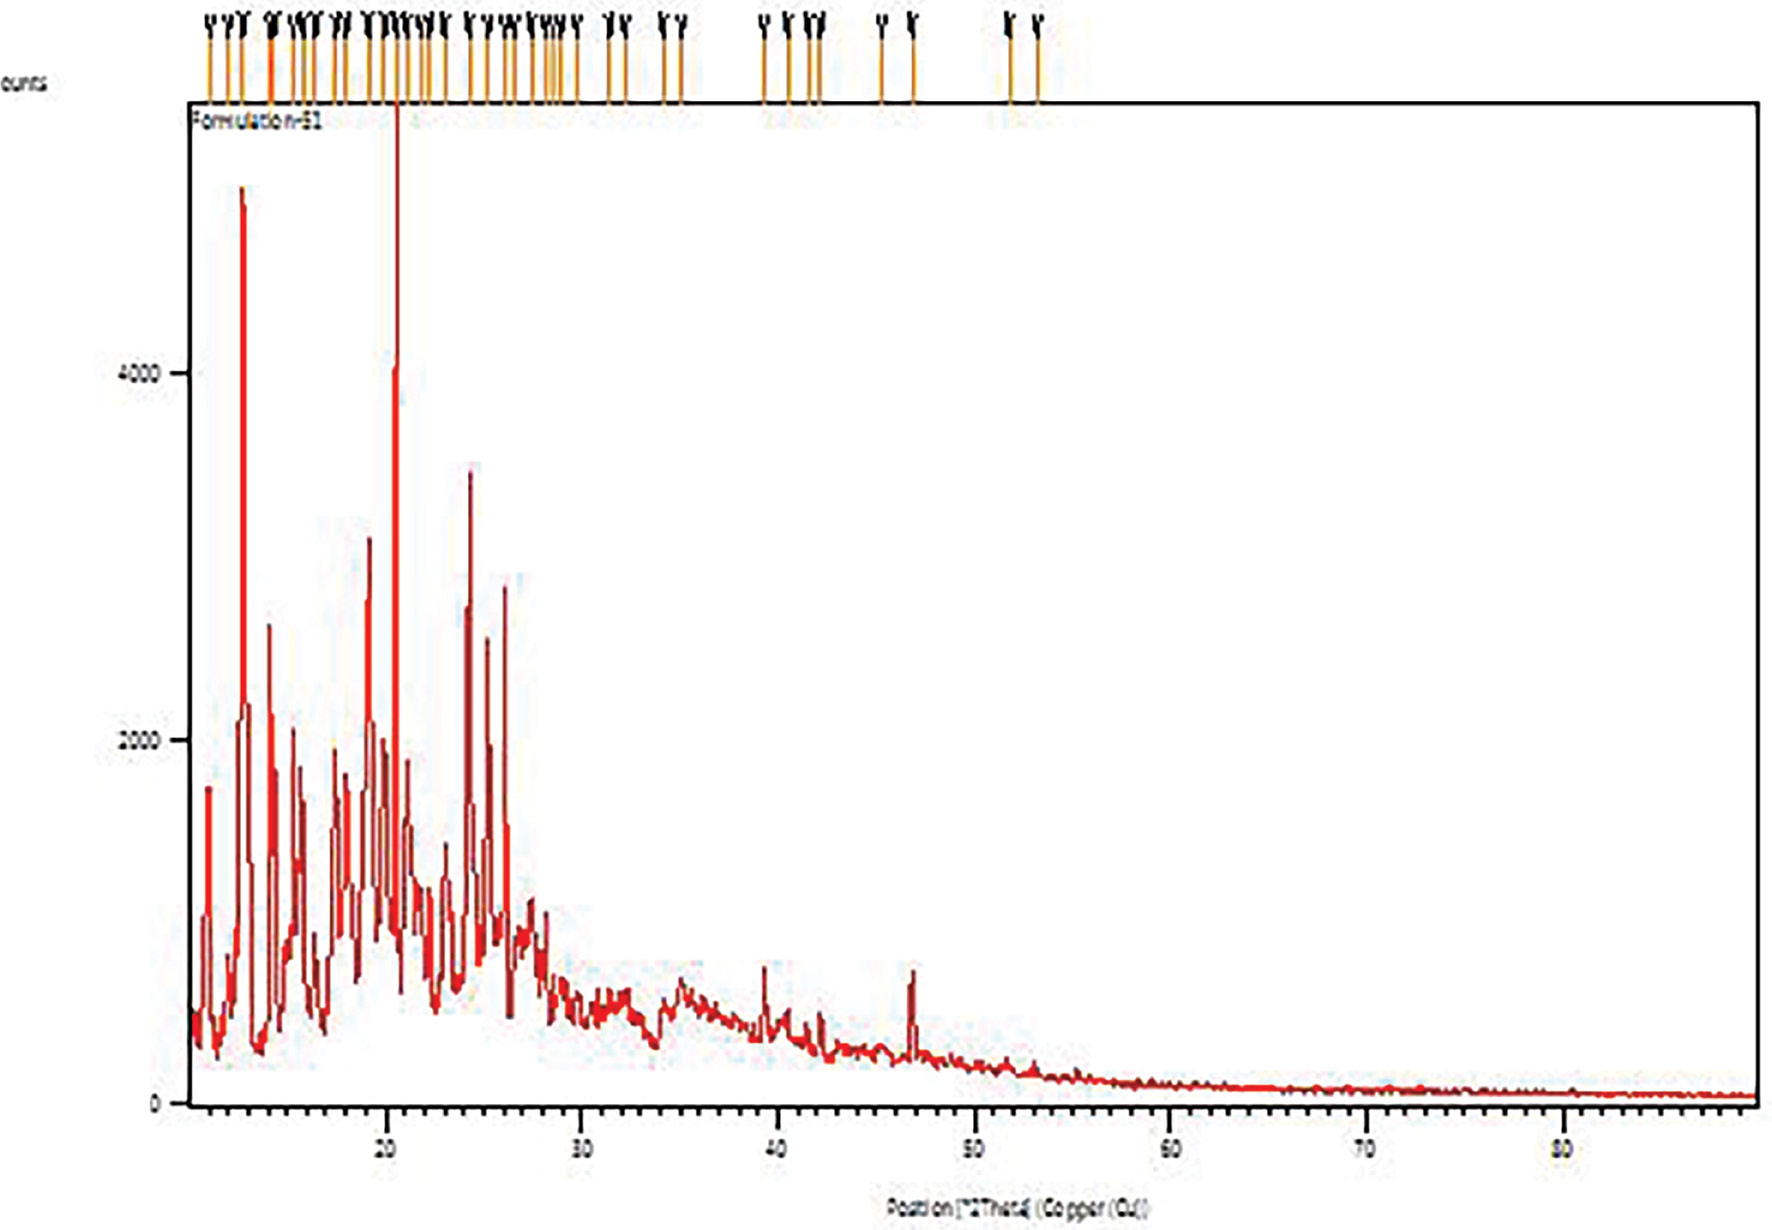
The X-ray powder diffraction data of budesonide-CD-NS showed a considerable shift in the intensities of powder 2θ values of the budesonide drug compared with the pure drug, thus indicating a marked decrease in budesonide crystallinity after inclusion in CD-NS. X-powder diffraction data for budesonide-CD-NS thus explained its poorly crystalline nature. The percentage crystallinity of the CD-NS complex decreased drastically, thus indicating that budesonide was distributed and lost most its crystallinity, possibly because of both the inclusion and exclusion phenomena of NS with budesonide (Figure 6).
Figure 6 X-ray powder diffraction of formulation.
Particle size
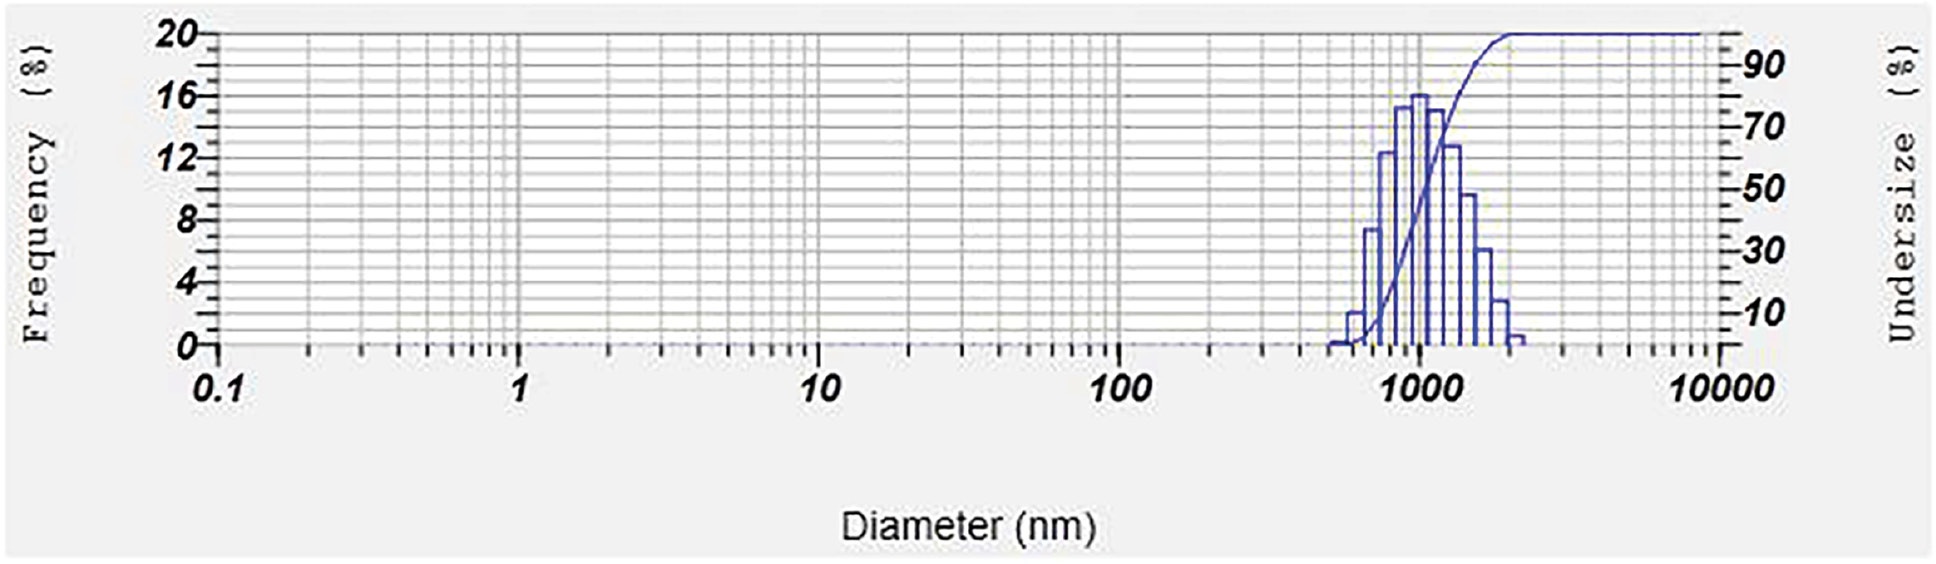
The particle size measurement of budesonide-loaded nanosponge complex suspensions revealed that the average particle size, as assessed with a Zetasizer instrument, was approximately 1095.5 nm (Table 7) (Figure 7).
Table 7 Zeta Size Analysis Data for CD-NS
| Peak No. | S.P. Area Ratio | Mean | S.D. | Mode |
|---|---|---|---|---|
| 1 | 1.00 | 1095.5 nm | 304.4 nm | 1004.6 nm |
| 2 | — | —nm | —nm | —nm |
| 3 | — | —nm | —nm | —nm |
| Total | 1.00 | 1095.5 nm | 304.4 nm | 1004.6 nm |
Figure 7 Particle size analysis of CD-NS.
Zeta potential analysis
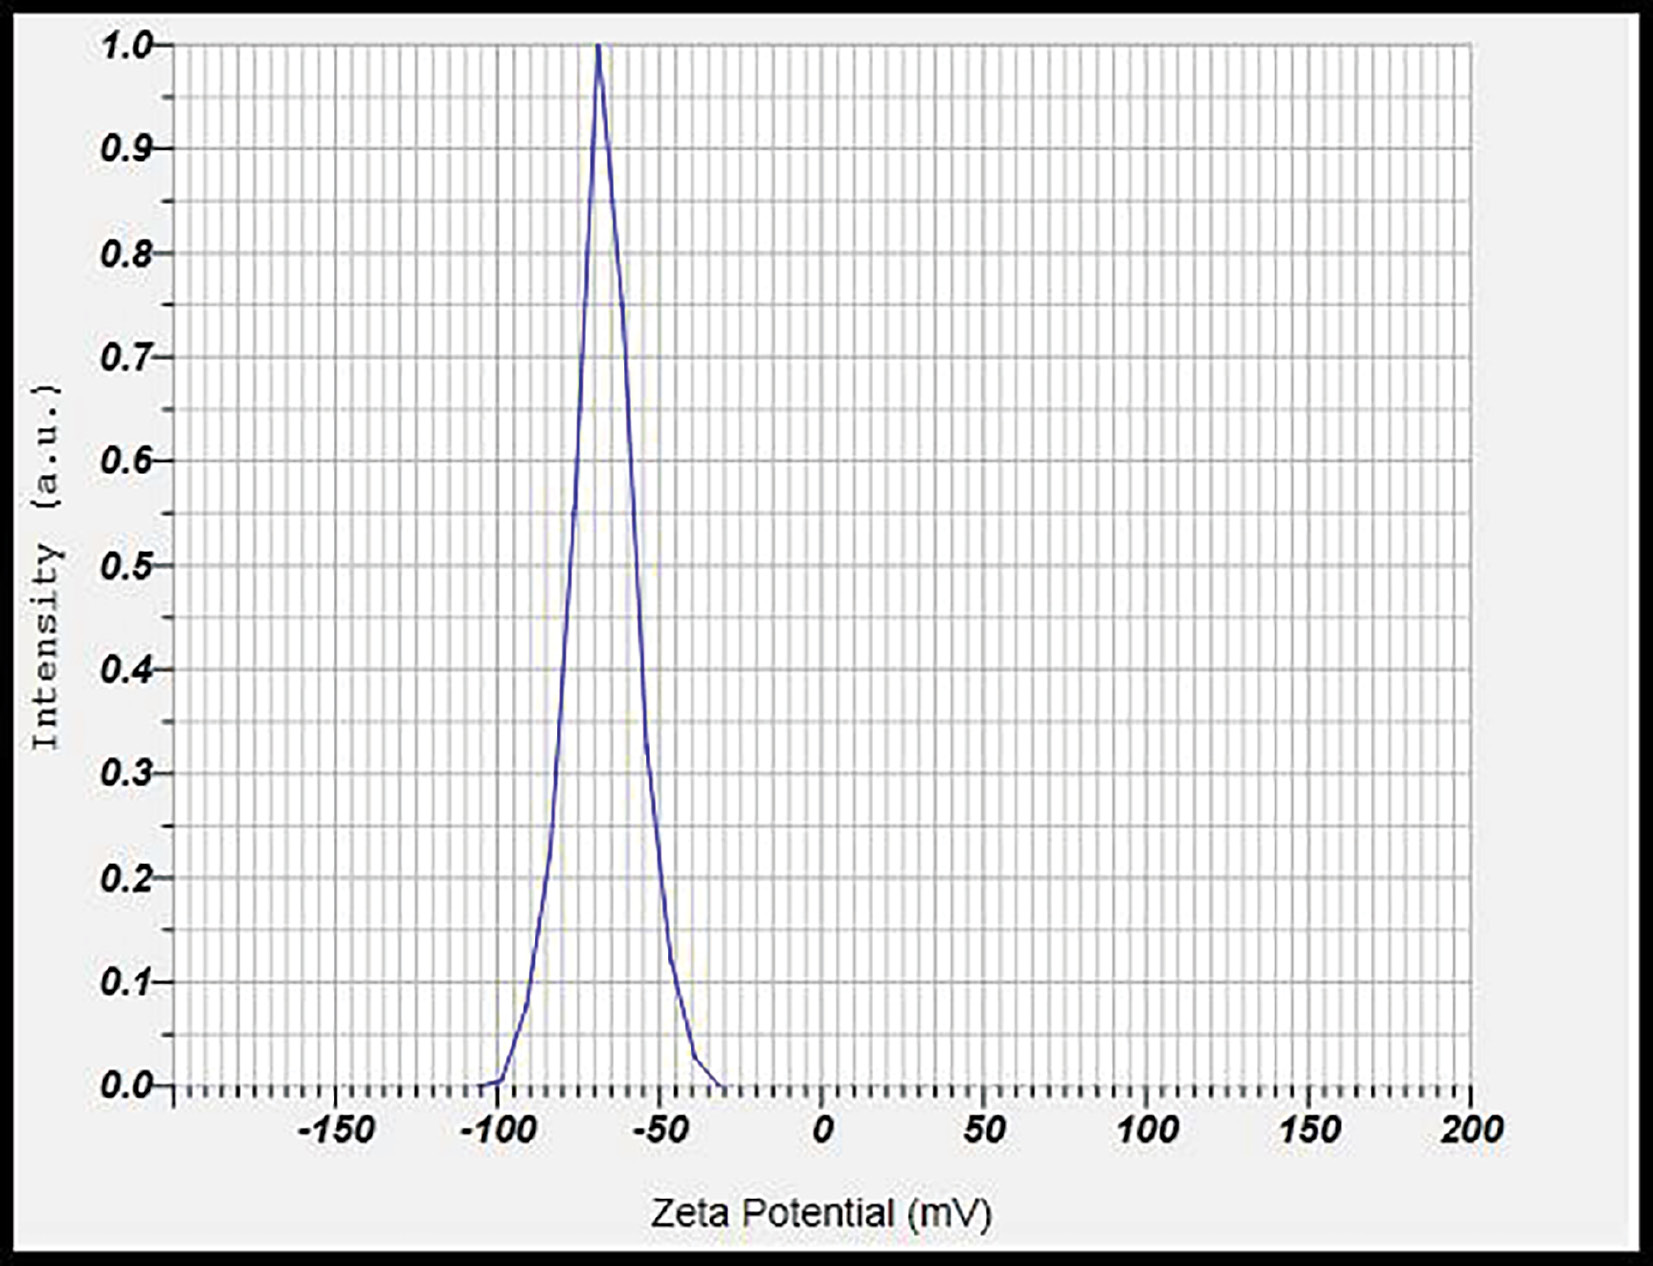
Zeta potential was measured at 25°C with a zeta potential analyzer. The zeta potential measures particles’ surface charge. Increasing zeta potential leads to an increase in particle surface charge, and vice versa. The zeta potential can substantially influence particle stability in suspension through electrostatic repulsion between particles. The measured zeta potential of −67.4 mV indicated no agglomeration and moderate stability (Figure 8).
Figure 8 Zeta potential analysis data for CD-NS.
Differential scanning calorimetry
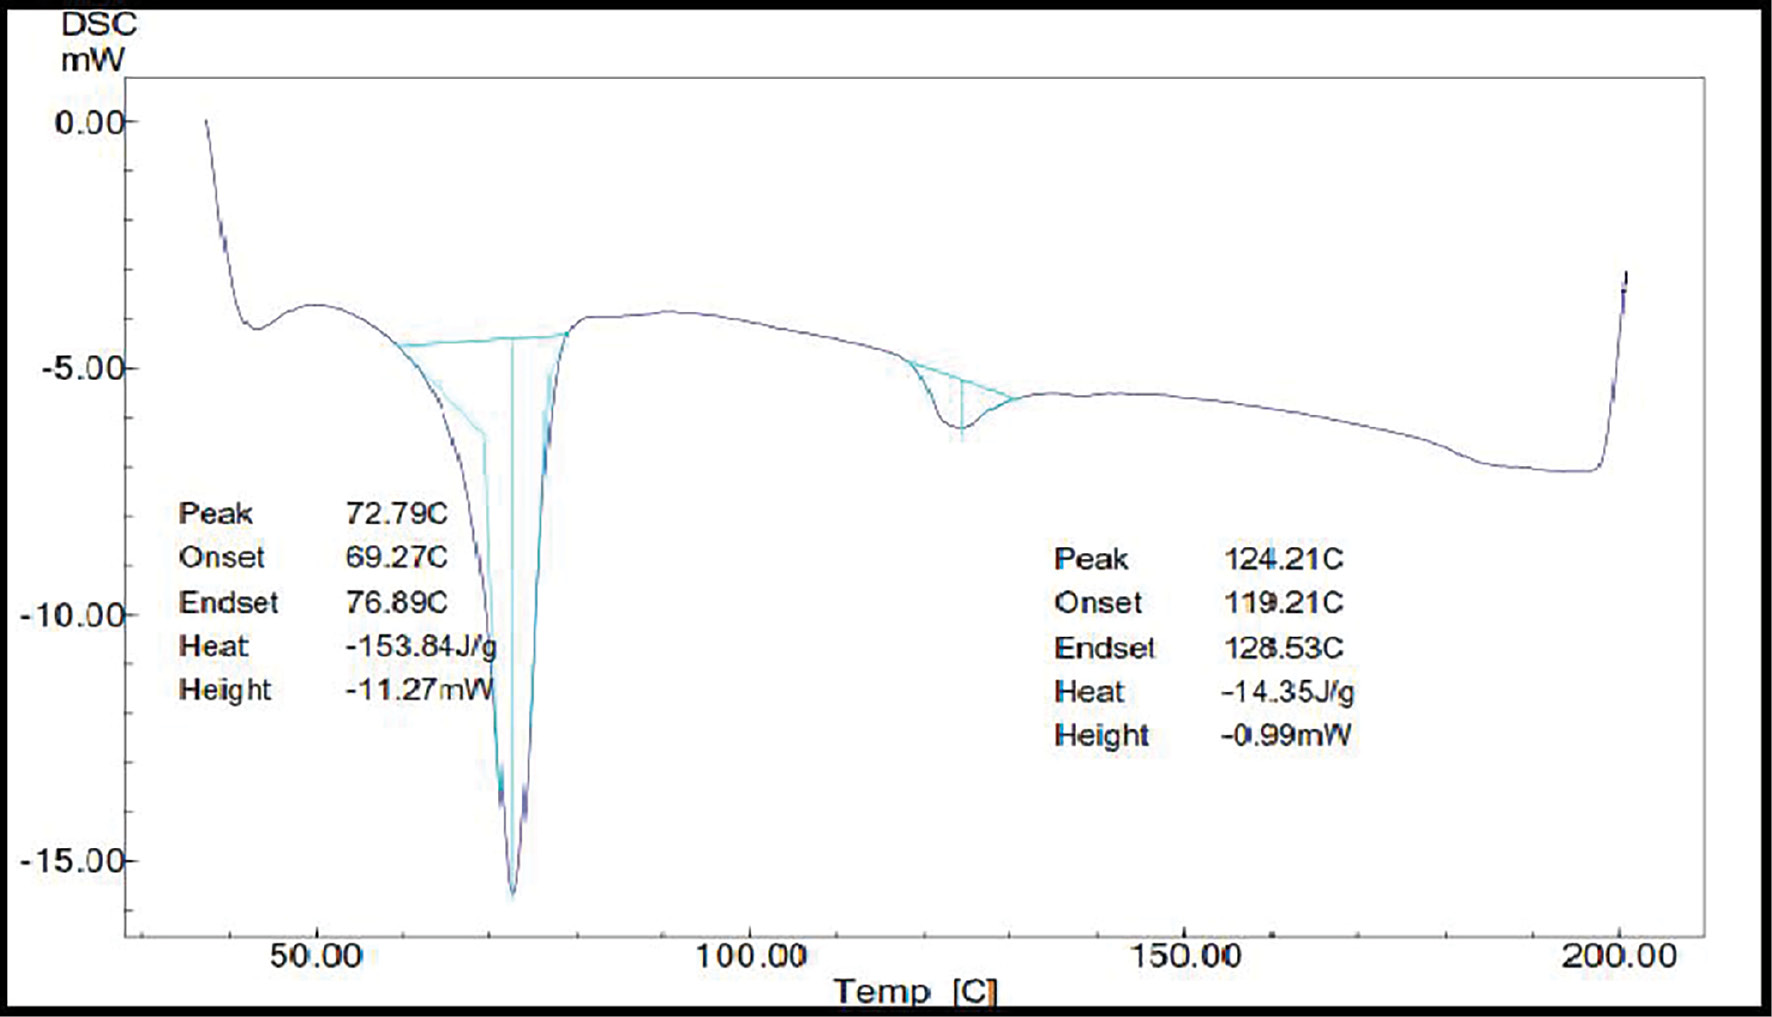
Differential scanning calorimetry provides insight into the behaviors of different materials at different temperatures. Differential scanning calorimetry revealed a prominent endothermic peak at 173.16°C representing budesonide’s melting point. This endotherm was suppressed in the complex, thus suggesting that the encapsulation in nanosponges provided some protection. DSC thermograms of budesonide-loaded nanosponges did not reveal the melting peak associated with drug fusion (Figure 9). The peaks at 72.79°C and 124.21°C suggested that the medication was no longer crystalline and was molecularly dispersed in the nanosponges. Additionally, this might show how budesonide encapsulation and interaction with the nanosponge structure occur through inclusion and exclusion activities [2].
Figure 9 DSC analysis of budesonide-loaded nanosponges.
Surface morphology determined by scanning electron microscopy
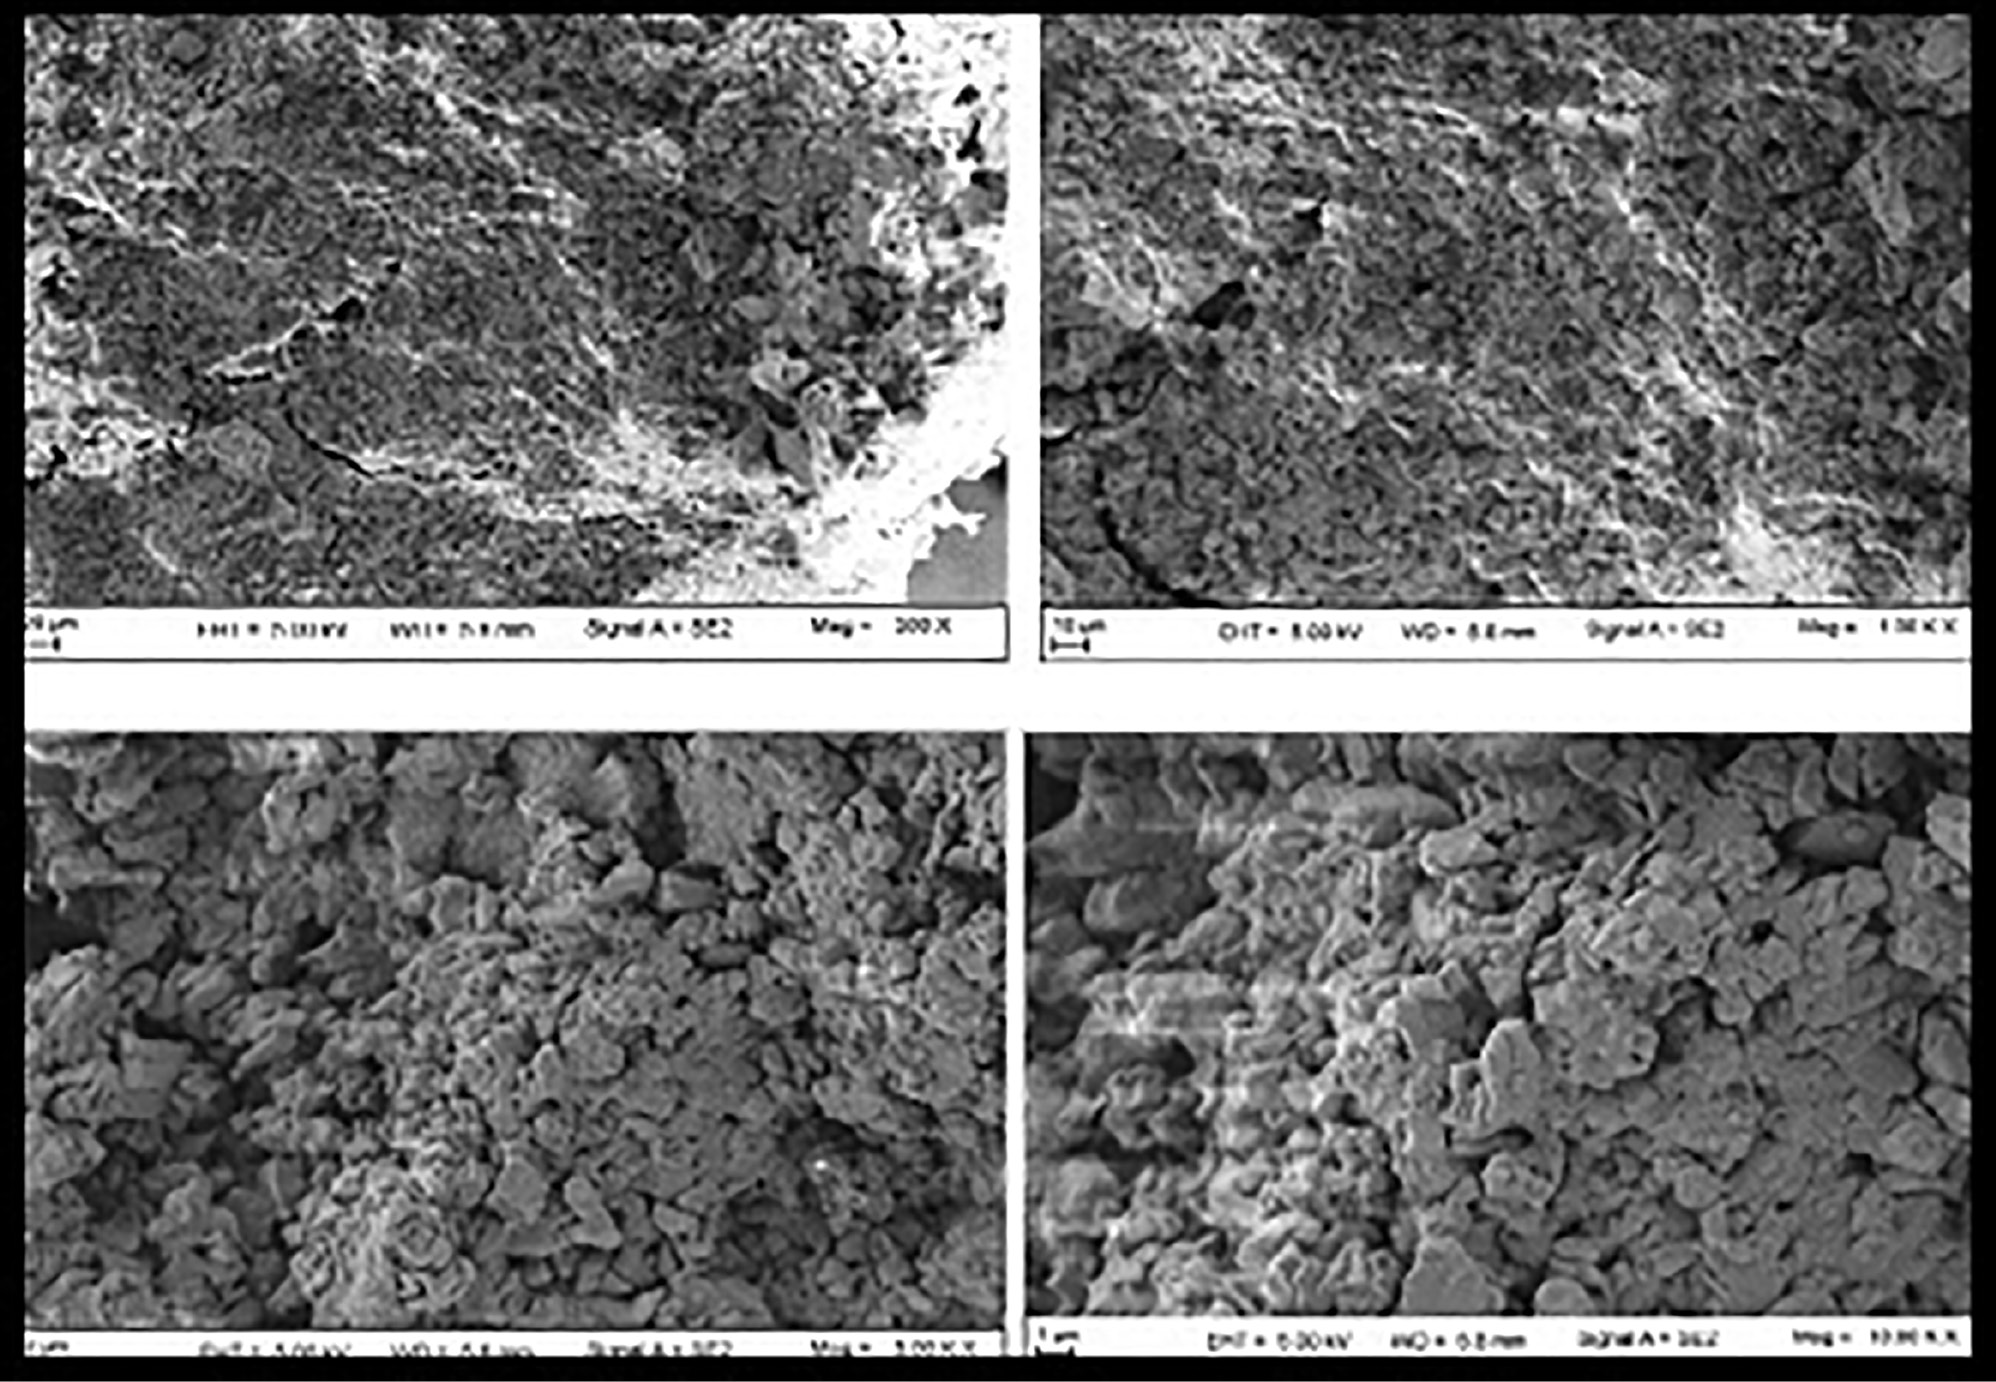
The porous nature of nanosponges allows for drugs to penetrate the interpenetrating network. SEM was used to examine the surface morphology of the constructed nanosponges. The nanosponges had a spongy appearance and spherical shape. The SEM images (Figure 10) showed that the generated nanosponges contained several voids with a fine surface that formed as a result of solvent diffusion. The findings were consistent with previous research on particle size. Budesonide and BCD completely formed the nanosponge matrix, because no unbroken crystals of budesonide were found on the surface [32].
Figure 10 Surface morphology of nanosponges, determined by SEM.
Design space for material and process attributes
The design space for material and process attributes is provided in Table 8.
Table 8 Design Space for Material and Process Attributes
| Formulation Attributes | Design Space | Response |
|---|---|---|
| Drug | Fine powder Assay: 98–101% |
Assay Dissolution |
| β-cyclodextrin and DPC ratio | 1:5–1:6 | Dissolution, entrapment efficiency and practical yield |
| Microwave reaction time | 20–22 min | Practical yield, appearance |
| Microwave power level | 280 watts | Practical yield, appearance |
Conclusion
Budesonide-loaded nanosponges were successfully prepared through the microwave irradiation method, which has industrial application potential because of its short reaction times. Cyclodextrin-based nanosponges can encapsulate both lipophilic and hydrophilic medicines and release them in a controlled and predictable manner at target regions, thus enhancing drug bioavailability.
With this approach, the drug formed complexes with BCD and DPC. Burst release of the drug occurred at the ileocecal region of the colon. QbD-based optimization of the BCD:DPC ratio (1:6) and the microwave reaction time (20 min) were key in achieving higher practical yield (76.21 ± 0.719%), higher drug release (87.58 ± 0.147%), and optimal drug release at the fifth hour (24.61 ± 0.243). On the basis of optimization by QbD, the formulation F-9 was determined to be optimal. The results of the current investigations showed that the combined application of QbD methods, such as RA, screening, experimental design, and optimization, aids in understanding the effects of formulation and process parameters on nanosponge quality attributes.
Acknowledgements
The authors thank the trustees of Shree Panchavati Education Society’s SNPT Institute of Pharmacy, Nasik and MET’s Institute of Pharmacy, Bhujbal Knowledge city, Nasik for providing the required facilities to perform this work.
Declaration of interest
The authors declare no conflicts of interest. The writers are solely responsible for the content and writing of this article.
References
- Pallagi E, Ambrus R, Szabo-Revesz P, Csoka I. Adaptation of the quality by design concept in early pharmaceutical development of an intranasal nanosized formulation. Int J Pharm 2015;491(1-2):384-92. [PMID: 26134895 DOI: 10.1016/j.ijpharm.2015.06.018]
- Juran J, Godfrey A. Juran’s quality handbook. 5th ed. New York, NY: McGraw-Hill Professional Publishing; 1998.
- Pawar SP, Patel VA, Pawar KS, Patel HV. In-vitro evaluation of guar gum mediated colon specific tablet dosage form containing aspirin. Int J Pharm 2013;19:60-3.
- Kshirsagar S, Bhalerao B, Shukla G, Mohapatra S. Development and evaluation of multiparticulate colon targeted drug delivery system by combine approach of pH and bacteria. Int J PharmTech Res 2011;3(2):1139-49. [PMID: 23842943 DOI: 10.1055/s-0033-1349129]
- Rehman K, Amin M, Muda S. Influence of beta-cyclodextrin and chitosan in the formulation of a colon-specific drug delivery system. Drug Res 2013;63(12):657-62. [PMID: 23842943 DOI: 10.1055/s-0033-1349129]
- Patel A, Bhatt N, Parel K, Patel N, Patel M. Colon targeted drug delivery system: a review system. J Pharm Sci Biosci Res 2011;1(1):37, 44 and 45.
- Uekama K, Hirayama F, Arima H. Recent aspect of cyclodextrin-based drug delivery system. J Incl Phenom Macrocycl Chem 2006;56(1-2):3-8. [DOI: 10.1007/s10847-006-9052-y]
- Sinha V. In vivo bioavailability and therapeutic assessment of host-guest inclusion phenomena for the hydrophobic molecule ETODOLAC: pharmacodynamic and pharmacokinetic evaluation. Sci Pharm 2010;78(1):103-15. [PMID: 21179374 DOI: 10.3797/scipharm.0909-08]
- Toke E, Lorincz O, Somogyi E, Lisziewicz J. Rational development of a stable liquid formulation for nanomedicine products. Int J Pharm 2010;392(1-2):261-7. [PMID: 20347027 DOI: 10.1016/j.ijpharm.2010.03.048]
- Sherje A, Dravyakar B, Kadam D, Jadhav M. Cyclodextrin-based nanosponges: a critical review. Carbohydr Polym 2017;173:37-49. [PMID: 28732878 DOI: 10.1016/j.carbpol.2017.05.086]
- Ahmed R, Patil G, Zaheer Z. Nanosponges – a completely new nano-horizon: pharmaceutical applications and recent advances. Drug Dev Ind Pharm 2012;39(9):1263-72. [PMID: 22681585 DOI: 10.3109/03639045.2012.694610]
- Jain S. Quality by design (QBD): a comprehensive understanding of implementation and challenges in pharmaceuticals development. Int J Pharm Pharm Sci 2014;6(1):29-35.
- Mostafavi E, Iravani S, Varma R. Nanosponges: an overlooked promising strategy to combat SARS-CoV-2. Drug Discov Today 2022;27(10):103330. [PMID: 35908684 DOI: 10.1016/j.drudis.2022.07.015]
- Singireddy A, Rani Pedireddi S, Nimmagadda S, Subramanian S. Beneficial effect of microwave assisted heating versus conventional heating in synthesis of cyclodextrin based nanosponges. Materialstoday Proc 2016;3(10):3951-59. [DOI: 10.1016/j.matpr.2016.11.055]
- Nadpara NP, Thumar RV, Kalola VN, Patel PB. Quality by design (QbD): a complete review. Int J Pharm Sci 2012;17(2):20-8.
- Watts P, Illum L. Colonic drug delivery. Drug Dev Ind Pharm 1997;23(9):893-913.
- Adam S, Suzzi D, Radeke C, Khinast J. An integrated quality by design (QbD) approach towards design space definition of a blending unit operation by discrete element method (DEM) simulation. Eur J Pharm Sci 2011;42(1-2):106-15. [PMID: 21056102 DOI: https://doi.org/10.1016/j.ejps.2010.10.013]
- Rathore A, Winkle H. Quality by design for biopharmaceuticals. Nat Biotechnol 2009;27(1):26-34. [PMID: 19131992 DOI: 10.1038/nbt0109-26]
- Varshosaz J, Emami J, Tavakoli N, Fassihi A, Minaiyan M, et al. Synthesis and evaluation of dextran–budesonide conjugates as colon specific prodrugs for treatment of ulcerative colitis. Int J Pharm 2009;365(1-2):69-76. [PMID: 18804521 DOI: 10.1016/j.ijpharm.2008.08.034]
- Tejashri G, Amrita B, Darshana J. Cyclodextrin based nanosponges for pharmaceutical use: a review. Acta Pharm 2013;63(3):335-58. [PMID: 24152895 DOI: 10.2478/acph-2013-0021]
- Sharma R, Pathak K. Polymeric nanosponges as an alternative carrier for improved retention of econazole nitrate onto the skin through topical hydrogel formulation. Pharm Dev Technol 2010;16(4):367-76. [PMID: 20367024 DOI: 10.3109/10837451003739289]
- Cavalli R, Trotta F, Tumiatti W. Cyclodextrin-based nanosponges for drug delivery. J Incl Phenom Macrocyclic Chem 2006;56(1-2):209-21. [DOI: 10.1007/s10847-006-9085-2]
- Government of India. Indian Pharmacopoeia, Volume II. Ministry of Health and Family Welfare. Ghaziabad: The Indian Pharmacopoeia Commission; 2014. p. 2247.
- Chebli C, Cartilier L, Hartman NG. Substituted amylose as a matrix for sustained-drug release: a biodegradation study. Int J Pharm 2001;222:183–9. [PMID: 11427348 DOI: 10.1016/s0378-5173(01)00694-9]
- Bragagni M, Mennini N, Furlanetto S, Orlandini S, Ghelardini C, et al. Development and characterization of functionalized niosomes for brain targeting of dynorphin-B. Eur J Pharm Biopharm 2014;87(1):73-9. [PMID: 24462793 DOI: 10.1016/j.ejpb.2014.01.006]
- Raza K, Singh B, Singal P, Wadhwa S, Katare O. Systematically optimized biocompatible isotretinoin-loaded solid lipid nanoparticles (SLNs) for tropical treatment of acne. Colloids Surf, B 2013;105:67-74. [PMID: 23357735 DOI: 10.1016/j.colsurfb.2012.12.043]
- The International Conference on Harmonization, Q8(R2) Pharmaceutical development. 2009. Available from http://www.ich.org/fileadmin/public_web_site/ICH_Products?Guidelines/Quality/Q8_R1/step4/Q8_R2_Guideline.p.
- Alshaibani A, Yaakob Z, Alsobaai A, Sahri M. Optimization of Pd-B/y-Al2O3 catalyst preparation for palm oil hydrogenation by response surface methodology (RSM). Braz J Chem Eng 2014;31(1):69-78. [DOI: 10.1590/S0104-66322014000100008]
- Verma S, Lan Y, Gokhale R, Burgess D. Quality by design approach to understand the process of nanosuspension preparation. Int J Pharm 2009;377(1-2):185-98. [PMID: 19446617 DOI: 10.1016/j.ijpharm.2009.05.006]
- Looby M, Ibarra N, Pierce J, Buckley K, O’Donovan E, et al. Application of quality by design principles to the development and technology transfer of a major process improvement for the manufacture of a recombinant protein. Biotechnol Prog 2011;27(6):1718-29. [PMID: 21948302 DOI: 10.1002/btpr.672]
- Bhatt H, Naik B, Dharamsi A. Solubility enhancement of budesonide and statistical optimization of coating variables for targeted drug delivery. J Pharm 2014;2014(1):1-13. [PMID: 26556190 DOI: 10.1155/2014/262194]
- Ansari K, Vavia P, Trotta F, Cavalli R. Cyclodextrin-based nanosponges for delivery of resveratrol: in vitro characterisation, stability. Cytotoxicity and permeation study. AAPS PharmSciTech 2011;12(1):279-86. [PMID: 26556190 DOI: 10.1208/s12249-011-9584-3]