Diabetes Mellitus and Pancreatic Cancer: Investigation of Causal Pathways Through Mendelian Randomization Analysis
1Department of General Surgery, Affiliated Hospital (Clinical College) of Xiangnan University, Chenzhou 423000, P. R. China
2Department of Interventional Vascular Surgery, Affiliated Hospital (Clinical College) of Xiangnan University, Chenzhou 423000, P. R. China
3Department of Nuclear Medicine, Affiliated Hospital (Clinical College) of Xiangnan University, Chenzhou 423000, Hunan Province, P. R. China
4Faulty of Applied Sciences, Macao Polytechnic University, Macao 999078, P. R. China
5Department of Radiation Oncology, Affiliated Hospital (Clinical College) of Xiangnan University, Chenzhou 423000, P. R. China
aZuliang Deng, Wenxing Long and Hanping Duan contributed equally to this work.
*Correspondence to: Tan Tao, Faulty of Applied Sciences, Macao Polytechnic University, Macao 999078, P. R. China. E-mail: taotanjs@gmail.com; Xie Hui, Department of Radiation Oncology, Affiliated Hospital (Clinical College) of Xiangnan University, Chenzhou 423000, P. R. China. E-mail: h.xie@xnu.edu.cn
Received: August 31 2023; Revised: October 6 2023; Accepted: November 13 2023; Published Online: November 23 2023
Cite this paper:
Deng Z, Long W, Duan H et al. Diabetes Mellitus and Pancreatic Cancer: Investigation of Causal Pathways Through Mendelian Randomization Analysis. BIO Integration 2023; 4(4): 160–169.
DOI: 10.15212/bioi-2023-0014. Available at: https://bio-integration.org/
Download citation
© 2023 The Authors. This is an open access article distributed under the terms of the Creative Commons Attribution License (https://creativecommons.org/licenses/by/4.0/). See https://bio-integration.org/copyright-and-permissions/
Abstract
Objective: This study was aimed at investigating the association between diabetes mellitus and susceptibility to pancreatic cancer by using Mendelian randomization (MR) methods and an extensive human genome-wide association study (GWAS) dataset.
Methods: The publicly accessible MR Base database was used to obtain the complete genome, relevant research findings, and summary data pertaining to diabetes mellitus and pancreatic cancer. Genetic variables, specifically single-nucleotide polymorphisms closely associated with diabetes mellitus, were selected for analysis. Four methods—inverse variance weighted (IVW) analysis, weighted median analysis, weighted mode, and MR-Egger regression—were used. Statistical analysis was conducted to explore the potential association between diabetes mellitus and susceptibility to pancreatic cancer.
Results: The results of the IVW analysis (OR = 11.56519319, 95% CI 1.275068624–104.8992116, P = 0.0296) indicated a significant causal relationship between diabetes and elevated pancreatitis risk. Furthermore, the absence of horizontal pleiotropic effects (Egger intercept = 0.29, P = 0.384) and heterogeneity (P = 0.126) suggested that the observed association was not influenced by confounding factors. Sensitivity analysis and other statistical methods also supported the conclusion that genetic pleiotropy did not introduce bias to the findings.
Conclusion: A causal relationship exists between diabetes mellitus and the occurrence of pancreatic cancer. People with diabetes mellitus are at high risk of pancreatic cancer and should receive early screening. The IGF signaling pathway may be a key mediator of the effects of diabetes on pancreatic cancer pathogenesis.
Keywords
Causal relationship, diabetes mellitus, pancreatic cancer, mendelian randomization.
Introduction
Diabetes mellitus (DM), a metabolic disorder, arises from a combination of genetic and environmental factors [1]. Its enduring complications, including renal failure, diabetic heart disease, stroke, foot ulcer, and diabetic retinopathy, pose substantial burdens on people worldwide, and are increasing in prevalence [2]. According to the International Diabetes Federation, the number of Chinese adults affected by diabetes mellitus is estimated to be 109 million, whereas the worldwide prevalence is 415 million [3].
Pancreatic cancer (PC), like DM, poses a major threat to human well-being. The prevalence of PC is progressively increasing at an annual rate of 1%, and its fatality rate remains alarmingly elevated [4]. According to a 2020 report published by the World Health Organization, the prevalence of PC in Asia is approximately 47.1%, surpassing that in Europe, which has the second-highest prevalence, at 28.3% [5]. In the comprehensive tumor rankings for China, the incidence and mortality rates of PC are eighth and sixth highest, respectively. These rates surpass the global average morbidity (12th) and mortality (7th) levels. The challenging nature of early diagnosis for PC substantially affects patient prognosis. Reports have indicated that 80% of patients with PC are diagnosed in advanced stages involving tumor metastasis and invasion, thus resulting in lost opportunities for curative surgery [6]. Hence, timely identification and diagnosis of PC, and immediate intervention, are crucial to increase the likelihood of survival. The relationship between PC and DM has garnered substantial attention in the academic community. Extensive research has indicated that people with DM and elevated blood glucose levels have elevated susceptibility to developing PC [7]. Furthermore, DM onset within 2–3 years before PC diagnosis may be attributable to a paraneoplastic phenomenon triggered by the release of inflammatory mediators by cancerous cells [8]. In addition, a causal association has been demonstrated between PC and the onset of DM, thus refuting a causal connection between long-term DM and PC [9]. Therefore, the relationship between DM and PC is complex, and debates regarding its causality and directionality are ongoing.
Mendelian randomization (MR) is an epidemiological experimental method in which publicly available databases are used to analyze causal relationships between exposure factors and outcomes. Single-nucleotide polymorphisms (SNPs) are used as instrumental variables (IVs) to investigate the presence of a causal association between an exposure and outcome [10]. SNPs are the most common type of heritable variation in humans, accounting for more than 90% of all known polymorphisms. SNPs have been used to varying degrees in population genetics, ecology, the pharmaceutical industry, forensic science, cancer, hereditary diseases, and even evolutionary studies [10]. The present investigation used aggregated data from a published genome-wide association study (GWAS) [11]. GWAS is a method for conducting multi-center, large-sample, iterative validation of gene-disease association studies at the genome-wide level. Given that alleles are randomly assigned during meiosis, MR is comparable to a natural randomized controlled trial, thus enabling controlling for confounding factors. Moreover, genetic variants are present from birth, thereby mitigating reverse causation and offering robust evidence of causal inference. Therefore, this study used MR analysis to reevaluate the association between diabetes and PC risk, to provide insights to guide early PC diagnosis.
Materials and methods
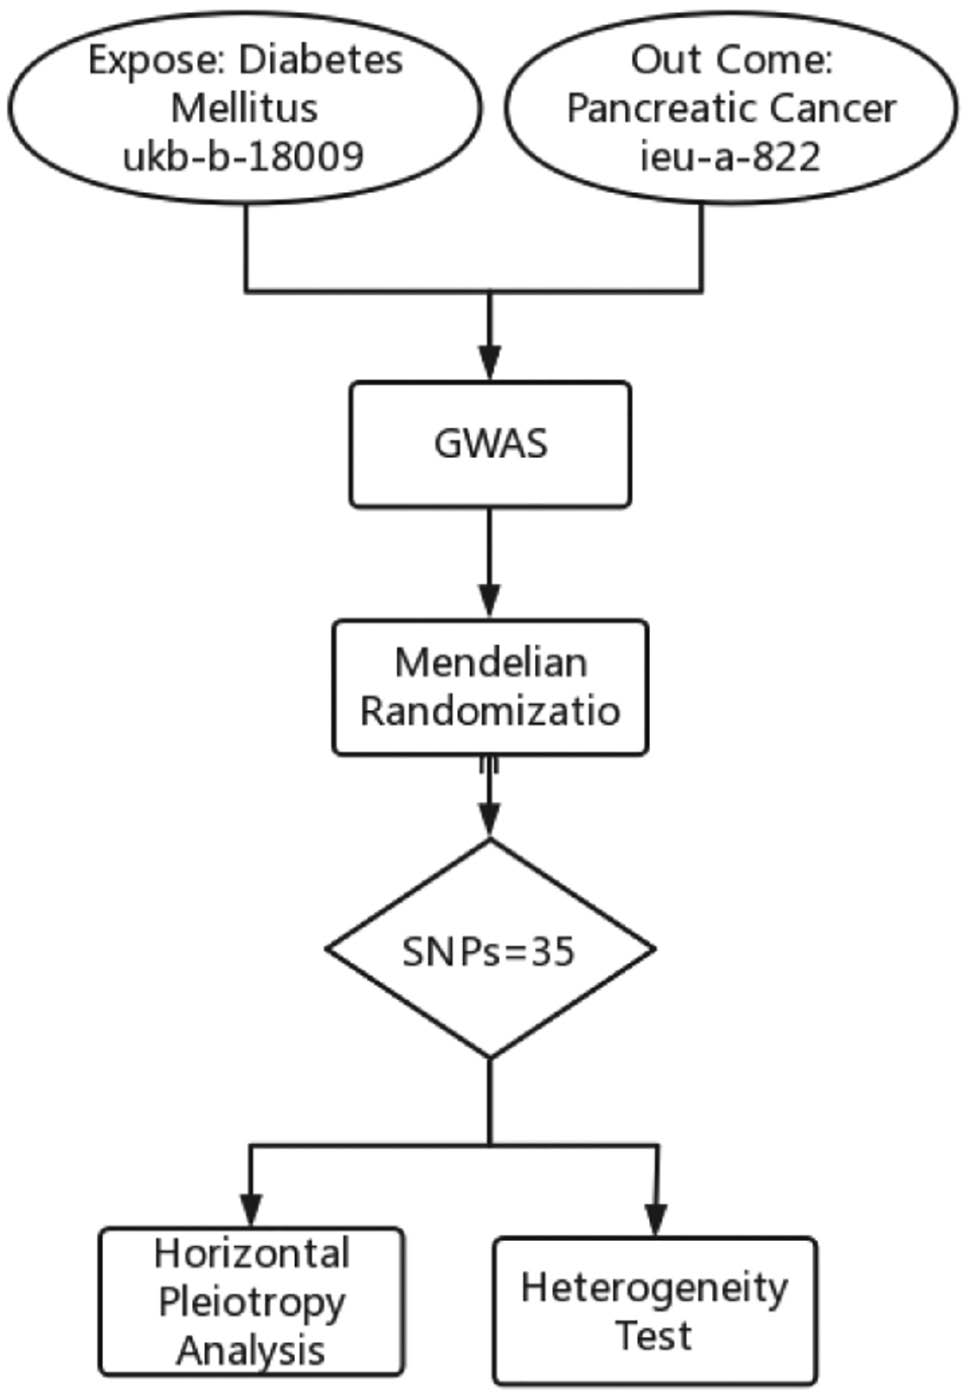
The analyses conducted in this study relied on publicly accessible GWAS data; therefore, supplementary ethical approval and informed consent were not required. The flowchart describes the study process (Figure 1).
Figure 1 Flowchart of this study.
Data source
The exposure data used in the GWAS on DM were obtained from the publicly accessible MR Base database (http://app.mrbase.org/), under accession ukb-b-18009. This dataset encompasses a substantial cohort of 249,710 people, consisting of 43,244 cases and 206,466 controls. Within this dataset, a total of 9,185,867 genetic variants were analyzed. The outcome data for the GWAS on PC were likewise acquired from MR Base database accession ieu-a-822. This dataset included 3,835 participants, comprising 18,964 cases and 1,939 controls, and encompassed a comprehensive set of 521,863 genetic variants. However, importantly, both datasets consisted of participants from only European populations.
Research design
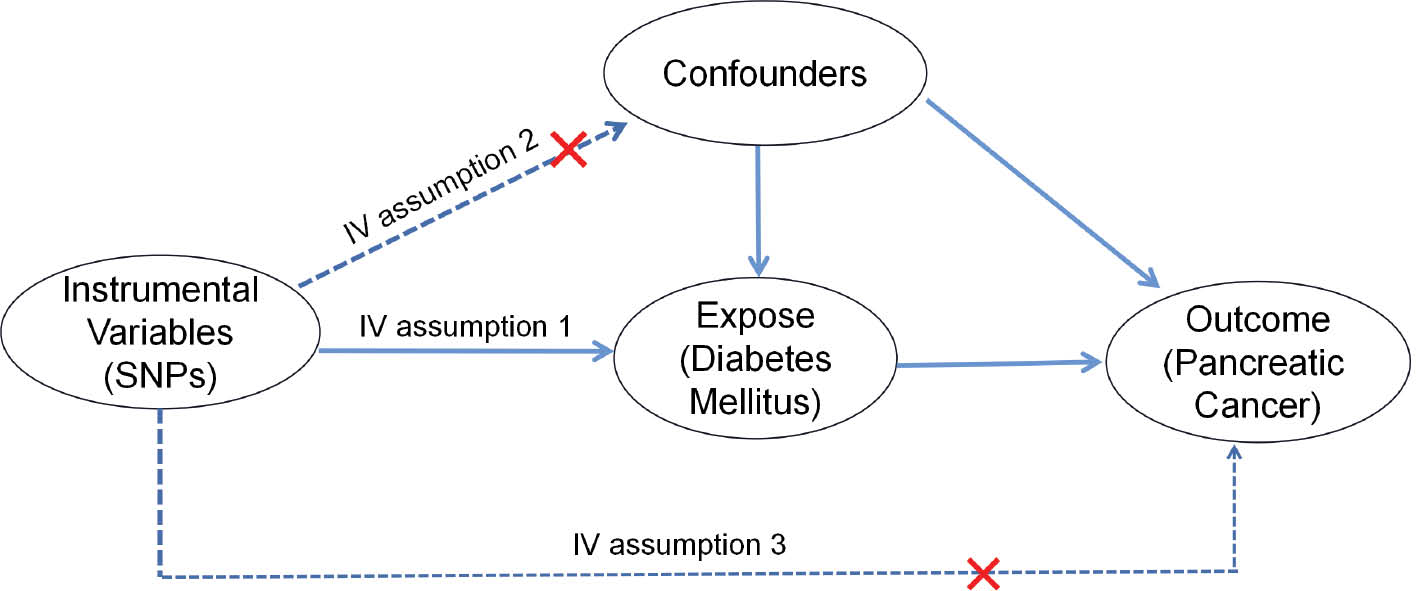
This study used a two-sample MR design to investigate the causal relationship between DM and PC, with DM serving as the exposure and PC serving as the outcome. The research methods comprised three steps: (1) examining the significant associations between the IV and DM, (2) assessing the absence of any potential confounding factors associated with the IV, and (3) determining the lack of significant association between the IV and PC, as depicted in Figure 2.
Figure 2 Three assumptions for IVs in MR analysis.
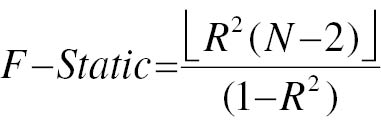
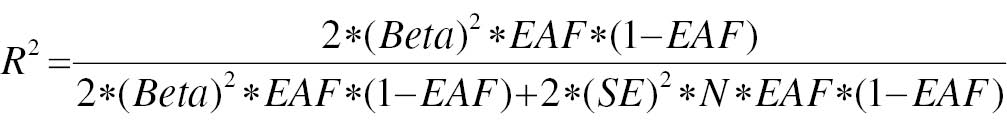
A significance threshold of P < 1×10⁻⁸ was used to determine DM GWAS-identified loci demonstrating genome-wide significance. To ensure accuracy of the results, we analyzed SNPs with genetic significance across the entire set and excluded SNPs in linkage disequilibrium. In particular, SNPs with an r2 value > 0.01 in conjunction with the most prominent SNP within a 5000 kb span were omitted. Next, we used the Phenoscanner database (http://www.phenoscanner.medschl.cam.ac.uk/) to sequentially retrieve information on each SNP. The retrieved information was then assessed to determine whether the SNP had previously been documented to be linked with metabolites and disease traits at significance levels of P < 5×10⁻⁸ and r2 > 0.8. The potency of each SNP was evaluated with the F-statistic, computed according to formula 1. Formula 2 outlines the calculation of the R2 value. Additionally, we assessed whether each SNP had previously been associated with a recognized risk factor for PC. If the SNP was found to be relevant, it was excluded, to avoid violating the second assumption of IV analysis. Finally, in cases in which a SNP was unavailable, a surrogate SNP was used as a replacement, provided that the presence of a palindromic structure did not introduce any ambiguity.
 (1)
(1)
 (2)
(2)
where N is the number of exposed samples included in GWAS studies, R2 is the degree to which IV explains exposure (the determinant of the regression equation), beta is the effect size of each allele for each SNP and phenotypic association, SE is the standard deviation of beta, and EAF represents the effect allele frequency.
Mendelian randomization analysis
The inverse variance weighted (IVW) method was used to conduct two-sample MR analysis. The robustness of the IVW results was assessed through alternative approaches, including MR-Egger regression, the weighted median (WM), and the weighted median method (WMM).
Horizontal pleiotropy analysis and heterogeneity testing
The intercept of the MR-Egger model can enable examination of the potential presence of horizontal pleiotropic effects associated with the IV [12]. Given that MR-Egger assumes the inclusion of an intercept term in the model, values near zero suggest minimal disparity between the causal effects estimated by MR-Egger and IVW, thereby indicating the absence of horizontal pleiotropy among the IVs. In contrast, a substantial deviation from zero for the intercept term may suggest the existence of horizontal pleiotropy among the IVs. Additionally, we used the Cochran Q statistic to assess the presence of heterogeneity. If the P-value of the Cochran Q test reached statistical significance, the findings were considered to exhibit heterogeneity. Additionally, a leave-one-out analysis was conducted to determine the reliability of the overall effect. This analysis evaluated the influence of the remaining SNPs on the overall causal estimation, excluding individual SNPs in a sequential manner.
Statistical methods
The statistical tests used in this analysis were two-sided, with a significance threshold of P < 0.05. The results of the MR analysis are presented as odds ratios (OR) and 95% confidence intervals (CIs). To visually represent the outcomes obtained with the coefficient ratio method, MR method, and leave-one-out analysis, we used forest plots and scatterplots. All statistical analyses were conducted in R software (version 4.0) with the packages TwoSampleMR (version 0.5.5), readr (version 1.4.0), and data.table (version 1.13.2).
Results
Instrumental variables
On the basis of the screening criteria used in the two-sample MR investigation, we incorporated a comprehensive set of 35 SNPs as IVs. Notably, each F-statistic associated with the instrumental exposure surpassed the threshold of 10, thereby indicating successful mitigation of the influence of weak IVs on the outcomes (Table 1).
Table 1 Details of SNPs Associated with Diabetes and Pancreatic Cancer
| Rsid | Chromosome | EA | OA | Position | EAF | Exposure | Outcome | ||||||||
|---|---|---|---|---|---|---|---|---|---|---|---|---|---|---|---|
| β | SE | P | R2 | F | β | SE | P | R2 | F | ||||||
| rs10096381 | 8 | T | G | 10831868 | 0.519982 | −0.00700709 | 0.00106833 | 5.40E-11 | 1.72E-04 | 43.01907469 | 0.0407178 | 0.0489458 | 0.405495 | 1.80E-04 | 0.691689524 |
| rs11212197 | 11 | A | G | 107344724 | 0.326494 | 0.00623969 | 0.00113638 | 4.00E-08 | 1.21E-04 | 30.14917173 | 0.0735292 | 0.0522872 | 0.15947 | 5.15E-04 | 1.976525224 |
| rs11760498 | 7 | A | G | 106419296 | 0.174535 | 0.00926984 | 0.00141491 | 5.70E-11 | 1.72E-04 | 42.92233758 | 0.0750147 | 0.0644388 | 0.244385 | 3.53E-04 | 1.354476006 |
| rs12154627 | 7 | C | T | 130438214 | 0.493833 | −0.00810955 | 0.00107529 | 4.60E-14 | 2.28E-04 | 56.87728 | −0.00330546 | 0.0488892 | 0.945518 | 1.19E-06 | 0.004568897 |
| rs1275986 | 2 | A | C | 26912079 | 0.616567 | −0.0140618 | 0.00109576 | 1.10E-37 | 6.59E-04 | 164.6825069 | 0.0446836 | 0.049457 | 0.36666 | 2.13E-04 | 0.815857337 |
| rs12926550 | 16 | A | G | 81510742 | 0.316953 | −0.00781637 | 0.00114854 | 1.00E-11 | 1.85E-04 | 46.3142345 | 0.0433468 | 0.0527456 | 0.411234 | 1.76E-04 | 0.675017545 |
| rs1401982 | 12 | A | G | 89989599 | 0.591633 | 0.00757356 | 0.00108408 | 2.80E-12 | 1.95E-04 | 48.80608791 | 0.101479 | 0.0493356 | 0.0396232 | 1.10E-03 | 4.228681544 |
| rs1427298 | 2 | T | C | 145214421 | 0.42856 | −0.00631014 | 0.00108523 | 6.10E-09 | 1.35E-04 | 33.80889133 | 0.0322736 | 0.0482919 | 0.504066 | 1.16E-04 | 0.446395379 |
| rs1581717 | 6 | A | C | 51838263 | 0.482706 | 0.00595773 | 0.00106209 | 2.00E-08 | 1.26E-04 | 31.46556373 | 0.0241071 | 0.0469516 | 0.608142 | 6.87E-05 | 0.263489065 |
| rs1722883 | 7 | C | T | 134215403 | 0.470715 | −0.00616213 | 0.00107003 | 8.50E-09 | 1.33E-04 | 33.16395568 | −0.0176549 | 0.0474966 | 0.710269 | 3.60E-05 | 0.13809531 |
| rs17514846 | 15 | A | C | 91416550 | 0.470029 | 0.00915834 | 0.00107361 | 1.50E-17 | 2.91E-04 | 72.76741556 | −0.057841 | 0.0479072 | 0.227107 | 3.80E-04 | 1.456946012 |
| rs17608766 | 17 | C | T | 45013271 | 0.144532 | 0.00918956 | 0.00151101 | 1.20E-09 | 1.48E-04 | 36.98718503 | 0.0379699 | 0.0712614 | 0.593976 | 7.40E-05 | 0.283755088 |
| rs2023843 | 7 | T | C | 27243221 | 0.926089 | 0.0184205 | 0.002034 | 1.30E-19 | 3.28E-04 | 82.01578635 | −0.0164637 | 0.0886552 | 0.852422 | 8.99E-06 | 0.034468304 |
| rs2293607 | 3 | C | T | 169492101 | 0.243213 | −0.00688 | 0.00123956 | 2.90E-08 | 1.23E-04 | 30.80621141 | −0.0258308 | 0.0548406 | 0.638024 | 5.78E-05 | 0.221740371 |
| rs2341599 | 4 | A | G | 156441314 | 0.659813 | −0.00641773 | 0.00112369 | 1.10E-08 | 1.31E-04 | 32.61867935 | 0.0251127 | 0.0503502 | 0.618424 | 6.49E-05 | 0.248632484 |
| rs2977324 | 8 | G | T | 76725867 | 0.700562 | 0.00703342 | 0.0011681 | 1.70E-09 | 1.45E-04 | 36.25513927 | 0.0438474 | 0.0532649 | 0.409945 | 1.77E-04 | 0.677296625 |
| rs305226 | 1 | G | A | 89307261 | 0.617782 | −0.00611639 | 0.00109575 | 2.40E-08 | 1.25E-04 | 31.15759315 | −0.0973082 | 0.0503052 | 0.0529273 | 9.75E-04 | 3.73978443 |
| rs3824869 | 11 | C | T | 47407439 | 0.636175 | −0.00670491 | 0.00110877 | 1.50E-09 | 1.46E-04 | 36.56785562 | 0.0864297 | 0.0505933 | 0.0873233 | 7.60E-04 | 2.91684564 |
| rs4705716 | 5 | A | G | 114434126 | 0.515575 | −0.00683232 | 0.00106405 | 1.40E-10 | 1.65E-04 | 41.22957397 | −0.0756938 | 0.0477514 | 0.112951 | 6.55E-04 | 2.511434464 |
| rs4968782 | 17 | A | G | 61548948 | 0.619265 | −0.00723084 | 0.00110106 | 5.10E-11 | 1.73E-04 | 43.12727857 | 0.0449974 | 0.0488101 | 0.356608 | 2.22E-04 | 0.849432546 |
| rs57541197 | 10 | A | G | 63551773 | 0.145028 | −0.0172185 | 0.00151088 | 4.40E-30 | 5.20E-04 | 129.8754923 | −0.140182 | 0.0738204 | 0.057339 | 9.39E-04 | 3.604169162 |
| rs604723 | 11 | C | T | 100610546 | 0.724763 | 0.0127554 | 0.00119841 | 1.90E-26 | 4.53E-04 | 113.2853727 | 0.000300045 | 0.053769 | 0.994818 | 8.12E-09 | 3.11231E-05 |
| rs6468801 | 8 | A | C | 102841031 | 0.772347 | 0.00750863 | 0.00127552 | 3.90E-09 | 1.39E-04 | 34.65320317 | 0.0582649 | 0.0591676 | 0.324576 | 2.53E-04 | 0.969213724 |
| rs7187250 | 16 | A | C | 53818460 | 0.392792 | 0.00765214 | 0.00109059 | 2.30E-12 | 1.97E-04 | 49.23107436 | 0.111184 | 0.0487069 | 0.0224528 | 1.36E-03 | 5.208072976 |
| rs7220198 | 17 | A | G | 79375998 | 0.352773 | −0.00695497 | 0.00112097 | 5.50E-10 | 1.54E-04 | 38.49453375 | −0.120474 | 0.0495315 | 0.0149445 | 1.54E-03 | 5.912853934 |
| rs73306876 | 20 | G | A | 57740605 | 0.11739 | 0.016946 | 0.00166166 | 2.00E-24 | 4.16E-04 | 104.0031743 | 0.00468899 | 0.0711161 | 0.94723 | 1.13E-06 | 0.004345064 |
| rs7340705 | 3 | C | T | 53734531 | 0.322676 | 0.00654432 | 0.00114561 | 1.10E-08 | 1.31E-04 | 32.63262301 | 0.0516432 | 0.0507654 | 0.308846 | 2.70E-04 | 1.034341895 |
| rs740746 | 10 | A | G | 115792787 | 0.732751 | 0.010855 | 0.00120719 | 2.40E-19 | 3.24E-04 | 80.85463459 | 0.0277824 | 0.0538512 | 0.606098 | 6.94E-05 | 0.266024846 |
| rs74661587 | 5 | G | A | 122460332 | 0.132329 | 0.008673 | 0.00156919 | 3.30E-08 | 1.22E-04 | 30.54809628 | 0.0214679 | 0.065583 | 0.743024 | 2.79E-05 | 0.107095203 |
| rs7701003 | 5 | G | A | 157849295 | 0.371692 | −0.0113922 | 0.001101 | 4.30E-25 | 4.29E-04 | 107.0624273 | −0.141218 | 0.0498362 | 0.00455743 | 2.09E-03 | 8.025345233 |
| rs7911644 | 10 | T | C | 18475947 | 0.330189 | 0.00684792 | 0.00113424 | 1.60E-09 | 1.46E-04 | 36.45053943 | 0.0365248 | 0.0501657 | 0.46664 | 1.38E-04 | 0.529828591 |
| rs880315 | 1 | C | T | 10796866 | 0.340613 | 0.0101807 | 0.00112809 | 1.80E-19 | 3.26E-04 | 81.4449766 | 0.0193123 | 0.0497404 | 0.697498 | 3.93E-05 | 0.150668652 |
| rs908951 | 16 | T | C | 89734349 | 0.431483 | −0.00948115 | 0.00107981 | 1.60E-18 | 3.09E-04 | 77.09458349 | 0.0182328 | 0.0486966 | 0.707538 | 3.66E-05 | 0.140114444 |
| rs9375459 | 6 | T | C | 127176162 | 0.43725 | 0.0109051 | 0.00107183 | 2.60E-24 | 4.14E-04 | 103.5151723 | −0.0138961 | 0.0472946 | 0.769653 | 2.25E-05 | 0.086285178 |
| rs9394951 | 6 | T | C | 43352898 | 0.565819 | −0.00769548 | 0.00107235 | 7.20E-13 | 2.06E-04 | 51.49853053 | −0.0105442 | 0.0478655 | 0.825673 | 1.27E-05 | 0.048501539 |
Rsid: identification code for reference single-nucleotide polymorphism; EA: effect allele; OA: other alleles; EAF: effect allele frequency; SE: standard error.
Mendelian randomization results
Table 2 presents the results for four MR methods used to assess the causal relationship between DM and PC. The results obtained with the IVW method suggested that people with DM might have elevated risk of developing PC (OR=1.808, 95% CI: 0.091–35.776, P=0.030). Similarly, the WM method yielded comparable results. Although the results of the WM method did not reach statistical significance because of limited statistical power, a consistent direction of effect was observed with the IVW method, thus indicating a potential trend toward elevated PC risk in people with DM (OR=11.565, 95% CI: 1.000–1.264, P=0.9694).
Table 2 Mendelian Randomization Results in Diabetes Mellitus and Pancreatic Cancer
| Method | Nsnp | β | SE | OR | Lower 95% | Upper 95% | P |
|---|---|---|---|---|---|---|---|
| MR-Egger | 35 | −0.6772 | 3.719 | 0.508037508 | 0.000346912 | 743.9992301 | 0.8566 |
| Weighted median | 35 | 0.5922 | 1.523 | 1.807961559 | 0.09136617 | 35.7760974 | 0.6974 |
| Inverse variance weighted | 35 | 2.448 | 1.125 | 11.56519319 | 1.275068624 | 104.8992116 | 0.0296 |
| Weighted mode | 35 | −0.2474 | 2.355 | 0.7808283 | 0.007725722 | 78.91726301 | 0.9169 |
Nsnp: number of SNPs; SE: standard error; OR: odds ratios; β: effect size of each allele for each SNP and phenotypic association.
Furthermore, we conducted computations and visualizations to determine both individual IV and combined causal effect estimates. The outcomes of the MR statistical approach and the causal effects derived from the individual IVs are summarized as a forest plot (Figure 3). The dots in the plot indicate the calculated beta values, and the horizontal line represents the 95% CI of beta. The red line indicates the estimated causal effect obtained through the MR method. Notably, the horizontal line corresponding to the IVW method in the figure did not intersect with the dotted line, thereby indicating statistical significance.
Figure 3 Forest plot of estimated causal effects of diabetes mellitus–associated SNPs on pancreatic cancer.

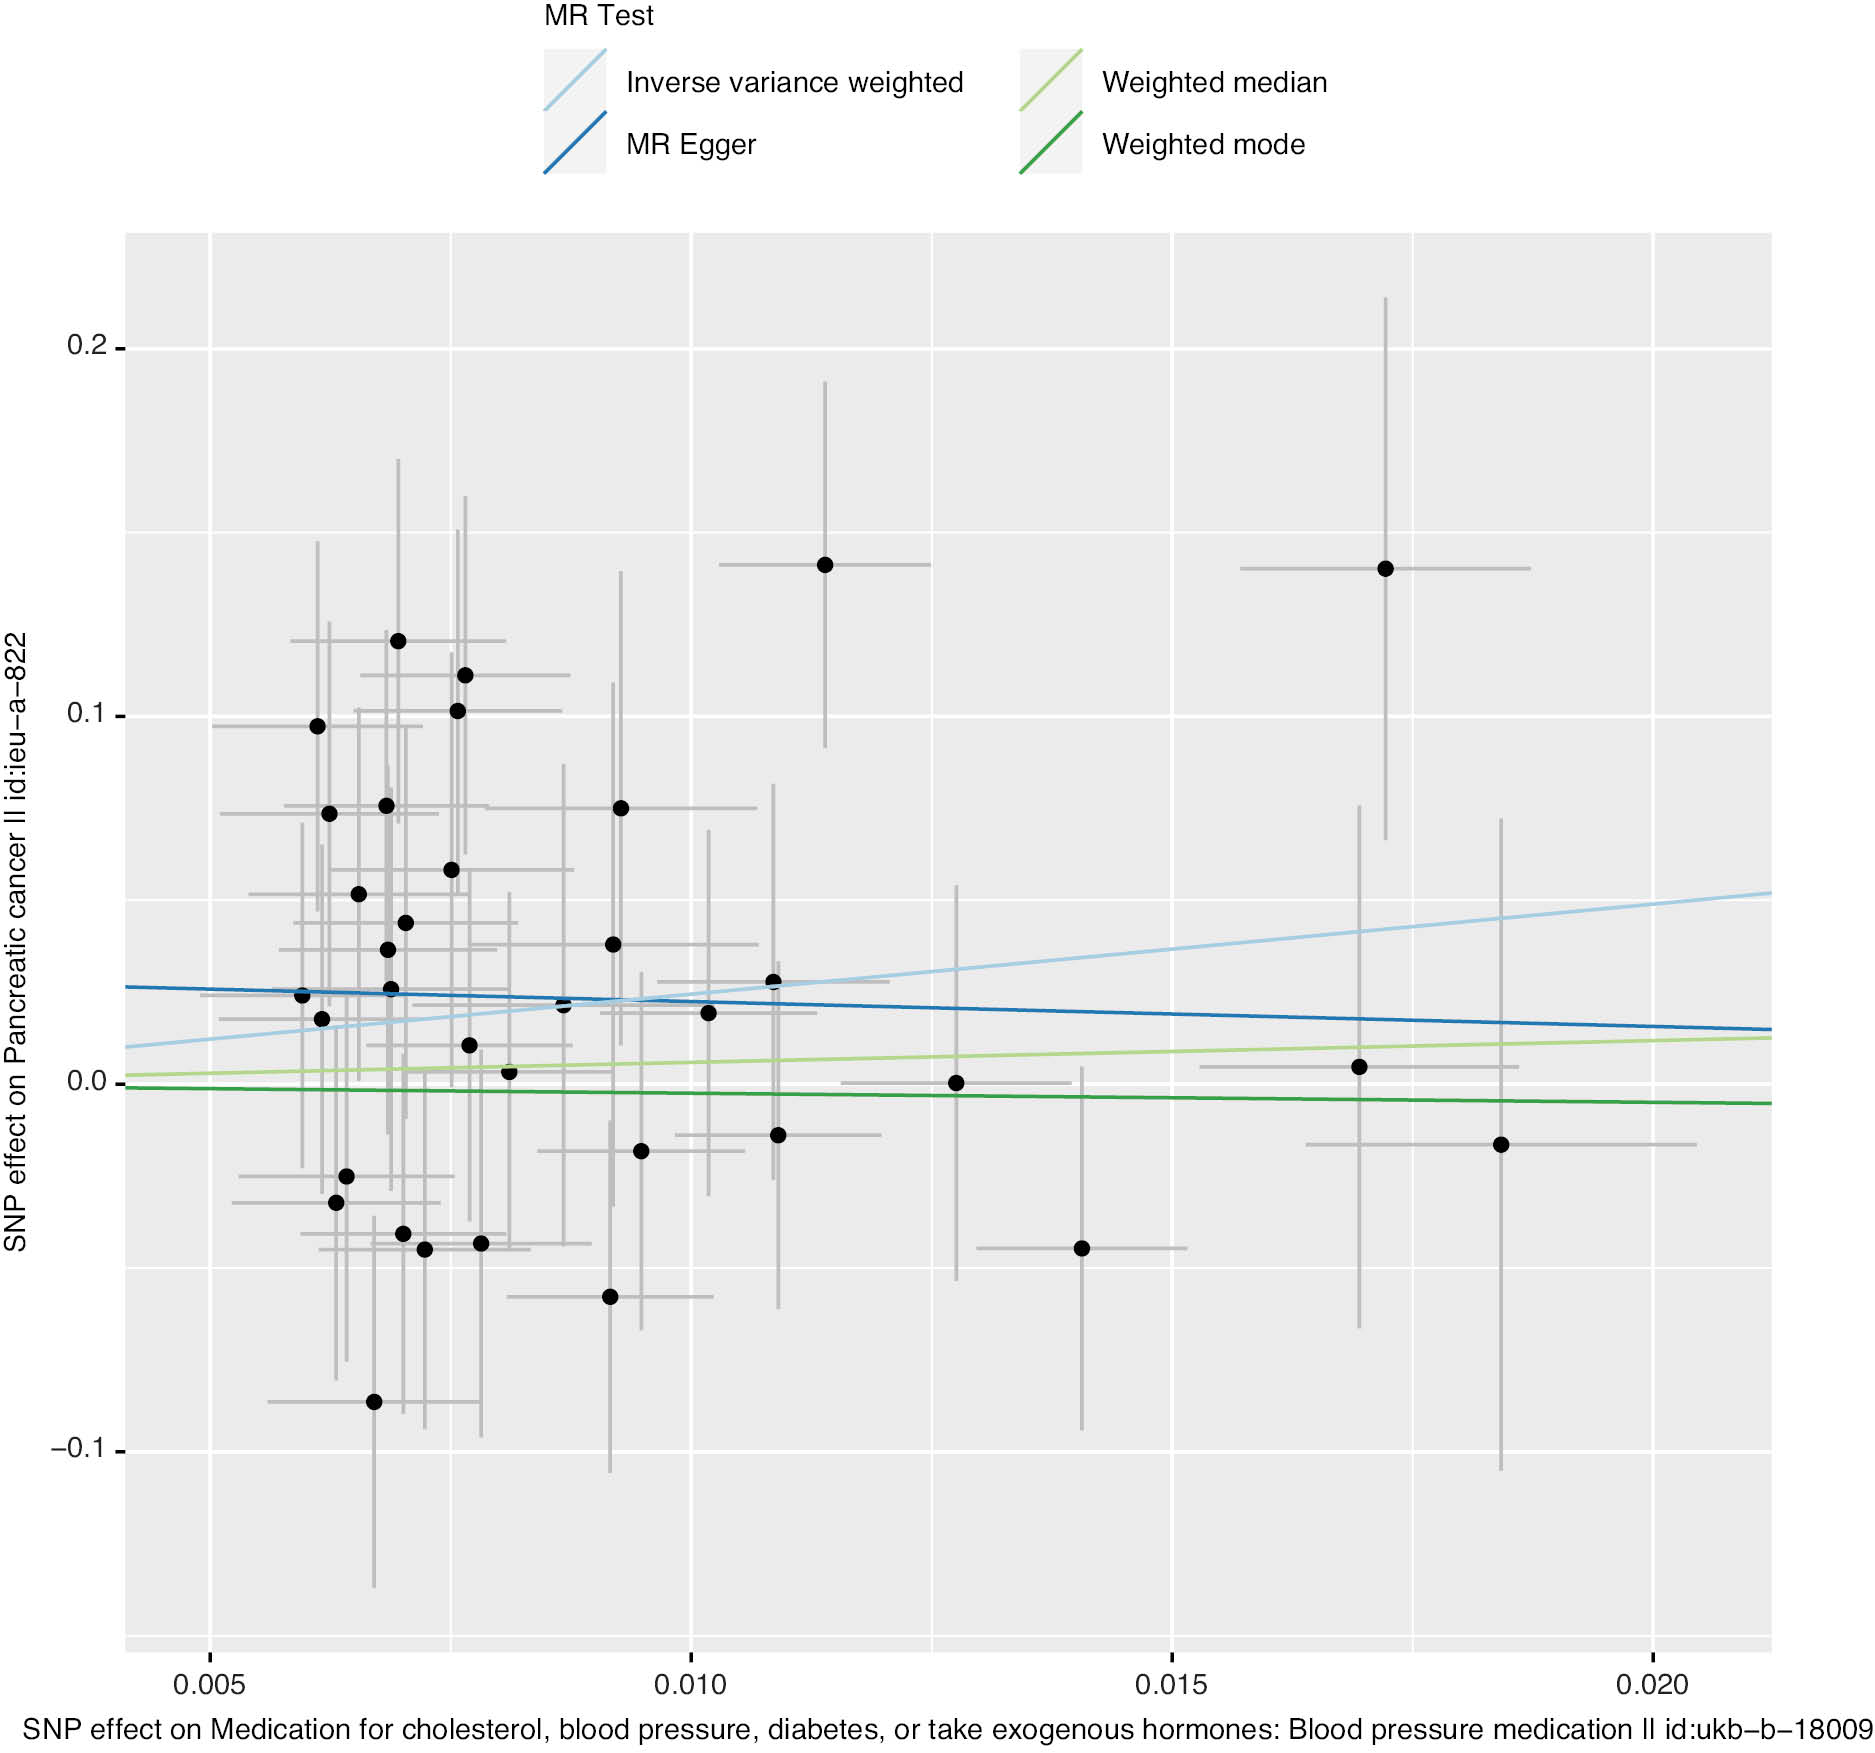
Figure 4 displays scatterplots illustrating the causal effect estimates for individual SNPs and the four MR methods. Each black dot corresponds to an IV, with the abscissa denoting the SNP’s effect on DM and the ordinate representing its effect on PC. The extended vertical and horizontal lines depict the 95% CI of the IV’s causal effect on the respective disease. The slopes of the four colored lines indicate the estimated values of the causal effects, as determined by the four MR methods.
Figure 4 Scatterplot of estimated causal effects of diabetes mellitus–associated SNPs on pancreatic cancer.
Cochran’s Q test showed no heterogeneity in effect estimates for all IVs (QEgger=42.58, PEgger=0.1227, I2Egger=0.225; QIVW=43.58, PIVW=0.1257, I2IVW=0.220; Table 3). In Cochran’s Q test, I2 > 25% and p < 0.05 indicated significant heterogeneity.
Table 3 Cochran’s Q Test Results
| Method | Q | df | I2 | P |
|---|---|---|---|---|
| Inverse variance weighted | 43.58 | 34 | 0.219825608 | 0.1257 |
| MR-Egger | 42.58 | 33 | 0.224988257 | 0.1227 |
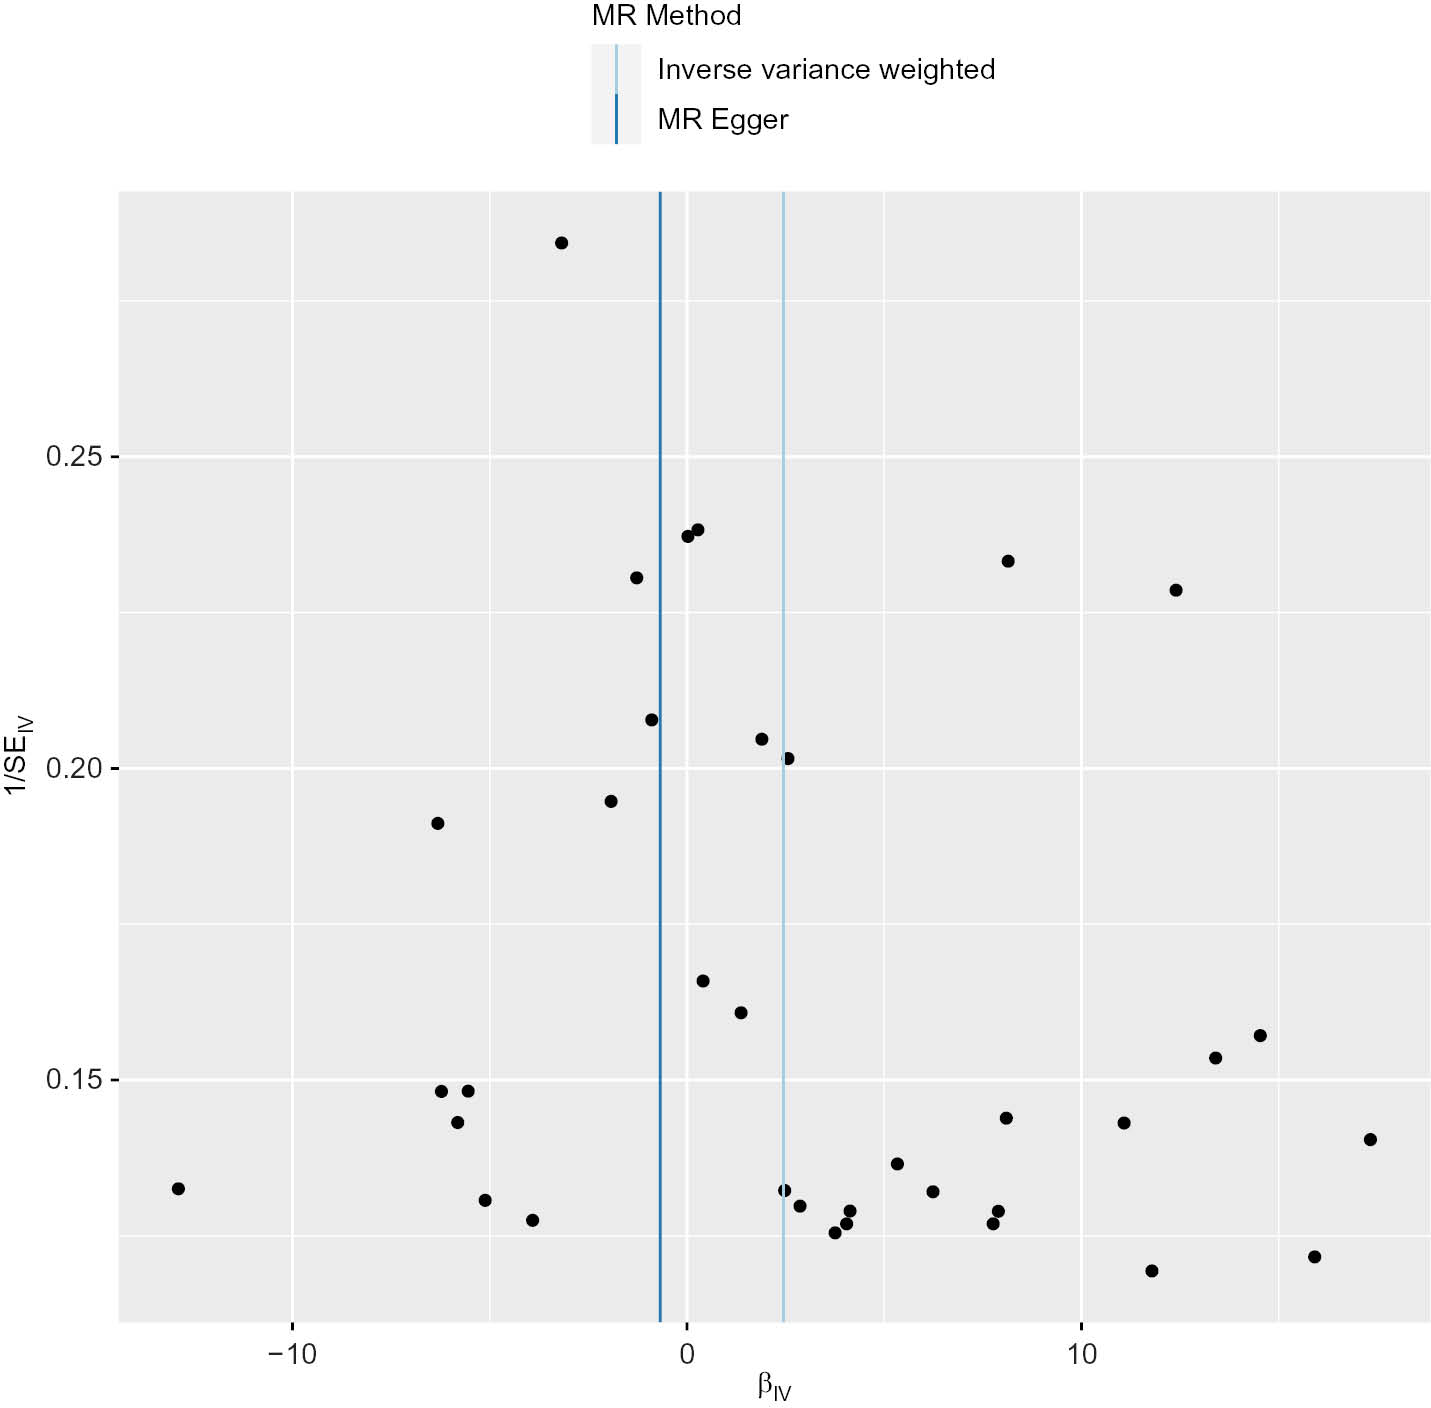
The MR-Egger regression intercept indicated no directional pleiotropic effects in the relationship between DM and PC (MR-Egger intercept=0.029, P=0.384). Additionally, the funnel plot analysis demonstrated that the scatter points representing the causal association effect were symmetrically distributed when SNPs were individually used as variables, thus suggesting an absence of potential bias in the findings (Figure 5).
Figure 5 Mendelian randomization funnel plot.
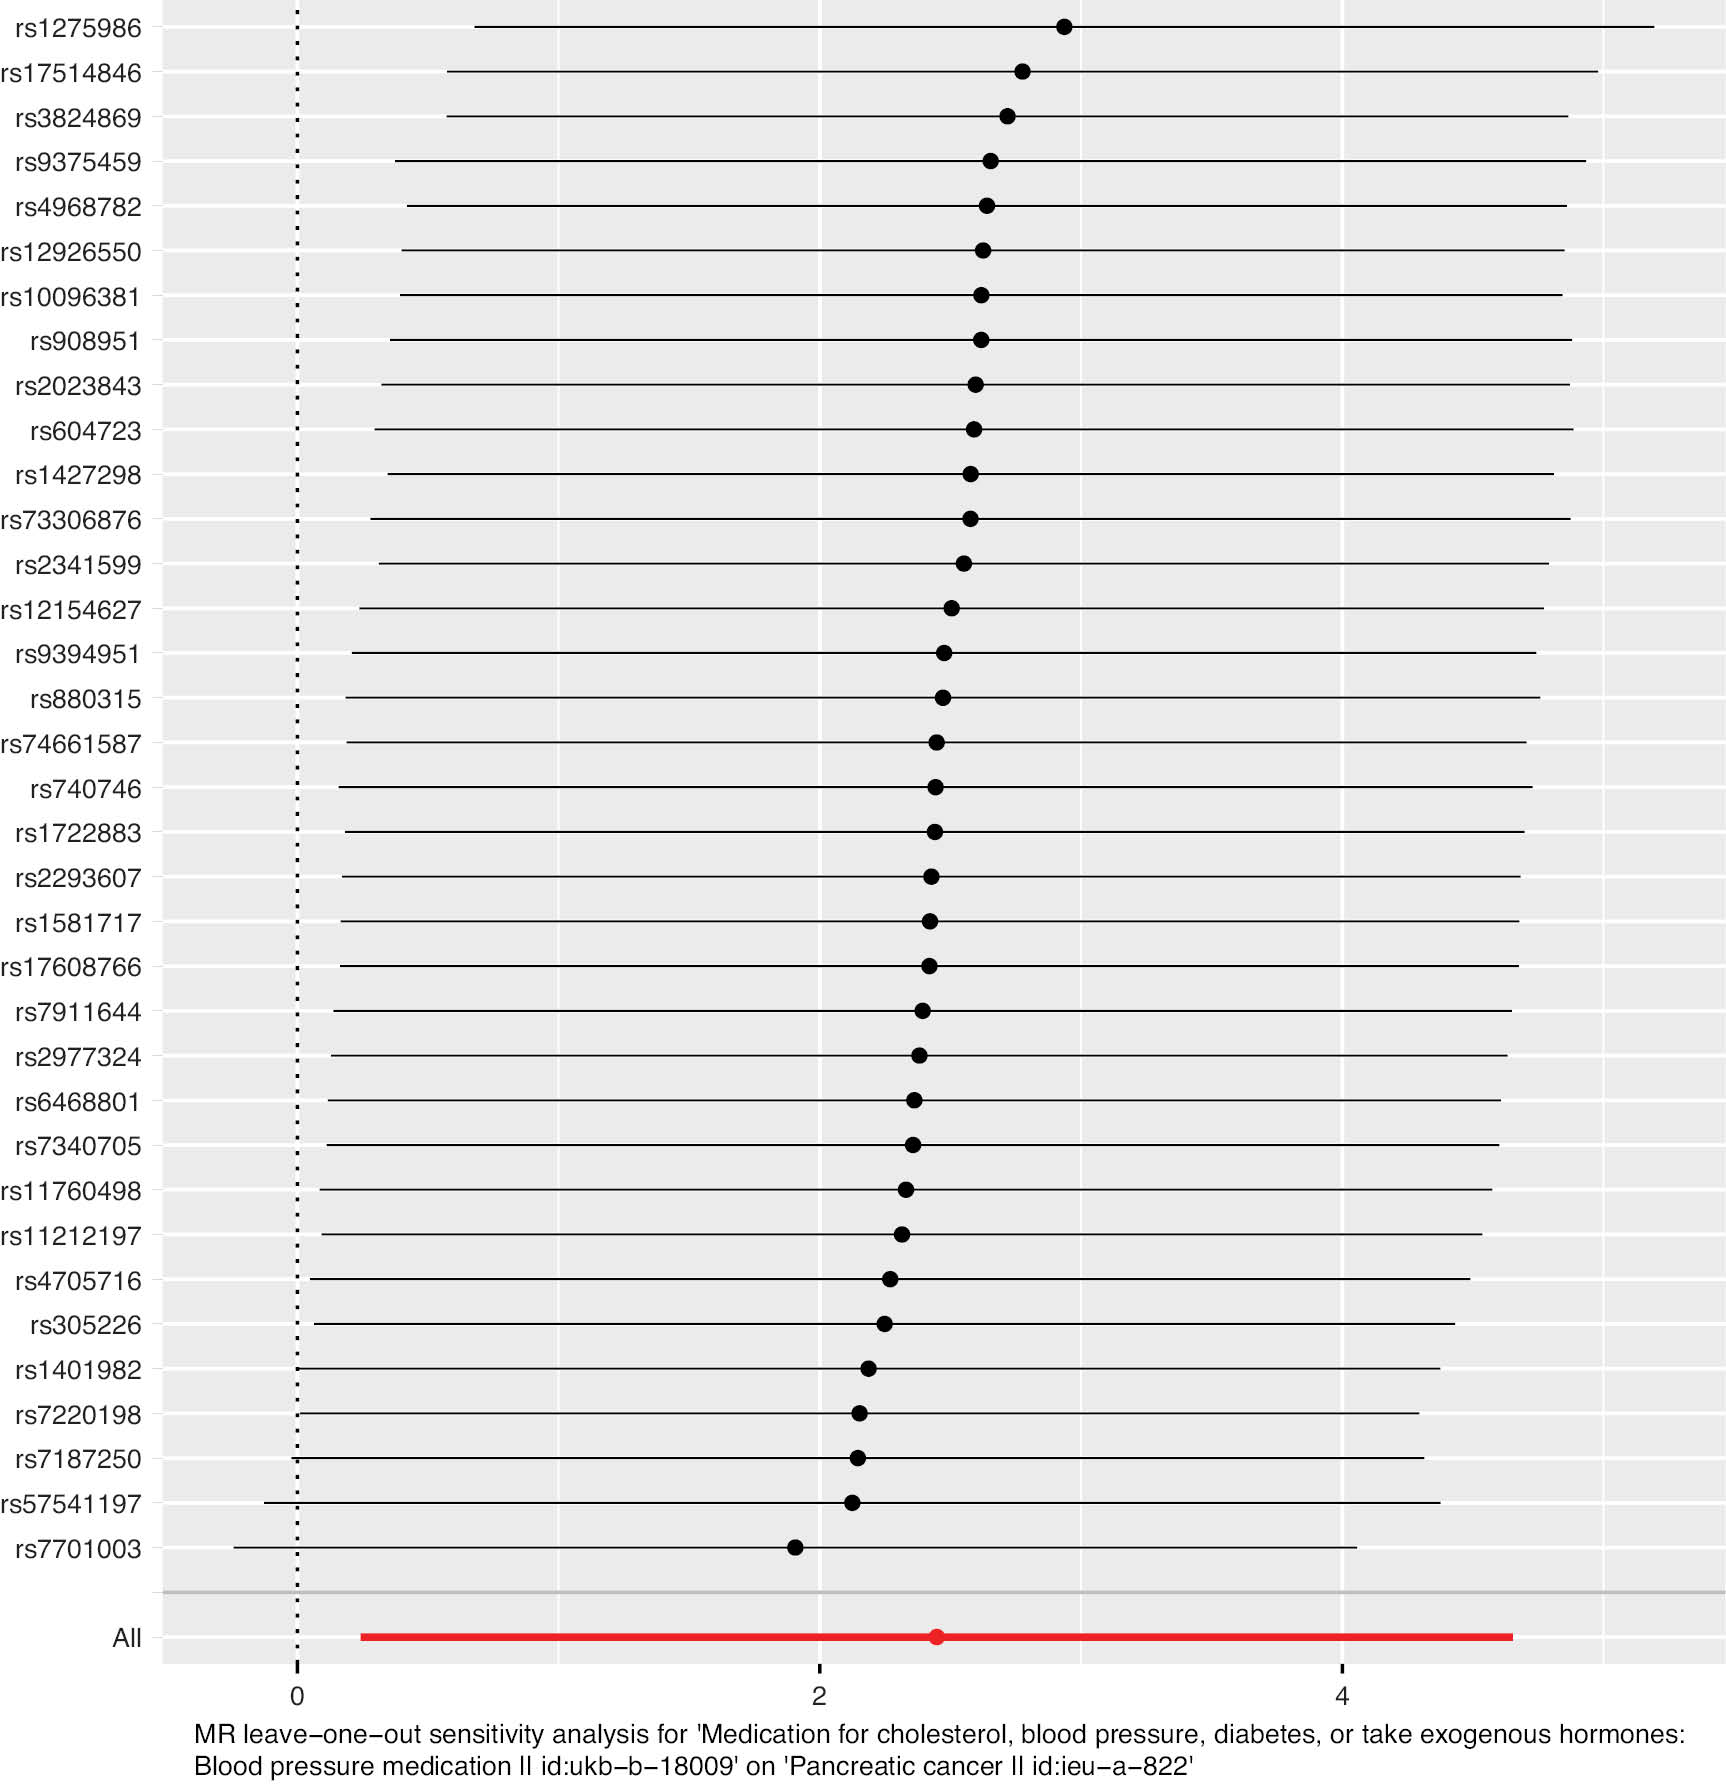
The outcomes of leave-one-out analysis are presented as a forest plot (Figure 6). The black line indicates the effects of all SNPs remaining after exclusion of the respective SNP. In contrast, the red line illustrates the cumulative effect without elimination of any SNPs. The dots and horizontal lines represent the beta value of the effect and its 95% CI. The SNPs rs1401982, rs7701003, rs7220198, and rs57541197 were excluded. The remaining SNPs were situated to the right of the dashed line, thereby demonstrating the strength of the findings and their independence from the effect of a solitary SNP.
Figure 6 Results of leave-one-out analysis of diabetes mellitus and pancreatic cancer.
Discussion
PC is a profoundly malignant neoplasm affecting the digestive system. It is the fourth leading cause of cancer-associated mortality in the United States and is projected to became the second leading cause by 2030 [13]. Early detection through screening is critical for mitigating mortality rates. However, because of the relatively low prevalence of PC, routine screening of asymptomatic patients through conventional methods is not economically advantageous and has poor compliance. Numerous investigations have been aimed at identifying cohorts at high risk [14]. However, a family history of PC is currently the only indication considered for PC screening [15]. Therefore, better identification of high-risk groups is necessary to enable early PC diagnosis and treatment.
The association between DM and PC risk has been a longstanding topic of academic investigation. Recent DM onset has been demonstrated to serve as an indicator for certain diseases, particularly PC, and can aid in identifying patients with heightened susceptibility to this condition [16]. However, the relationship between DM and PC is further complicated by the ability of PC itself to induce DM development. Consequently, risk studies must exclude any patients who have acquired diabetes as a consequence of PC, as well as those who have pre-existing DM. It is additionally worth investigating the potential resistance of patients diagnosed with DM towards being categorized as part of a high-risk cohort for early screening of PC.
The main aim of this study was to investigate the possible presence of a causal link between DM and PC. Previous research efforts have been impeded by the impracticability of conducting randomized controlled trials, thus limiting the ability to adequately control for confounding variables. Consequently, the findings from previous observational studies might have been influenced by confounding bias or reverse causality, thereby preventing consistent conclusions from being drawn. Our research used a GWAS-based MR method to address potential confounding variables and reverse causality, thereby allowing for investigation of the causal relationship between DM and PC at the genetic level. In contrast to previous studies, our results provide supplementary evidence that strengthens the argument that DM increases vulnerability to PC, thereby conclusively establishing DM as a risk factor for PC. Elena et al. have conducted a retrospective study indicating an association between DM and PC risk. Additionally, clinical studies [17] have suggested that approximately 50% of patients with PC are diagnosed with DM, and the duration of DM correlates with PC. These investigations have provided valuable insights into potential epidemiological links between DM and PC. Nevertheless, caution is necessary when interpreting these observational findings. In the present study, we used a two-sample MR analysis to investigate the association between DM as the exposure factor and PC as the outcome event. Our analysis revealed no indications of horizontal pleiotropy and demonstrated homogeneity among IVs. Consequently, we used the IVW method as the primary outcome measure, supplemented by the WM approach for additional analysis. The findings of this study provide substantial evidence supporting an elevated risk of PC in people with DM; establish a causal relationship between DM and PC; and suggest elevated PC susceptibility among people with DM.
The correlation between DM and PC continues to be a topic of ongoing scholarly discourse. Previous research has suggested that insulin-like growth factor (IGF) and insulin play crucial roles in regulating energy metabolism and growth. In vitro studies have shown that excess insulin promotes the survival and proliferation of PC cells [18]. The IGF system, which includes IGF, its receptors, and associated binding proteins [19], is frequently characterized by elevated insulin and IGF-1 in people with type 2 DM [20]. In a prospective study conducted on European populations, researchers have observed a significant association between elevated IGF-1 or diminished IGF-BP3 in the serum and susceptibility to PC [21]. Experimental investigations have further demonstrated that the introduction of exogenous insulin or IGF-1 stimulates the proliferation of PC cell lines [22]. This proliferative effect is mediated by activation of the MAPK pathway through binding of insulin and IGF-1 to their receptors IR and IGF-1R, respectively [22]. Additionally, PI3K pathway activation enhances the anti-apoptotic capabilities of cancer cells [22]. Additional research has demonstrated that a ketogenic diet has the potential to mitigate transient feedback hyperglycemia in the context of tumor treatment involving PI3K inhibitors [23]. This finding has major implications for anti-tumor therapy in patients with insulin resistance or diabetes mellitus. Moreover, elevated metabolic stress protein TRB3 in tumor cells has multifaceted effects on insulin/IGF-mediated production of reactive oxygen species, apoptosis, and tumor cell autophagy inhibition through its interaction with P62, thereby facilitating tumor initiation and progression [24]. Moreover, hyperglycemia may lead to oxidative stress, which is caused by an imbalance between reactive oxygen species and antioxidants [25]. Most patients diagnosed with DM have elevated blood glucose levels, which stimulate the generation of reactive oxygen species [26], thereby augmenting the invasiveness of cancerous cells and facilitating the initiation and progression of PC. Oxidative stress and inflammatory conditions have been postulated to be early stages in the development insulin resistance, accompanied by heightened levels of oxidative stress and inflammatory markers [27, 28], such as nuclear factor-κB and diverse signal transduction molecules and transcriptional activation proteins that activate signaling pathways and subsequently stimulate PC progression [29]. On the basis of the aforementioned analysis, we propose that inhibition of the IGF signaling pathway might potentially mitigate susceptibility to PC in people with diabetes.
This study has several limitations that should be acknowledged. First, the samples used in this study consisted of solely people of European ancestry. Thus, future studies must include samples from participants of other rases, such as those with Asian and African ancestry. Second, the data obtained in this study were derived from GWAS summaries, thereby precluding the exclusion of potential confounding factors such as alcohol consumption and smoking. Finally, the precise mechanism through which diabetes increases the likelihood of PC remains elusive; therefore, further investigation is warranted to support our findings.
Conclusion
This study used MR research methods to establish a causal relationship between DM and the occurrence of PC. Individuals diagnosed with DM are a high-risk population requiring early screening for PC. The IGF signaling pathway potentially plays a crucial role in mediating the influence of DM on PC development. Therefore, timely medication interventions must be prioritized to prevent PC progression in patients with DM.
Acknowledgements
Not applicable.
Funding
This study was supported by: Key Laboratory of Tumor Precision Medicine, Hunan colleges and Universities Project (2019-379). Hunan Provincial Natural Science Foundation (2023JJ50401). Macao Polytechnic University (RP/FCA-15/2022). Science and Technology Development Fund of Macau SAR (0105/2022/A).
Availability of data and materials
Not applicable.
Authors’ contributions
Xie Hui, Zuliang Deng, and Tan Tao designed the study; Wenxing Long and Hanping Duan searched the data; Xie Hui, Zuliang Deng, and Tan Tao analyzed and interpreted the literature and made major contributions in writing the manuscript. Xie Hui and Tan Tao revised the manuscript.
Conflict of interest statement and consent for publication
The authors have no ethical, legal, or financial conflicts associated with the article. All authors have read and approved the manuscript for publication.
References
- Liang LM, Zhou JJ, Xu F, Liu PH, Qin L, et al. Diabetes downregulates peptide transporter 1 in the rat jejunum: possible involvement of cholate-induced FXR activation. Acta Pharmacol Sin 2020;41(11):1465-75. [PMID: 32341465 DOI: 10.1038/s41401-020-0408-4]
- Chukwunonso Obi B, Chinwuba Okoye T, Okpashi VE, Nonye Igwe C, Olisah Alumanah E. Comparative study of the antioxidant effects of metformin, glibenclamide, and repaglinide in alloxan-induced diabetic rats. J Diabetes Res 2016;2016:1635361. [PMID: 26824037 DOI: 10.1155/2016/1635361]
- Ogurtsova K, da Rocha Fernandes JD, Huang Y, Linnenkamp U, Guariguata L, et al. IDF diabetes atlas: global estimates for the prevalence of diabetes for 2015 and 2040. Diabetes Res Clin Pract 2017;128:40-50. [PMID: 28437734 DOI: 10.1016/j.diabres.2017.03.024]
- Chen H, Yu Y, Zhou L, Chen J, Li Z, et al. Cuproptosis-related LncRNAs signature as biomarker of prognosis and immune infiltration in pancreatic cancer. Front Genet 2023;14:1049454. [PMID: 36713077 DOI: 10.3389/fgene.2023.1049454]
- Sung H, Ferlay J, Siegel RL, Laversanne M, Soerjomataram I, et al. Global cancer statistics 2020: GLOBOCAN estimates of incidence and mortality worldwide for 36 cancers in 185 countries. CA Cancer J Clin 2021;71(3):209-49. [PMID: 33538338 DOI: 10.3322/caac.21660]
- Zhang X, Ren D, Wu X, Lin X, Ye L, et al. miR-1266 contributes to pancreatic cancer progression and chemoresistance by the STAT3 and NF-κB signaling pathways. Mol Ther Nucleic Acids 2018;11:142-58. [PMID: 29858050 DOI: 10.1016/j.omtn.2018.01.004]
- Eze IC, Imboden M, Foraster M, Schaffner E, Kumar A, et al. Exposure to night-time traffic noise, melatonin-regulating gene variants and change in glycemia in adults. Int J Environ Res Public Health 2017;14(12):1492. [PMID: 29194408 DOI: 10.3390/ijerph14121492]
- Wang F, Adrian TE, Westermark G, Gasslander T, Permert J. Dissociated insulin and islet amyloid polypeptide secretion from isolated rat pancreatic islets cocultured with human pancreatic adenocarcinoma cells. Pancreas 1999;18(4):403-9. [PMID: 10231847 DOI: 10.1097/00006676-199905000-00012]
- Molina-Montes E, Coscia C, Gómez-Rubio P, Fernández A, Boenink R, et al. Deciphering the complex interplay between pancreatic cancer, diabetes mellitus subtypes and obesity/BMI through causal inference and mediation analyses. Gut 2021;70(2):319-29. [PMID: 32409590 DOI: 10.1136/gutjnl-2019-319990]
- Davey Smith G, Hemani G. Mendelian randomization: genetic anchors for causal inference in epidemiological studies. Hum Mol Genet 2014;23(R1):R89-98. [PMID: 25064373 DOI: 10.1093/hmg/ddu328]
- Wu Y, Liu J, Page D, Peissig P, McCarty C, et al. Comparing the value of mammographic features and genetic variants in breast cancer risk prediction. AMIA Annu Symp Proc 2014;2014:1228-37. [PMID: 25954434]
- Zhan Y, Hägg S. Association between genetically predicted telomere length and facial skin aging in the UK Biobank: a Mendelian randomization study. Geroscience 2021;43(3):1519-25. [PMID: 33033864 DOI: 10.1007/s11357-020-00283-0]
- Siegel RL, Miller KD, Jemal A. Cancer statistics. CA Cancer J Clin 2015;64(1):5-29. [PMID: 25559415 DOI: 10.3322/caac.21254]
- Gupta N, Yelamanchi R. Pancreatic adenocarcinoma: a review of recent paradigms and advances in epidemiology, clinical diagnosis and management. World J Gastroenterol 2021;27(23):3158-81. [PMID: 34163104 DOI: 10.3748/wjg.v27.i23.3158]
- Chung HH, Lim KS, Park JK. Clinical clues of pre-symptomatic pancreatic ductal adenocarcinoma prior to its diagnosis: a retrospective review of CT scans and laboratory tests. Clin Pract 2022;12(1):70-7. [PMID: 35076498 DOI: 10.3390/clinpract12010008]
- Elena JW, Steplowski E, Yu K, Hartge P, Tobias GS, et al. Diabetes and risk of pancreatic cancer: a pooled analysis from the pancreatic cancer cohort consortium. Cancer Causes Control 2013;24(1):13-25. [PMID: 23112111 DOI: 10.1007/s10552-012-0078-8]
- Polvani S, Tarocchi M, Tempesti S, Bencini L, Galli A. Peroxisome proliferator activated receptors at the crossroad of obesity, diabetes, and pancreatic cancer. World J Gastroenterol 2016;22(8):2441-59. [PMID: 26937133 DOI: 10.3748/wjg.v22.i8.2441]
- Luo XY, Zhang YP, Zheng F, Zhou L. Multiple bioinformatics analysis identifies IGFBP1 as associated with the prognosis of stomach adenocarcinoma. Medicine (Baltimore) 2023;102(13):e33346. [PMID: 37000073 DOI: 10.1097/MD.0000000000033346]
- Shen M, Cao J, Shi H. Effects of estrogen and estrogen receptors on transcriptomes of HepG2 cells: a preliminary study using RNA sequencing. Int J Endocrinol 2018;2018:5789127. [PMID: 30510575 DOI: 10.1155/2018/5789127]
- Carlzon D, Svensson J, Petzold M, Karlsson MK, Ljunggren Ö, et al. Both low and high serum IGF-1 levels associate with increased risk of cardiovascular events in elderly men. J Clin Endocrinol Metab 2014;99(11):E2308-16. [PMID: 25057875 DOI: 10.1210/jc.2014-1575]
- Rohrmann S, Grote VA, Susen B, Rinaldi S, Bueno-de-Mesquita B, et al. Abstract A89: Concentrations of IGF-I and IGFBP3 and pancreatic cancer risk in the European Prospective Investigation into Cancer and Nutrition (EPIC). Cancer Prev Res 2011;4(10 Supplement):A89. [DOI: 10.1158/1940-6207.PREV-11-A89]
- Wang YJ, Wong HS, Wu CC, Chiang YH, Chiu WT, et al. The functional roles of IGF-1 variants in the susceptibility and clinical outcomes of mild traumatic brain injury. J Biomed Sci 2019;26(1):94. [PMID: 31787098 DOI: 10.1186/s12929-019-0587-9]
- Juric D, Krop I, Ramanathan RK, Wilson TR, Ware JA, et al. Phase I dose-escalation study of taselisib, an oral PI3K inhibitor, in patients with advanced solid tumors. Cancer Discov 2017;7(7):704-15. [PMID: 28331003 DOI: 10.1158/2159-8290.CD-16-1080]. [Erratum in: Cancer Discov 2018; 8(11):1491]
- Saltykova IV, Elahi A, Pitale PM, Gorbatyuk OS, Athar M, et al. Tribbles homolog 3-mediated targeting the AKT/mTOR axis in mice with retinal degeneration. Cell Death Dis 2021;12(7):664. [PMID: 34215725 DOI: 10.1038/s41419-021-03944-w]
- Aminzadeh A, Tekiyeh Maroof N, Mehrabani M, Bahrampour Juybari K, Sharifi AM. Investigating the alterations of oxidative stress status, antioxidant defense mechanisms, MAP kinase and mitochondrial apoptotic pathway in adipose-derived mesenchymal stem cells from STZ diabetic rats. Cell J 2020;22(Suppl 1):38-48. [PMID: 32779432 DOI: 10.22074/cellj.2020.6958]
- Cheng Y, Yu X, Zhang J, Chang Y, Xue M, et al. Pancreatic kallikrein protects against diabetic retinopathy in KK Cg-Ay/J and high-fat diet/streptozotocin-induced mouse models of type 2 diabetes. Diabetologia 2019;62(6):1074-86. [PMID: 30838453 DOI: 10.1007/s00125-019-4838-9]
- Lee D, Han Y, Kwon EY, Choi MS. d-allulose ameliorates metabolic dysfunction in C57BL/KsJ-db/db mice. Molecules 2020;25(16):3656. [PMID: 32796637 DOI: 10.3390/molecules25163656]
- Madihi Y, Tavakoli R, Riahinezhad M, Mostofizadeh N, Mehrkash M, et al. Prevalence of nonalcoholic fatty liver disease in children with renal failure underwent treatment with dialysis. Int J Prev Med 2022;13:35. [PMID: 35392322 DOI: 10.4103/ijpvm.ijpvm_410_21]
- Meng QQ, Lei W, Chen H, Feng ZC, Hu LQ, et al. Combined rosiglitazone and forskolin have neuroprotective effects in SD rats after spinal cord injury. PPAR Res 2018;2018:3897478. [PMID: 30034460 DOI: 10.1155/2018/3897478]