Establishment of Hematological and Serum Biochemical Parameters in 4,834 Healthy Cynomolgus Monkeys (Macaca fascicularis)
1Guangdong Laboratory Animals Monitoring Institute, Key Laboratory of Guangdong Laboratory Animals, Guangzhou 510663, China
2Guangdong Blooming-spring Biological Technology Development Co., Ltd., Guangzhou 510940, China
3Kunming Institute of Zoology, Chinese Academy of Sciences, Kunming 650223, China
4Huazheng Laboratory Animal Breeding Centre, Guangzhou 510920, China
aThese authors contributed equally to this work.
*Corresponding to: Ren Huang, E-mail: 1649405216@qq.com; Wen De Li, E-mail: 113587350@qq.com
Received: March 23 2022; Revised: May 28 2022; Accepted: July 11 2022; Published Online: July 26 2022
Cite this paper:
Xueying Ling, Ting Luo, Qingyu Huang, Ying He, Longbao Lv, Yun Wang, Ronghua Ma, Jiewen Chen, Jicun He, Jinrong Zhang, Hongyu Lu, Jian He, Danrong Lin, Siyu Chen, Taiqi Liu, Yangqing Guo, Zhuhong Liu, Jiaqi Feng, Yudan Mao, Zhiying Chen, Ren Huang and Wen De Li. Establishment of Hematological and Serum Biochemical Parameters in 4,834 Healthy Cynomolgus Monkeys (Macaca fascicularis). BIO Integration 2022; 3(4): 151–160.
DOI: 10.15212/bioi-2022-0011. Available at: https://bio-integration.org/
Download citation 
© 2022 The Authors. This is an open access article distributed under the terms of the Creative Commons Attribution License (https://creativecommons.org/licenses/by/4.0/). See https://bio-integration.org/copyright-and-permissions/
Abstract
Background: In China and other countries, cynomolgus monkeys are commonly used experimental animal models in biomedical research. Reference hematologic and biochemical parameters must be established to evaluate healthy cynomolgus monkeys and investigate drug safety in non-clinical research. In the present study, data from 4,834 healthy cynomolgus monkeys were used to establish a reference for various age groups.
Methods: A total of 4834 healthy cynomolgus monkeys (649 males and 4185 females) were selected and divided into six groups according to age and sex. Twenty hematological parameters and 17 serum biochemical parameters were detected, and the effects of age and sex were analyzed.
Results: A reference database of hematological and biochemical parameters was established according to age (six groups) and sex (male and female). Significant differences were observed in White blood cell, Red blood cell, Hemoglobin, Hematocrit, Total protein, Albumin, Total bilirubin, Direct bilirubin, Alkaline phosphatase, Glucose, Blood urea nitrogen, Creatinine, Calcium, Total cholesterol, Triglyceride, and Lactate dehydrogenase values according to age in the juvenile and young groups (P<0.05). Significant differences between males and females were observed in Red blood cell, Hemoglobin, Hematocrit, Mean corpuscular hemoglobin concentration, White blood cell, Lymphocyte, Lymphocyte percentage, Monocyte, Monocyte percentage, Basophil, and Basophil percentage in most age groups (P<0.05).
Conclusion: Reference ranges for healthy cynomolgus monkeys were established in different age and sex groups in this study. The findings may be useful in clinical care and non-human-primate research.
Keywords
Biochemistry, cynomolgus monkeys, hematology, Macaca fascicularis.
Introduction
Abundant non-human-primate resources exist in China. Cynomolgus monkeys (Macaca fascicularis) are highly genetically similar to humans, thus making them important experimental animal models in biomedical research fields [1], including cerebral diseases, traditional Chinese medicine, molecular genetics, pharmacokinetics, and toxicology [2–6]. Given the important roles of these monkeys in research, reference hematologic and biochemical parameters must be established to aid in the assessment of animal health status, and investigation of the effects induced by drugs or treatments.
A prior study has reported the hematological and biochemical parameters of cynomolgus monkeys according to age and sex [7]. Reference clinical pathology data have been reported in another study [8]. A previous report has also investigated the reference values of hematological and biochemical parameters, and compared the differences between two species (cynomolgus monkeys and Rhesus monkeys) [9]. However, although many studies have reported hematologic and biochemical parameters of non-human primates [7, 9–14], only several studies have provided reference data from an extensive number of animals, ranging in age from juvenile to old.
Therefore, his study was aimed at establishing a reference database of hematologic and biochemical parameters of cynomolgus monkeys according to age and sex, to provide a basis for selecting healthy animals for constructing disease models, and for improving the effectiveness of disease diagnosis and treatment.
Materials and methods
Animals
A total of 4,834 healthy cynomolgus monkeys (649 males and 4,185 females) 1–22 years of age (Y), were obtained from three monkey farms at Guangdong Blooming-Spring Biological Technology Development Co., Ltd.; the Kunming Institute of Zoology; and the Huazheng Laboratory Animal Breeding Centre. We divided the animals into six age groups: animals 1–3 Y were in the juvenile group, those 4–6 Y were in the young group, those 7–9 Y were in the adult group, those 10–12 Y were in the middle-age group, those 13–15 Y were in the old group, and those older than 15 Y were in the very old group. All cynomolgus monkeys collected from the three monkey farms were of Chinese origin and were determined to be healthy in annual examinations including their hair, behavior, spirit, activity, skin, joints, excretion, blood parameters, and microbial parameters. All animals had tested negative for tuberculosis and Herpes B virus. In addition, all female monkeys were non-pregnant. The present study and all procedures were approved by the animal care and use committee of Kunming Institute of Zoology, Chinese Academy of Sciences (approval No: IACUC 16006). In addition, all experiments in monkeys from the three monkey farms were conducted in accordance with the Guide for the Care and Use of Laboratory Animals [15]. Hematological and biochemical data were gathered during routine annual quarantine and health monitoring from 2015 to 2017. No animals were sacrificed in this study.
Blood sample collection and preparation
All monkeys were fasted overnight for at least 8 hours before blood was drawn. The males were anesthetized with ketamine hydrochloride, and the females were conscious; 3-mL blood samples were drawn from cephalic veins with syringes. First, the 1-mL blood sample was transferred into a tube containing ethylenediamine tetraacetic acid dipotassium tube, and the blood was adequately mixed by inversion of the tube at least five times. Then 2-mL of the remaining blood sample was transferred into a vacuum drying tube, and kept at room temperature for 30 min. The serum was separated by centrifugation at 1600 g for 15 min.
Hematological analysis
Hematological analysis was performed with a Sysmex XT-2000iv automated hematology analyzer. The following parameters were analyzed: white blood cell count (WBC, 109/L), red blood cell count (RBC, 1012/L), hemoglobin (HGB, g/L), hematocrit (HCT, %), mean corpuscular volume (MCV, fL), mean corpuscular hemoglobin mass (MCH, pg), mean corpuscular hemoglobin concentration (MCHC, g/L), platelets (PLT, 109/L), mean platelet volume (MPV, fL), plateletcrit (PCT, %), neutrophils (NEUT, 109/L), lymphocytes (LYMPH, 109/L), monocytes (MONO, 109/L), eosinophils (EO, 109/L), basophils (BASO, 109/L), neutrophil percentage (NEUT%, %), lymphocyte percentage (LYMPH%, %), monocyte percentage (MONO%, %), eosinophil percentage (EO%, %), and basophil percentage (BASO%, %).
Biochemical analysis
Biochemical analysis was performed with a HITACHI7020 automated biochemical analyzer. The following parameters were analyzed: alanine aminotransferase (ALT, U/L), aspartate aminotransferase (AST, U/L), total protein (TP, g/L), albumin (ALB, g/L), total bilirubin (TBIL, μmol/L), direct bilirubin (DBIL, μmol/L), alkaline phosphatase (ALP, U/L), blood urea nitrogen (BUN, mmol/L), creatinine (CREA, μmol/L), glucose (GLU, mmol/L), total cholesterol (CHOL, mmol/L), triglyceride (TG, mmol/L), high-density-lipoprotein cholesterol (HDL-C, mmol/L), low-density-lipoprotein cholesterol (LDL-C, mmol/L), lactate dehydrogenase (LDH, U/L), calcium (Ca, mmol/L), and phosphorus (P, mmol/L).
Statistical analysis
The hematological and biochemical results were statistically analyzed in SPSS version 22.0, with two-tailed Student’s t-tests and Kruskal-Wallis tests to detect significant differences between age groups for each sex, and between sexes in each age group. The data are reported as mean ± SD, and a p-value less than 0.05 was considered statistically significant.
Results
Hematological and biochemical values
The values of hematological parameters are presented in Table 1. In the juvenile and young groups, age had a statistically significant effect on RBC, HGB, HCT, MCV, MCH, NEUT%, LYMPH%, and BASO% (P<0.05). Compared with the adult and old groups, the WBC, RBC, HGB, and HCT values were significantly higher in the juvenile and young age groups (P<0.05). Significant differences between males and females were observed for RBC, HGB, HCT, MCHC, WBC, LYMPH, LYMPH%, MONO, MONO%, BASO, and BASO% in most age groups (P<0.05).
Table 1 Hematological-Parameter Values by Sex and Age
| Parameters (units) | Age 1–3 Y | Age 4–6 Y | ||||
|---|---|---|---|---|---|---|
| Female (n=99) | Male (n=32) | Both (n=131) | Female (n=729) | Male (n=56) | Both (n=785) | |
| WBC (109/L) | 17.05 ± 3.99 | 18.27 ± 3.41 | 17.38 ± 3.86 | 15.79 ± 4.28 | 14.93 ± 4.56a | 15.73 ± 4.30 |
| RBC (1012/L) | 6.03 ± 0.65 | 6.53 ± 0.38* | 6.14 ± 0.63 | 5.58 ± 0.52a | 5.88 ± 0.62*a | 5.60 ± 0.53 |
| HGB (g/L) | 141.0 ± 12.0 | 153.4 ± 6.7* | 144.0 ± 12.2 | 132.8 ± 10.8a | 143.1 ± 12.4*a | 133.5 ± 11.2 |
| HCT (%) | 46.43 ± 3.93 | 49.70 ± 1.75* | 47.21 ± 3.79 | 44.15 ± 3.57a | 47.18 ± 4.06*acd | 44.35 ± 3.68 |
| MCV (fL) | 77.28 ± 4.59 | 76.04 ± 3.76 | 76.99 ± 4.43 | 79.07 ± 3.75a | 79.97 ± 3.83a | 79.13 ± 3.76 |
| MCH (pg) | 23.47 ± 1.38 | 23.50 ± 1.15 | 23.48 ± 1.32 | 23.88 ± 1.17a | 24.50 ± 1.39*a | 23.93 ± 1.20 |
| MCHC (g/L) | 304.2 ± 9.9 | 308.7 ± 6.8* | 305.3 ± 9.5 | 301.4 ± 9.8 | 304.9 ± 11.1* | 301.7 ± 10.0 |
| PLT (109/L) | 416.5 ± 84.8 | 409.7 ± 80.4 | 414.9 ± 83.5 | 375.1 ± 90.4a | 373.2 ± 90.0 | 374.9 ± 90.3 |
| MPV (fL) | 11.58 ± 1.00 | 11.75 ± 1.38 | 11.62 ± 1.09 | 11.73 ± 1.11 | 11.30 ± 1.27* | 11.70 ± 1.12 |
| PCT (%) | 0.49 ± 0.09 | 0.48 ± 0.06 | 0.48 ± 0.08 | 0.44 ± 0.10a | 0.42 ± 0.09 | 0.44 ± 0.10 |
| NEUT (109/L) | 7.34 ± 3.40 | 5.62 ± 2.15* | 6.89 ± 3.20 | 8.49 ± 3.83 | 7.57 ± 3.40 | 8.42 ± 3.81 |
| LYMPH (109/L) | 7.20 ± 2.14 | 8.66 ± 1.55* | 7.38 ± 2.12 | 5.48 ± 2.39a | 5.65 ± 2.41a | 5.49 ± 2.39 |
| MONO (109/L) | 1.01 ± 0.36 | 1.05 ± 0.26 | 1.02 ± 0.34 | 0.84 ± 0.34a | 0.86 ± 0.34 | 0.84 ± 0.34 |
| EO (109/L) | 0.22 ± 0.15 | 0.24 ± 0.17 | 0.22 ± 0.15 | 0.14 ± 0.14a | 0.16 ± 0.14 | 0.14 ± 0.14 |
| BASO (109/L) | 0.01 ± 0.01 | 0.02 ± 0.01* | 0.02 ± 0.01 | 0.01 ± 0.01a | 0.01 ± 0.01a | 0.01 ± 0.01 |
| NEUT% (%) | 45.08 ± 17.08 | 31.12 ± 6.87* | 41.96 ± 16.45 | 56.76 ± 18.04a | 51.95 ± 18.33a | 56.41 ± 18.09 |
| LYMPH% (%) | 47.36 ± 16.09 | 60.78 ± 5.87* | 50.30 ± 15.50 | 36.23 ± 16.41a | 41.54 ± 17.37*a | 36.61 ± 16.53 |
| MONO% (%) | 5.84 ± 1.91 | 6.22 ± 1.78 | 5.93 ± 1.88 | 5.46 ± 2.21 | 5.40 ± 1.82 | 5.45 ± 2.18 |
| EO% (%) | 1.24 ± 0.93 | 1.30 ± 1.00 | 1.25 ± 0.94 | 0.91 ± 0.90 | 1.05 ± 0.88 | 0.92 ± 0.90 |
| BASO% (%) | 0.09 ± 0.06 | 0.11 ± 0.04 | 0.10 ± 0.06 | 0.07 ± 0.05a | 0.07 ± 0.05a | 0.07 ± 0.05 |
*, Significant (P<0.05) difference with respect to sex.
a, Significant (P<0.05) difference with respect to age group 1–3 Y.
b, Significant (P<0.05) difference with respect to age group 4–6 Y.
c, Significant (P<0.05) difference with respect to age group 7–9 Y.
d, Significant (P<0.05) difference with respect to age group 10–12 Y.
e, Significant (P<0.05) difference with respect to age group 13–15 Y.
| Parameters (units) | Age 7–9 Y | Age 10–12 Y | ||||
|---|---|---|---|---|---|---|
| Female (n=661) | Male (n=82) | Both (n=743) | Female (n=1356) | Male (n=198) | Both (n=1563) | |
| WBC (109/L) | 14.04 ± 4.15ab | 12.95 ± 4.02*a | 13.92 ± 4.15 | 13.00 ± 3.82abc | 11.35 ± 3.54*abc | 12.79 ± 3.82 |
| RBC (1012/L) | 5.59 ± 0.53a | 5.89 ± 0.47*a | 5.62 ± 0.53 | 5.59 ± 0.53a | 5.73 ± 0.49*a | 5.61 ± 0.53 |
| HGB (g/L) | 133.3 ± 11.22a | 143.2 ± 9.5*a | 134.4 ± 11.5 | 132.1 ± 11.1a | 138.2 ± 9.9*abc | 132.9 ± 11.1 |
| HCT (%) | 44.05 ± 3.64a | 46.73 ± 3.31*a | 44.35 ± 3.70 | 43.96 ± 3.52a | 45.34 ± 3.10*abc | 44.14 ± 3.50 |
| MCV (fL) | 78.82 ± 3.74a | 78.97 ± 3.66a | 78.84 ± 3.73 | 78.75 ± 3.93a | 79.29 ± 3.87a | 78.82 ± 3.93 |
| MCH (pg) | 23.93 ± 1.18a | 24.44 ± 1.17*a | 23.98 ± 1.19 | 23.69 ± 1.25bc | 24.17 ± 1.24* | 23.75 ± 1.26 |
| MCHC (g/L) | 303.1 ± 9.2b | 308.0 ± 7.2* | 303.7 ± 9.1 | 300.1 ± 9.1abc | 304.3 ± 8.4*c | 300.6 ± 9.1 |
| PLT (109/L) | 366.2 ± 91.5a | 369.3 ± 75.7 | 366.5 ± 89.9 | 332.9 ± 90.7abc | 313.4 ± 80.2*abc | 330.5 ± 89.6 |
| MPV (fL) | 11.73 ± 1.15 | 11.24 ± 1.17* | 11.68 ± 1.16 | 11.87 ± 1.12 | 11.43 ± 1.10* | 11.81 ± 1.13 |
| PCT (%) | 0.43 ± 0.09a | 0.42 ± 0.08a | 0.43 ± 0.09 | 0.39 ± 0.09abc | 0.36 ± 0.08*abc | 0.39 ± 0.09 |
| NEUT (109/L) | 7.74 ± 3.64b | 7.25 ± 3.33 | 7.69 ± 3.61 | 6.84 ± 3.60bc | 6.34 ± 3.31 | 6.78 ± 3.57 |
| LYMPH (109/L) | 4.84 ± 2.09ab | 4.28 ± 2.23*ab | 4.77 ± 2.11 | 4.77 ± 2.10ab | 3.88 ± 1.69*ab | 4.66 ± 2.07 |
| MONO (109/L) | 0.80 ± 0.34a | 0.70 ± 0.34*ab | 0.79 ± 0.34 | 0.82 ± 0.34a | 0.67 ± 0.29*ab | 0.80 ± 0.34 |
| EO (109/L) | 0.14 ± 0.14a | 0.14 ± 0.13a | 0.14 ± 0.14 | 0.16 ± 0.15a | 0.17 ± 0.15 | 0.16 ± 0.15 |
| BASO (109/L) | 0.01 ± 0.01ab | 0.01 ± 0.01*ab | 0.01 ± 0.01 | 0.01 ± 0.01ab | 0.00 ± 0.00*ab | 0.01 ± 0.01 |
| NEUT% (%) | 56.55 ± 17.21a | 58.76 ± 18.76a | 56.79 ± 17.39 | 53.08 ± 18.35abc | 56.61 ± 17.30*a | 53.53 ± 18.25 |
| LYMPH% (%) | 35.90 ± 15.32a | 34.03 ± 17.52a | 35.69 ± 15.57 | 38.32 ± 16.27ac | 35.46 ± 15.19*a | 37.95 ± 16.16 |
| MONO% (%) | 5.83 ± 2.19b | 5.12 ± 2.09* | 5.75 ± 2.19 | 6.27 ± 2.21bc | 5.92 ± 2.14*c | 6.22 ± 2.20 |
| EO% (%) | 1.05 ± 1.04 | 1.10 ± 1.01 | 1.06 ± 1.03 | 1.20 ± 1.15b | 1.32 ± 1.10 | 1.21 ± 1.14 |
| BASO% (%) | 0.07 ± 0.05 | 0.05 ± 0.06*a | 0.07 ± 0.05 | 0.08 ± 0.05b | 0.05 ± 0.05*a | 0.08 ± 0.05 |
*, Significant (P<0.05) difference with respect to sex.
a, Significant (P<0.05) difference with respect to age group 1–3 Y.
b, Significant (P<0.05) difference with respect to age group 4–6 Y.
c, Significant (P<0.05) difference with respect to age group 7–9 Y.
d, Significant (P<0.05) difference with respect to age group 10–12 Y.
e, Significant (P<0.05) difference with respect to age group 13–15 Y.
| Parameters (units) | Age 13–15 Y | Age above 15 Y | ||||
|---|---|---|---|---|---|---|
| Female (n=837) | Male (n=215) | Both (n=1052) | Female (n=494) | Male (n=66) | Both (n=560) | |
| WBC (109/L) | 12.60 ± 3.80abc | 11.64 ± 3.82*ab | 12.40 ± 3.82 | 11.81 ± 3.41abcde | 11.39 ± 3.30ab | 11.76 ± 3.40 |
| RBC (1012/L) | 5.66 ± 0.56abd | 5.68 ± 0.50ac | 5.67 ± 0.54 | 5.75 ± 0.59abcd | 5.73 ± 0.45a | 5.74 ± 0.58 |
| HGB (g/L) | 133.0 ± 11.8a | 137.7 ± 11.0*ac | 134.0 ± 11.8 | 134.8 ± 13.3abd | 140.0 ± 10.8*a | 135.5 ± 13.1 |
| HCT (%) | 44.33 ± 3.65a | 45.08 ± 3.52*abc | 44.49 ± 3.63 | 45.03 ± 3.99abcde | 45.68 ± 3.24a | 45.11 ± 3.91 |
| MCV (fL) | 78.47 ± 3.93b | 79.52 ± 3.61*a | 78.68 ± 3.89 | 78.40 ± 3.94b | 79.45 ± 2.98*a | 78.53 ± 3.85 |
| MCH (pg) | 23.56 ± 1.29bc | 24.34 ± 1.18*a | 23.72 ± 1.31 | 23.57 ± 1.34bc | 24.53 ± 1.23*a | 23.68 ± 1.36 |
| MCHC (g/L) | 299.4 ± 9.2abc | 305.8 ± 8.7* | 300.7 ± 9.4 | 300.0 ± 9.9ac | 307.5 ± 7.7* | 300.9 ± 10.0 |
| PLT (109/L) | 342.2 ± 93.8abc | 336.9 ± 92.0ac | 341.1 ± 93.4 | 338.5 ± 88.8abc | 311.2 ± 68.2abc | 335.4 ± 87.1 |
| MPV (fL) | 11.78 ± 1.18 | 11.22 ± 1.10* | 11.66 ± 1.19 | 11.81 ± 1.14 | 11.34 ± 1.32* | 11.76 ± 1.17 |
| PCT (%) | 0.40 ± 0.10abc | 0.37 ± 0.09*abc | 0.40 ± 0.09 | 0.40 ± 0.09abc | 0.35 ± 0.06*abc | 0.40 ± 0.09 |
| NEUT (109/L) | 6.38 ± 3.34bcd | 6.38 ± 3.56 | 6.38 ± 3.39 | 5.83 ± 3.20abcd | 6.14 ± 3.30 | 5.86 ± 3.21 |
| LYMPH (109/L) | 4.86 ± 2.11ab | 4.14 ± 1.95*ab | 4.71 ± 2.10 | 4.72 ± 1.99ab | 4.28 ± 1.89ab | 4.66 ± 1.98 |
| MONO (109/L) | 0.84 ± 0.35a | 0.73 ± 0.31*a | 0.82 ± 0.35 | 0.86 ± 0.34a | 0.72 ± 0.33*a | 0.84 ± 0.34 |
| EO (109/L) | 0.19 ± 0.17bcd | 0.18 ± 0.15 | 0.19 ± 0.16 | 0.18 ± 0.16bcd | 0.21 ± 0.17 | 0.19 ± 0.16 |
| BASO (109/L) | 0.01 ± 0.01ab | 0.01 ± 0.00*ab | 0.01 ± 0.01 | 0.01 ± 0.01ab | 0.00 ± 0.00*ab | 0.01 ± 0.01 |
| NEUT% (%) | 50.33 ± 17.61bcd | 53.87 ± 18.71*a | 51.06 ± 17.89 | 49.30 ± 18.06bcd | 52.35 ± 17.56a | 49.66 ± 18.01 |
| LYMPH% (%) | 40.02 ± 15.49abc | 37.41 ± 16.56*a | 39.48 ± 15.74 | 40.73 ± 16.03abc | 38.46 ± 15.75a | 40.46 ± 16.00 |
| MONO% (%) | 6.66 ± 2.32abcd | 6.30 ± 2.18*c | 6.58 ± 2.30 | 7.14 ± 2.26abcde | 6.25 ± 2.41*c | 7.03 ± 2.30 |
| EO% (%) | 1.51 ± 1.29bcd | 1.47 ± 1.13 | 1.50 ± 1.26 | 1.56 ± 1.29bcd | 1.78 ± 1.26bc | 1.59 ± 1.28 |
| BASO% (%) | 0.08 ± 0.05bc | 0.06 ± 0.06*a | 0.08 ± 0.05 | 0.08 ± 0.05b | 0.05 ± 0.05*a | 0.08 ± 0.05 |
*, Significant (P<0.05) difference with respect to sex.
a, Significant (P<0.05) difference with respect to age group 1–3 Y.
b, Significant (P<0.05) difference with respect to age group 4–6 Y.
c, Significant (P<0.05) difference with respect to age group 7–9 Y.
d, Significant (P<0.05) difference with respect to age group 10–12 Y.
e, Significant (P<0.05) difference with respect to age group 13–15 Y.
The biochemical values are presented in Table 2. Significant differences were observed in TP, ALB, TBIL, DBIL, ALP, GLU, BUN, CREA, Ca, CHOL, TG, and LDH according to age in the juvenile and young groups (P<0.05). ALP values were significantly higher in the juvenile age group (1–3 Y) than the adult and old groups. TP values increased with age in the young age groups (1–6 Y) and became stable after adult age. Significant differences between males and females were observed for ALP and CREA in most age groups (P<0.05).
Table 2 Biochemical-Parameter Values by Sex and Age
| Parameters (units) | Age 1–3 Y | Age 4–6 Y | ||||
|---|---|---|---|---|---|---|
| Female (n=99) | Male (n=32) | Both (n=131) | Female (n=729) | Male (n=56) | Both (n=785) | |
| ALT (U/L) | 28.07 ± 12.24 | 29.40 ± 7.51 | 28.42 ± 11.18 | 26.47 ± 17.52 | 26.66 ± 15.46 | 26.48 ± 17.37 |
| AST (U/L) | 51.28 ± 11.37 | 55.82 ± 12.80 | 52.44 ± 11.85 | 51.57 ± 14.62 | 47.16 ± 14.22*a | 51.24 ± 14.62 |
| TP (g/L) | 70.38 ± 6.64 | 68.39 ± 3.92 | 69.83 ± 6.06 | 76.43 ± 7.17a | 75.28 ± 6.49a | 76.35 ± 7.13 |
| ALB (g/L) | 39.50 ± 5.16 | 40.55 ± 2.71 | 39.79 ± 4.63 | 41.32 ± 5.81a | 43.29 ± 5.04*a | 41.47 ± 5.78 |
| TBIL (μmol/L) | 4.07 ± 2.40 | 1.22 ± 0.58* | 3.33 ± 2.43 | 5.22 ± 1.80a | 3.93 ± 2.64*a | 5.13 ± 1.90 |
| D-BIL (μmol/L) | 1.04 ± 0.48 | 0.76 ± 0.36* | 0.97 ± 0.47 | 1.47 ± 0.68a | 1.21 ± 0.54*a | 1.45 ± 0.67 |
| ALP (U/L) | 348.1 ± 190.7 | 587.5 ± 123.1* | 406.3 ± 204.1 | 199.5 ± 91.0a | 251.9 ± 155.8*a | 202.8 ± 97.1 |
| GLU (mmol/L) | 4.95 ± 1.85 | 5.97 ± 1.24* | 5.21 ± 1.77 | 4.03 ± 1.76a | 4.23 ± 1.83a | 4.04 ± 1.76 |
| BUN (mmol/L) | 7.30 ± 1.79 | 9.44 ± 0.85* | 7.83 ± 1.86 | 6.71 ± 1.46a | 7.03 ± 1.36a | 6.73 ± 1.45 |
| CREA (μmol/L) | 61.19 ± 14.37 | 46.57 ± 10.45* | 57.60 ± 14.88 | 76.06 ± 14.52a | 93.89 ± 14.29*a | 77.14 ± 15.12 |
| Ca (mmol/L) | 2.44 ± 0.14 | 2.41 ± 0.10 | 2.43 ± 0.13 | 2.49 ± 0.14a | 2.51 ± 0.12a | 2.49 ± 0.14 |
| P (mmol/L) | 1.67 ± 0.29 | 1.84 ± 0.24* | 1.71 ± 0.29 | 1.59 ± 0.34 | 1.52 ± 0.32a | 1.58 ± 0.34 |
| CHOL (mmol/L) | 2.44 ± 0.94 | 3.08 ± 0.63* | 2.61 ± 0.91 | 2.81 ± 1.03a | 2.61 ± 0.63a | 2.79 ± 1.01 |
| TG (mmol/L) | 0.72 ± 0.37 | 1.01 ± 0.38* | 0.80 ± 0.39 | 0.57 ± 0.25a | 0.63 ± 0.40a | 0.58 ± 0.26 |
| HDL-C (mmol/L) | 1.24 ± 0.47 | 1.52 ± 0.35* | 1.31 ± 0.45 | 1.41 ± 0.53 | 1.40 ± 0.30 | 1.41 ± 0.52 |
| LDL-C (mmol/L) | 1.32 ± 0.53 | 1.60 ± 0.35* | 1.39 ± 0.50 | 1.29 ± 0.55 | 1.17 ± 0.39a | 1.28 ± 0.54 |
| LDH (U/L) | 536.1 ± 149.5 | 620.2 ± 138.6* | 556.7 ± 150.7 | 471.0 ± 207.7a | 475.9 ± 221.7a | 471.3 ± 208.6 |
*, Significant (P<0.05) difference with respect to sex.
a, Significant (P<0.05) difference with respect to age group 1–3 Y.
b, Significant (P<0.05) difference with respect to age group 4–6 Y.
c, Significant (P<0.05) difference with respect to age group 7–9 Y.
d, Significant (P<0.05) difference with respect to age group 10–12 Y.
e, Significant (P<0.05) difference with respect to age group 13–15 Y.
| Parameters (units) | Age 7–9 Y | Age 10–12 Y | ||||
|---|---|---|---|---|---|---|
| Female (n=661) | Male (n=82) | Both (n=743) | Female (n=1365) | Male (n=198) | Both (n=1563) | |
| ALT (U/L) | 27.22 ± 18.21 | 26.70 ± 17.65 | 27.16 ± 18.14 | 22.40 ± 15.31abc | 26.66 ± 15.46 | 22.03 ± 15.12 |
| AST (U/L) | 46.97 ± 13.26ab | 48.49 ± 13.39 | 47.13 ± 13.27 | 42.40 ± 12.61abc | 47.16 ± 14.22*a | 42.11 ± 12.45 |
| TP (g/L) | 77.14 ± 6.73a | 78.74 ± 5.17*ab | 77.31 ± 6.60 | 78.30 ± 6.54abc | 75.28 ± 6.49a | 78.35 ± 6.38 |
| ALB (g/L) | 41.92 ± 5.38a | 46.13 ± 3.53*ab | 42.39 ± 5.37 | 40.98 ± 5.02c | 43.29 ± 5.04*a | 41.41 ± 5.04 |
| TBIL (μmol/L) | 5.19 ± 1.71a | 4.99 ± 1.89ab | 5.17 ± 1.73 | 4.92 ± 1.80abc | 3.93 ± 2.64*a | 4.88 ± 1.78 |
| D-BIL (μmol/L) | 1.43 ± 0.62a | 1.48 ± 0.67a | 1.44 ± 0.62 | 1.62 ± 0.72abc | 1.21 ± 0.54*a | 1.61 ± 0.71 |
| ALP (U/L) | 154.3 ± 58.5ab | 138.3 ± 50.6*ab | 152.5 ± 57.9 | 148.9 ± 54.9ab | 251.9 ± 155.8*a | 144.3 ± 54.6 |
| GLU (mmol/L) | 4.16 ± 1.70a | 3.54 ± 1.25*ab | 4.09 ± 1.67 | 4.14 ± 1.57a | 4.23 ± 1.83a | 4.07 ± 1.54 |
| BUN (mmol/L) | 6.44 ± 1.50ab | 6.98 ± 1.35*a | 6.50 ± 1.50 | 6.42 ± 1.50ab | 7.03 ± 1.36a | 6.48 ± 1.47 |
| CREA (μmol/L) | 77.15 ± 14.23a | 104.1 ± 13.2*ab | 79.36 ± 15.96 | 74.46 ± 14.86ac | 93.89 ± 14.29*a | 77.02 ± 16.69 |
| Ca (mmol/L) | 2.50 ± 0.15a | 2.55 ± 0.11*a | 2.50 ± 0.15 | 2.47 ± 0.14c | 2.51 ± 0.12a | 2.47 ± 0.14 |
| P (mmol/L) | 1.46 ± 0.32ab | 1.49 ± 0.26a | 1.47 ± 0.31 | 1.54 ± 0.33abc | 1.52 ± 0.32a | 1.53 ± 0.33 |
| CHOL (mmol/L) | 3.01 ± 0.99ab | 2.98 ± 0.65b | 3.01 ± 0.96 | 3.08 ± 1.01ab | 2.61 ± 0.63a | 3.06 ± 0.98 |
| TG (mmol/L) | 0.71 ± 0.36b | 0.70 ± 0.53a | 0.71 ± 0.38 | 0.79 ± 0.37bc | 0.63 ± 0.40a | 0.78 ± 0.38 |
| HDL-C (mmol/L) | 1.54 ± 0.51ab | 1.60 ± 0.37b | 1.55 ± 0.50 | 1.54 ± 0.52ab | 1.40 ± 0.30 | 1.54 ± 0.50 |
| LDL-C (mmol/L) | 1.33 ± 0.56 | 1.27 ± 0.48a | 1.33 ± 0.55 | 1.40 ± 0.55b | 1.17 ± 0.39a | 1.38 ± 0.54 |
| LDH (U/L) | 467.7 ± 216.9a | 416.8 ± 205.0a | 462.2 ± 216.1 | 378.4 ± 161.1abc | 475.9 ± 221.7a | 377.3 ± 163.3 |
*, Significant (P<0.05) difference with respect to sex.
a, Significant (P<0.05) difference with respect to age group 1–3 Y.
b, Significant (P<0.05) difference with respect to age group 4–6 Y.
c, Significant (P<0.05) difference with respect to age group 7–9 Y.
d, Significant (P<0.05) difference with respect to age group 10–12 Y.
e, Significant (P<0.05) difference with respect to age group 13–15 Y.
| Parameters (units) | Age 13–15 Y | Age above 15 Y | ||||
|---|---|---|---|---|---|---|
| Female (n=837) | Male (n=215) | Both (n=1052) | Female (n=494) | Male (n=66) | Both (n=560) | |
| ALT (U/L) | 24.81 ± 16.79d | 21.15 ± 14.73*a | 24.06 ± 16.44 | 24.10 ± 16.30 | 25.50 ± 16.10 | 24.26 ± 16.27 |
| AST (U/L) | 42.31 ± 11.89abc | 41.63 ± 11.70abc | 42.17 ± 11.85 | 42.18 ± 11.53abc | 45.26 ± 13.42*ad | 42.55 ± 11.80 |
| TP (g/L) | 78.40 ± 6.43abc | 77.56 ± 5.37*a | 78.23 ± 6.23 | 78.77 ± 6.52abc | 77.72 ± 5.01a | 78.64 ± 6.36 |
| ALB (g/L) | 41.14 ± 4.82 | 42.57 ± 4.12*cd | 41.44 ± 4.71 | 40.73 ± 4.76c | 43.07 ± 3.38*c | 41.02 ± 4.67 |
| TBIL (μmol/L) | 4.82 ± 1.69abc | 4.48 ± 1.53*a | 4.75 ± 1.66 | 4.71 ± 1.68abc | 4.80 ± 1.68a | 4.72 ± 1.68 |
| D-BIL (μmol/L) | 1.45 ± 0.66ad | 1.48 ± 0.67a | 1.46 ± 0.67 | 1.36 ± 0.67ad | 1.31 ± 0.65ad | 1.35 ± 0.67 |
| ALP (U/L) | 148.5 ± 54.1ab | 120.0 ± 44.1*ab | 142.6 ± 53.4 | 148.1 ± 56.7ab | 108.7 ± 36.9*ab | 143.2 ± 56.1 |
| GLU (mmol/L) | 4.48 ± 1.60bcd | 3.85 ± 1.38*a | 4.35 ± 1.57 | 4.80 ± 1.67bcde | 4.38 ± 1.52acd | 4.75 ± 1.66 |
| BUN (mmol/L) | 6.56 ± 1.53a | 6.72 ± 1.39a | 6.59 ± 1.51 | 6.69 ± 1.58ad | 6.83 ± 1.32a | 6.71 ± 1.55 |
| CREA (μmol/L) | 72.06 ± 15.14abcd | 97.60 ± 16.72*ac | 76.57 ± 18.24 | 69.49 ± 15.86abcde | 94.07 ± 14.73*acd | 72.20 ± 17.52 |
| Ca (mmol/L) | 2.49 ± 0.14 | 2.46 ± 0.14*c | 2.48 ± 0.14 | 2.49 ± 0.16 | 2.48 ± 0.11c | 2.49 ± 0.15 |
| P (mmol/L) | 1.58 ± 0.32cd | 1.41 ± 0.32*a | 1.55 ± 0.32 | 1.62 ± 0.32cd | 1.37 ± 0.30*a | 1.59 ± 0.33 |
| CHOL (mmol/L) | 3.16 ± 0.97ab | 2.72 ± 0.76* | 3.07 ± 0.95 | 3.16 ± 0.97ab | 2.71 ± 0.76* | 3.10 ± 0.96 |
| TG (mmol/L) | 0.88 ± 0.46abcd | 0.81 ± 0.47* | 0.87 ± 0.46 | 0.91 ± 0.47abcd | 0.94 ± 0.56bc | 0.91 ± 0.48 |
| HDL-C (mmol/L) | 1.57 ± 0.50ab | 1.43 ± 0.36*c | 1.54 ± 0.48 | 1.57 ± 0.51ab | 1.43 ± 0.39* | 1.56 ± 0.50 |
| LDL-C (mmol/L) | 1.42 ± 0.53b | 1.14 ± 0.47*a | 1.36 ± 0.53 | 1.43 ± 0.52b | 1.11 ± 0.44*a | 1.39 ± 0.52 |
| LDH (U/L) | 410.0 ± 183.6abcd | 389.5 ± 189.1*ab | 405.8 ± 184.8 | 411.4 ± 190.8abcd | 451.8 ± 229.4abd | 416.0 ± 195.7 |
*, Significant (P<0.05) difference with respect to sex.
a, Significant (P<0.05) difference with respect to age group 1–3 Y.
b, Significant (P<0.05) difference with respect to age group 4–6 Y.
c, Significant (P<0.05) difference with respect to age group 7–9 Y.
d, Significant (P<0.05) difference with respect to age group 10–12 Y.
e, Significant (P<0.05) difference with respect to age group 13–15 Y.
Effects of geographical location, breeding conditions and climatic factors on hematological and biochemical values in three monkey farms
All samples originated from three monkey farms: Guangdong Blooming-Spring Biological Technology Development Co., Ltd. (farm 1), the Kunming Institute of Zoology (farm 2), and the Huazheng Laboratory Animal Breeding Centre (farm 3). Because of the variations in the animals’ age distribution among the three farms, we present a comparison of hematological and biochemical values in two age groups (4–6 Y and 7–9 Y) among the three farms (Table 3 and Table 4). A significant difference in RBC, HGB, and HCT values was observed among the three farms in the 4–6 Y group (P<0.05; Table 3). In the 7–9 Y group, no significant differences were observed in MCHC, MPV, NEUT, EO, MONO%, and EO% values among the three farms (P>0.05). No statistically significant difference was found in ALT values among the three farms in both age groups (P>0.05). In the 4–6 Y age group, no significant difference was observed in Ca values in females among the three farms (P>0.05), whereas a significant difference was found in males (P<0.05). In the 7–9 Y age group, no significant differences were observed in the Ca and P values in males and females among the three farms (P>0.05).
Table 3 Comparison of Hematological Values Among the Three Monkey Farms
| Parameters (units) | Female 4–6 Y | Male 4–6 Y | |||
|---|---|---|---|---|---|
| Farm 1 (n=641) | Farm 2 (n=38) | Farm 3 (n=50) | Farm 1 (n=34) | Farm 2 (n=22) | |
| WBC (109/L) | 15.69 ± 4.27 | 17.23 ± 4.31a | 15.84 ± 4.32 | 13.23 ± 3.63 | 17.68 ± 4.65a |
| RBC (1012/L) | 5.57 ± 0.50 | 6.06 ± 0.53ab | 5.38 ± 0.46a | 5.57 ± 0.47 | 6.37 ± 0.52a |
| HGB (g/L) | 132.8 ± 10.31 | 143.17 ± 11.05ab | 125.5 ± 10.70a | 136.03 ± 8.33 | 154.53 ± 8.88a |
| HCT (%) | 44.09 ± 3.43 | 47.83 ± 3.55ab | 42.14 ± 3.53a | 45.09 ± 3.27 | 50.59 ± 2.68a |
| MCV (fL) | 79.16 ± 3.74 | 78.61 ± 3.32 | 78.36 ± 4.25 | 80.43 ± 3.78 | 79.24 ± 3.89 |
| MCH (pg) | 23.95 ± 1.14 | 23.60 ± 1.06 | 23.27 ± 1.43a | 24.54 ± 1.36 | 24.43 ± 1.46 |
| MCHC (g/L) | 301.77 ± 9.84 | 299.29 ± 7.15 | 298.86 ± 11.21a | 305.18 ± 13.77 | 304.59 ± 5.42 |
| PLT (109/L) | 372.32 ± 89.53 | 416.26 ± 104.80a | 381.00 ± 83.80a | 378.81 ± 94.43 | 365.14 ± 84.55 |
| MPV (fL) | 11.74 ± 1.11 | 11.81 ± 1.09 | 11.49 ± 1.06 | 10.93 ± 1.27 | 11.85 ± 1.08a |
| PCT (%) | 0.44 ± 0.10 | 0.50 ± 0.10a | 0.46 ± 0.10 | 0.42 ± 0.08 | 0.43 ± 0.10 |
| NEUT (109/L) | 8.56 ± 3.91 | 8.50 ± 2.70 | 7.64 ± 3.67 | 6.76 ± 2.68 | 8.63 ± 3.99 |
| LYMPH (109/L) | 5.38 ± 2.38 | 7.13 ± 2.16ab | 5.58 ± 2.25 | 5.12 ± 2.35 | 6.82 ± 2.18a |
| MONO (109/L) | 0.83 ± 0.34 | 0.91 ± 0.36 | 0.96 ± 0.32a | 0.81 ± 0.37 | 0.93 ± 0.29 |
| EO (109/L) | 0.14 ± 0.14 | 0.13 ± 0.11 | 0.17 ± 0.16 | 0.11 ± 0.08 | 0.24 ± 0.17a |
| BASO (109/L) | 0.01 ± 0.01 | 0.02 ± 0.01ab | 0.01 ± 0.00 | 0.01 ± 0.01 | 0.01 ± 0.01a |
| NEUT% (%) | 57.69 ± 18.14 | 48.66 ± 9.63a | 51.23 ± 19.35a | 56.49 ± 18.40 | 44.95 ± 16.21a |
| LYMPH% (%) | 35.47 ± 16.51 | 44.62 ± 9.58a | 39.59 ± 17.29 | 37.11 ± 16.94 | 48.39 ± 16.07a |
| MONO% (%) | 5.38 ± 2.18 | 5.75 ± 2.37 | 6.25 ± 2.25a | 5.40 ± 2.02 | 5.39 ± 1.51 |
| EO% (%) | 0.90 ± 0.90 | 0.84 ± 0.78 | 1.06 ± 1.05 | 0.95 ± 0.94 | 1.20 ± 0.77 |
| BASO% (%) | 0.07 ± 0.05 | 0.11 ± 0.04ab | 0.08 ± 0.05 | 0.06 ± 0.05 | 0.08 ± 0.04a |
a, Significant (P<0.05) difference with respect to farm 1.
b, Significant (P<0.05) difference with respect to farm 3.
| Parameters (units) | Female 7–9 Y | Male 7–9 Y | ||||
|---|---|---|---|---|---|---|
| Farm 1 (n=597) | Farm 2 (n=17) | Farm 3 (n=47) | Farm 1 (n=51) | Farm 2 (n=8) | Farm 3 (n=23) | |
| WBC (109/L) | 14.03 ± 4.13 | 16.45 ± 3.39ab | 13.58 ± 4.45 | 12.80 ± 4.33 | 16.47 ± 3.45ab | 11.98 ± 2.77 |
| RBC (1012/L) | 5.57 ± 0.52 | 6.49 ± 0.48ab | 5.57 ± 0.52 | 5.83 ± 0.42 | 6.42 ± 0.15ab | 5.85 ± 0.54 |
| HGB (g/L) | 132.86 ± 10.95 | 152.00 ± 11.54ab | 132.67 ± 9.50 | 141.00 ± 8.39 | 160.00 ± 4.65ab | 142.71 ± 7.43 |
| HCT (%) | 43.91 ± 3.51 | 50.44 ± 3.73ab | 43.70 ± 3.24 | 45.99 ± 2.84 | 52.53 ± 2.08ab | 46.55 ± 2.85 |
| MCV (fL) | 78.88 ± 3.70 | 75.35 ± 3.20ab | 79.06 ± 4.06 | 78.75 ± 3.60 | 80.57 ± 4.79 | 78.90 ± 3.36 |
| MCH (pg) | 23.95 ± 1.14 | 22.55 ± 1.14ab | 24.09 ± 1.33 | 24.28 ± 1.14 | 24.60 ± 1.27 | 24.75 ± 1.18 |
| MCHC (g/L) | 303.07 ± 9.27 | 303.93 ± 6.82 | 303.36 ± 8.59 | 307.63 ± 6.79 | 305.62 ± 4.98 | 309.70 ± 8.65 |
| PLT (109/L) | 365.59 ± 91.49 | 402.00 ± 94.67 | 361.79 ± 90.48 | 360.34 ± 74.28 | 444.62 ± 84.64ab | 362.48 ± 63.21 |
| MPV (fL) | 11.74 ± 1.15 | 11.60 ± 1.09 | 11.69 ± 1.18 | 11.27 ± 1.17 | 11.39 ± 1.41 | 11.14 ± 1.11 |
| PCT (%) | 0.43 ± 0.09 | 0.46 ± 0.06 | 0.42 ± 0.09 | 0.41 ± 0.08 | 0.50 ± 0.06ab | 0.40 ± 0.06 |
| NEUT (109/L) | 7.76 ± 3.65 | 9.14 ± 3.00 | 7.04 ± 3.59 | 7.06 ± 3.65 | 7.90 ± 2.03 | 7.40 ± 3.13 |
| LYMPH (109/L) | 4.73 ± 2.07 | 6.97 ± 2.17ab | 5.42 ± 1.90a | 4.02 ± 1.90 | 7.47 ± 2.02ab | 3.74 ± 2.15 |
| MONO (109/L) | 0.79 ± 0.33 | 0.98 ± 0.31a | 0.88 ± 0.37 | 0.72 ± 0.35 | 0.90 ± 0.26b | 0.57 ± 0.27 |
| EO (109/L) | 0.14 ± 0.14 | 0.19 ± 0.15 | 0.16 ± 0.14 | 0.14 ± 0.13 | 0.17 ± 0.10 | 0.13 ± 0.14 |
| BASO (109/L) | 0.01 ± 0.01 | 0.02 ± 0.01ab | 0.01 ± 0.01 | 0.01 ± 0.01 | 0.01 ± 0.01ab | 0.01 ± 0.01 |
| NEUT% (%) | 56.95 ± 17.43 | 54.03 ± 10.41 | 52.11 ± 15.59 | 59.52 ± 19.84 | 48.07 ± 7.12ab | 60.95 ± 18.47 |
| LYMPH% (%) | 35.50 ± 15.51 | 38.51 ± 9.53 | 40.09 ± 13.74 | 32.69 ± 18.47 | 45.21 ± 7.36ab | 33.06 ± 16.89 |
| MONO% (%) | 5.79 ± 2.21 | 5.65 ± 1.43 | 6.35 ± 2.10 | 5.28 ± 2.23 | 5.52 ± 1.11 | 4.62 ± 1.98 |
| EO% (%) | 1.03 ± 1.03 | 1.26 ± 1.29 | 1.24 ± 1.05 | 1.11 ± 0.95 | 1.04 ± 0.46 | 1.13 ± 1.26 |
| BASO% (%) | 0.07 ± 0.05 | 0.11 ± 0.04ab | 0.07 ± 0.05 | 0.04 ± 0.05 | 0.11 ± 0.04ab | 0.04 ± 0.05 |
a, Significant (P<0.05) difference with respect to farm 1.
b, Significant (P<0.05) difference with respect to farm 3.
Table 4 Comparison of Biochemical Values Among the Three Monkey Farms
| Parameters (units) | Female 4–6 Y | Male 4–6 Y | |||
|---|---|---|---|---|---|
| Farm 1 (n=641) | Farm 2 (n=38) | Farm 3 (n=50) | Farm 1 (n=34) | Farm 2 (n=22) | |
| ALT (U/L) | 26.47 ± 17.87 | 26.75 ± 12.61 | 26.30 ± 16.37 | 29.44 ± 17.66 | 22.14 ± 9.81 |
| AST (U/L) | 52.29 ± 14.33 | 37.55 ± 11.67ab | 54.09 ± 14.76 | 52.53 ± 14.33 | 38.48 ± 8.90a |
| TP (g/L) | 76.63 ± 7.12 | 70.22 ± 5.35ab | 78.47 ± 6.94 | 78.44 ± 4.73 | 69.79 ± 5.42a |
| ALB (g/L) | 41.38 ± 5.88 | 38.93 ± 3.45ab | 42.09 ± 5.78 | 45.74 ± 4.24 | 39.32 ± 3.48a |
| TBIL (μmol/L) | 5.49 ± 1.55 | 1.59 ± 1.20ab | 4.78 ± 1.88a | 5.59 ± 2.01 | 1.33 ± 0.66a |
| D-BIL (μmol/L) | 1.50 ± 0.68 | 1.02 ± 0.44ab | 1.37 ± 0.67 | 1.36 ± 0.55 | 0.99 ± 0.43a |
| ALP (U/L) | 191.96 ± 80.80 | 194.39 ± 73.49b | 352.30 ± 147.87a | 233.88 ± 119.74 | 291.40 ± 215.09 |
| GLU (mmol/L) | 3.92 ± 1.73 | 5.68 ± 1.37ab | 4.20 ± 1.81 | 3.04 ± 0.98 | 6.11 ± 1.15a |
| BUN (mmol/L) | 6.62 ± 1.42 | 7.55 ± 1.51a | 7.23 ± 1.61a | 6.70 ± 1.39 | 7.61 ± 1.11a |
| CREA (μmol/L) | 77.35 ± 13.73 | 60.29 ± 11.37ab | 71.58 ± 18.37a | 95.96 ± 13.41 | 91.10 ± 15.29 |
| Ca (mmol/L) | 2.49 ± 0.14 | 2.49 ± 0.11 | 2.49 ± 0.14 | 2.56 ± 0.12 | 2.43 ± 0.10a |
| P (mmol/L) | 1.59 ± 0.34 | 1.47 ± 0.28ab | 1.66 ± 0.35 | 1.44 ± 0.30 | 1.65 ± 0.31a |
| CHOL (mmol/L) | 2.79 ± 1.04 | 2.79 ± 0.93 | 3.10 ± 0.86a | 2.73 ± 0.67 | 2.42 ± 0.52 |
| TG (mmol/L) | 0.55 ± 0.21 | 0.85 ± 0.40ab | 0.64 ± 0.41 | 0.46 ± 0.18 | 0.91 ± 0.49a |
| HDL-C (mmol/L) | 1.41 ± 0.54 | 1.31 ± 0.46b | 1.54 ± 0.42a | 1.52 ± 0.26 | 1.21 ± 0.27a |
| LDL-C (mmol/L) | 1.28 ± 0.55 | 1.41 ± 0.49 | 1.40 ± 0.57 | 1.15 ± 0.42 | 1.22 ± 0.36 |
| LDH (U/L) | 474.06 ± 213.51 | 390.26 ± 77.54ab | 499.66 ± 193.31 | 547.97 ± 252.03 | 360.70 ± 74.49a |
a, Significant (P<0.05) difference with respect to farm 1.
b, Significant (P<0.05) difference with respect to farm 3.
| Parameters (units) | Female 7–9 Y | Male 7–9 Y | ||||
|---|---|---|---|---|---|---|
| Farm 1 (n=597) | Farm 2 (n=17) | Farm 3 (n=47) | Farm 1 (n=51) | Farm 2 (n=8) | Farm 3 (n=23) | |
| ALT (U/L) | 27.23 ± 18.36 | 21.53 ± 14.65 | 29.46 ± 17.22 | 26.25 ± 18.74 | 32.75 ± 11.11 | 25.52 ± 17.30 |
| AST (U/L) | 47.36 ± 13.25 | 39.62 ± 12.99a | 44.29 ± 12.57 | 48.83 ± 12.69 | 42.50 ± 9.75 | 49.87 ± 15.66 |
| TP (g/L) | 77.59 ± 6.61 | 71.29 ± 5.94a | 73.43 ± 6.56a | 79.72 ± 4.97 | 72.25 ± 5.52ab | 79.01 ± 3.75 |
| ALB (g/L) | 42.26 ± 5.31 | 38.25 ± 4.07a | 39.06 ± 5.41a | 46.57 ± 3.46 | 41.16 ± 3.96ab | 46.95 ± 1.89 |
| TBIL (μmol/L) | 5.27 ± 1.61 | 1.46 ± 1.02ab | 5.65 ± 1.63 | 5.42 ± 1.45 | 1.54 ± 0.90ab | 5.22 ± 1.82 |
| D-BIL (μmol/L) | 1.44 ± 0.63 | 0.94 ± 0.41ab | 1.45 ± 0.52 | 1.55 ± 0.71 | 1.20 ± 0.37a | 1.45 ± 0.65 |
| ALP (U/L) | 160.56 ± 56.37 | 151.13 ± 48.75b | 74.07 ± 9.01a | 164.44 ± 45.08 | 116.12 ± 30.12ab | 89.09 ± 15.32a |
| GLU (mmol/L) | 4.11 ± 1.70 | 5.37 ± 0.86ab | 4.39 ± 1.83 | 3.36 ± 1.35 | 4.66 ± 0.89ab | 3.55 ± 0.94 |
| BUN (mmol/L) | 6.45 ± 1.49 | 7.19 ± 1.72b | 6.06 ± 1.47 | 7.09 ± 1.20 | 7.77 ± 1.93b | 6.47 ± 1.32 |
| CREA (μmol/L) | 77.30 ± 14.12 | 77.00 ± 16.78 | 75.20 ± 14.97 | 104.43 ± 12.98 | 94.29 ± 16.04b | 108.21 ± 10.22 |
| Ca (mmol/L) | 2.50 ± 0.15 | 2.48 ± 0.12 | 2.45 ± 0.16 | 2.57 ± 0.10 | 2.51 ± 0.11 | 2.54 ± 0.13 |
| P (mmol/L) | 1.47 ± 0.32 | 1.34 ± 0.24 | 1.39 ± 0.26 | 1.48 ± 0.29 | 1.49 ± 0.18 | 1.51 ± 0.23 |
| CHOL (mmol/L) | 3.06 ± 0.99 | 3.18 ± 0.74b | 2.27 ± 0.81a | 3.09 ± 0.63 | 2.69 ± 0.56 | 2.83 ± 0.68 |
| TG (mmol/L) | 0.71 ± 0.36 | 0.88 ± 0.45b | 0.58 ± 0.32a | 0.60 ± 0.43 | 1.43 ± 0.86ab | 0.66 ± 0.39 |
| HDL-C (mmol/L) | 1.57 ± 0.51 | 1.47 ± 0.26b | 1.19 ± 0.49a | 1.66 ± 0.36 | 1.27 ± 0.13ab | 1.58 ± 0.39 |
| LDL-C (mmol/L) | 1.35 ± 0.57 | 1.63 ± 0.54b | 1.02 ± 0.40a | 1.31 ± 0.50 | 1.41 ± 0.45 | 1.13 ± 0.42 |
| LDH (U/L) | 468.18 ± 219.13 | 374.20 ± 89.39ab | 499.05 ± 213.03 | 435.41 ± 222.26 | 381.62 ± 90.03 | 386.63 ± 197.66 |
a, Significant (P<0.05) difference with respect to farm 1.
b, Significant (P<0.05) difference with respect to farm 3.
Correlation of hematological and biochemical parameters with age
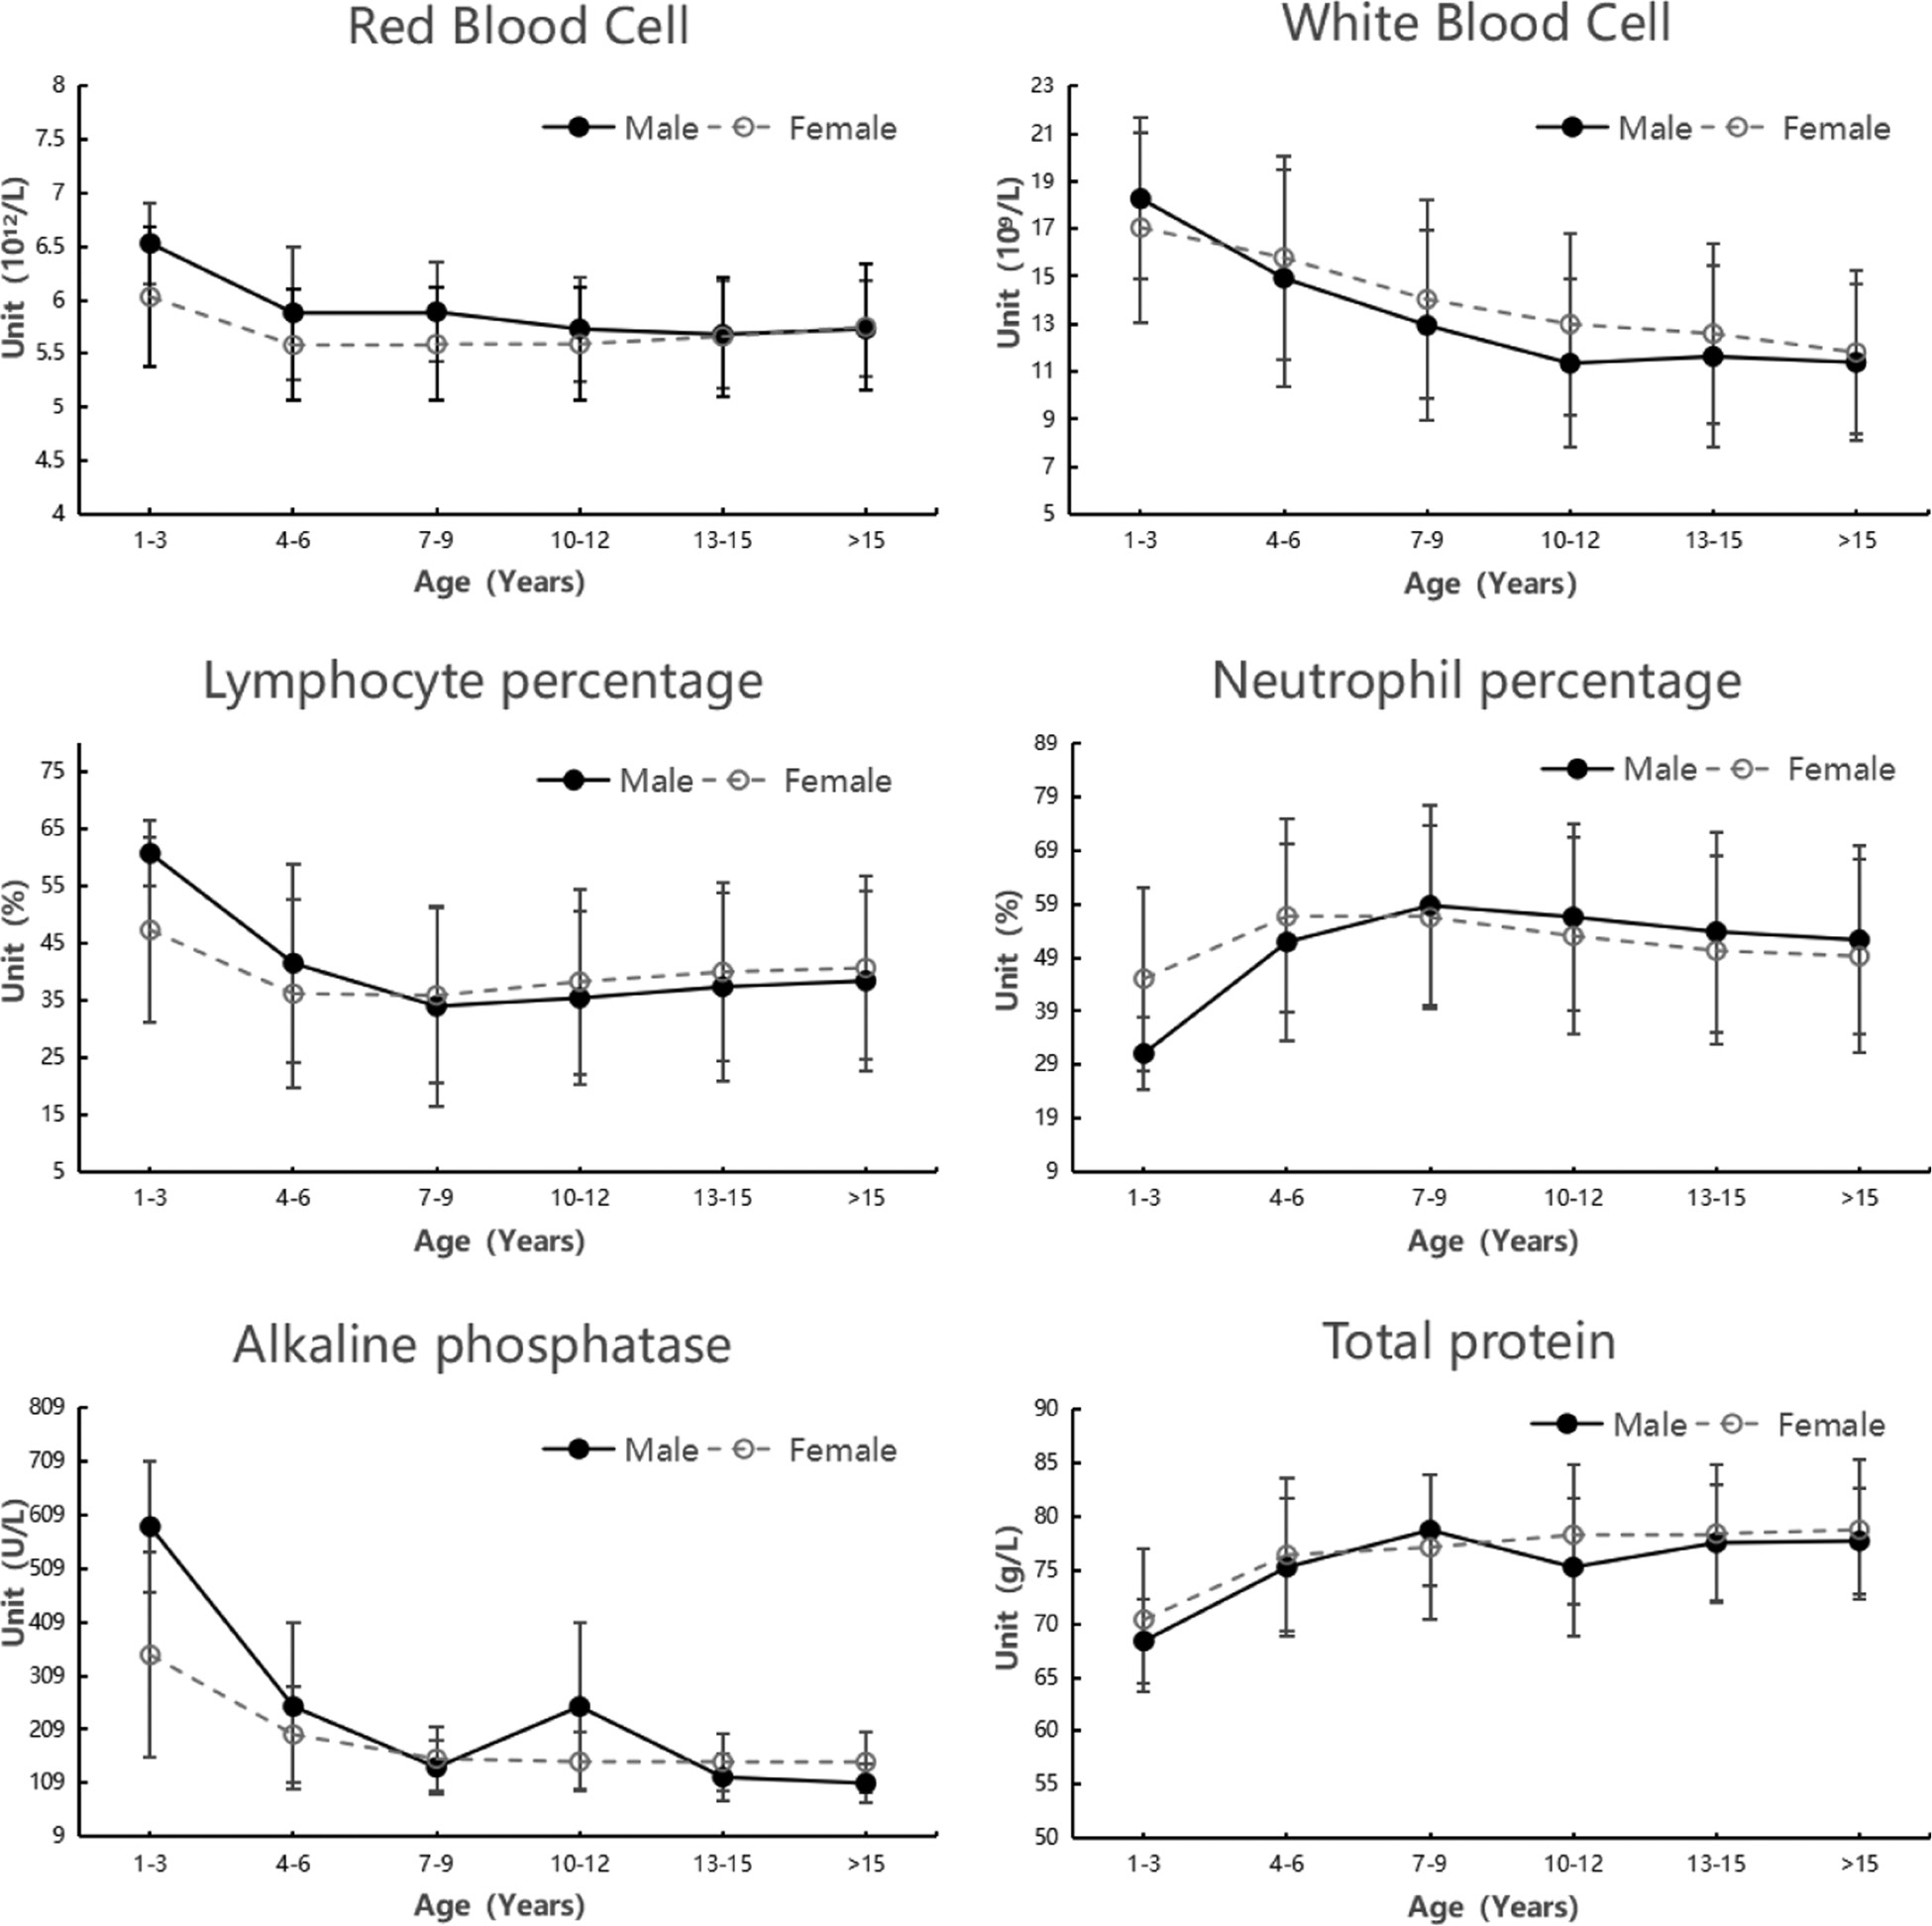
The correlation analysis of hematological and biochemical parameters with age is presented in Table 5. WBC, RBC, HGB, HCT, LYMPH, LYMPH%, ALP, GLU, BUN, TG, and LDH values were significantly higher in the 1–3 Y group than the other age groups. RBC and ALP levels were generally higher in males than in females, and the difference gradually decreased with age (Figure 1). The serum TP and NEUT% increased with age in the 1–3 Y and 4–6 Y groups, and remained stable thereafter. Moreover, LYMPH% showed an opposite trend from NEUT%.
Table 5 Correlation of All Parameters with Age
| Parameters | P-value | |||||
|---|---|---|---|---|---|---|
| Age 1–3 Y | Age 4–6 Y | Age 7–9 Y | Age 10–12 Y | Age 12–15 Y | Age above 15 Y | |
| WBC | NS | <0.01 | NS | <0.05 | NS | NS |
| RBC | <0.01 | NS | NS | <0.01 | NS | <0.05 |
| HGB | <0.01 | NS | NS | NS | NS | <0.01 |
| HCT | <0.01 | NS | NS | NS | NS | <0.01 |
| MCV | <0.01 | <0.01 | NS | <0.05 | NS | NS |
| MCH | <0.01 | NS | NS | <0.01 | NS | NS |
| MCHC | NS | <0.01 | NS | NS | NS | <0.05 |
| PLT | NS | <0.01 | <0.01 | NS | NS | <0.05 |
| MPV | <0.05 | NS | <0.01 | NS | NS | NS |
| PCT | NS | <0.01 | <0.01 | NS | NS | <0.05 |
| NEUT | <0.01 | NS | NS | <0.01 | NS | NS |
| LYMPH | <0.01 | <0.01 | NS | NS | <0.05 | NS |
| MONO | NS | <0.01 | NS | NS | NS | <0.01 |
| EO | NS | <0.01 | NS | <0.01 | NS | NS |
| BASO | <0.01 | <0.01 | NS | NS | NS | NS |
| NEUT% (%) | <0.01 | <0.01 | NS | <0.01 | NS | NS |
| LYMPH% (%) | <0.01 | <0.01 | NS | <0.01 | NS | NS |
| MONO% (%) | <0.01 | <0.05 | NS | <0.05 | <0.05 | NS |
| EO% (%) | NS | <0.01 | NS | <0.01 | NS | NS |
| BASO% (%) | <0.01 | NS | <0.05 | NS | NS | NS |
| ALT | NS | <0.01 | <0.01 | NS | NS | NS |
| AST | NS | <0.01 | <0.01 | NS | NS | NS |
| TP | <0.01 | <0.05 | NS | <0.05 | NS | NS |
| ALB | NS | NS | <0.01 | NS | <0.05 | NS |
| TBIL | <0.01 | <0.01 | <0.05 | NS | NS | NS |
| D-BIL | <0.01 | <0.01 | NS | <0.05 | NS | <0.01 |
| ALP | <0.01 | <0.01 | NS | NS | NS | NS |
| GLU | <0.01 | NS | NS | <0.01 | NS | <0.01 |
| BUN | <0.01 | <0.01 | NS | NS | <0.05 | NS |
| CREA | <0.01 | <0.01 | <0.01 | <0.05 | NS | NS |
| Ca | NS | NS | <0.01 | NS | NS | <0.01 |
| P | <0.01 | <0.01 | NS | <0.01 | NS | NS |
| CHOL | <0.01 | <0.01 | NS | NS | NS | NS |
| TG | <0.01 | NS | <0.01 | <0.05 | NS | <0.05 |
| HDL-C | NS | <0.01 | <0.05 | NS | NS | NS |
| LDL-C | <0.01 | NS | NS | NS | NS | NS |
| LDH | NS | <0.01 | <0.01 | NS | NS | <0.01 |
*NS, not significant.
Figure 1 Changes in red blood cell count, white blood cell count, lymphocyte percentage, neutrophil percentage, alkaline phosphatase, and total protein in males and females with age.
Discussion
Our study provided a reference database of hematologic and biochemical parameters in 4,834 healthy cynomolgus monkeys of a range of ages, and determined the effects of age, sex, and colony conditions on these parameters. Cynomolgus monkeys, the most commonly used non-human primate experimental animals, substantially contribute to many biomedical research fields [12]. The goal of our study was to establish the reference ranges of hematologic and biochemical parameters in healthy cynomolgus monkeys for evaluating healthy individuals, constructing disease models, improving the effectiveness of disease diagnosis and treatment, and evaluating drug safety in non-clinical research. Moreover, we provide data on old age groups not reported in previous studies. However, the results were affected by factors including housing [16], feeding, fasting, and sedation.
Animals in our study were housed indoors in mixed-sex social groups in large cages, but under laboratory conditions, they were usually transferred into individual cages providing a relatively small space. This change in living environment might have caused stress, which consequently directly influenced the sympathetic adrenal medulla system and potentially led to the production of stress hormones, such as epinephrine, that increased blood parameters (e.g., WBC).
Previous research has reported the differences in blood hematologic and biochemical measurements according to age and sex [7]. For example, hematologic and biochemical parameters including RBC, HGB, HCT, ALP, and CREA have shown significant effects dependent on both age and sex, in agreement with our statistical results. In addition, WBC, HGB, and MCHC displayed high variability within the age range from 1 to 5 Y, and the values were significantly higher in this group than in other groups. Some concentrations of serum biochemical parameters were significantly lower within the age range from 1 to 5 Y, such as ALT, ALP, LDH, and TP, whereas the concentration of TBIL was significantly higher within the age range from 3 to 5 Y, possibly because of the environmental and breeding conditions.
Because geographical location, breeding conditions, and climatic factors may affect hematological and biochemical values, we compared and analyzed the variations in the results among the three monkey farms, and found significant differences in hematological parameters, including RBC, HGB, and HCT values. The three monkey farms in our study are located in Kunming and Guangzhou in China. Kunming, in a temperate climatic zone, is located in the central Yunnan-Guizhou Plateau, southwest China (102°10’ to 103°40’ E, 24°23’ to 26°22’ N), where altitudes range from 1500 m to 2800 m. Guangzhou, in a subtropical climate zone, is located in south China (112°57’ to 114°3’ E, 22°26’ to 23°56’ N), where altitudes range from 0 m to 1210 m. In the present study, the results (Table 3) demonstrated that the WBC, RBC, HGB, LYMPH, and LYMPH% values were significantly higher, whereas the NEUT% values were lower, in the Kunming animals than the Guangzhou animals, thus supporting the hypothesis that adaptation to lower oxygen at high altitude results in a physiological increase in RBC and hemoglobin concentration [17].
A comparison of the ALP and LDH values among age groups indicated that the concentrations of ALP and LDH in juveniles were significantly higher than those in other age groups. The ALP level decreased with age, then reached a stable level in adults. ALP is produced in the liver, bones, small intestine, and placenta, and usually reflects bone anabolism [18, 19]. It may be associated with elevated osteoblast activity in juvenile monkeys. A similar change in ALP level has also been reported by Ogawa [20]. Previous studies have indicated that ALP is significantly higher in patients with metastatic prostatic cancer, and may serve as a prognostic marker of bone metastases and multiple osteoblastic lesions. [21] Therefore, detecting ALP levels is meaningful in diagnosing and monitoring bone diseases, as well as evaluating drug efficacy. Although serum LDH levels are known to increase under myocardial injury and liver injury, we observed significantly higher LDH in the juvenile monkeys than in the other age groups, in agreement with a report by Koga et al. [22]. Whether this finding was associated with high levels of aerobic metabolism in juvenile monkeys remains to be further studied.
In conclusion, reference ranges for healthy cynomolgus monkeys were established according to age and sex in this study. Researchers and laboratory technicians routinely need to identify etiological factors, improve clinical care, and establish human disease models and new drug screening. However, multiple uncontrollable factors, including differences between individuals and breeding environments, affect hematologic and biochemical values, thus resulting in differences in data between laboratories. The above factors should therefore be considered in practical applications.
Financial support
This work was supported by the National key research and development program of China (2021YFF0702600), and the Guangdong Provincial Platform Base and Science and Technology Infrastructure Construction Project (No. 2021B1212060002).
References
- Pena JC, Ho WZ. Non-human primate models of tuberculosis. Microbiol Spectr 2016;4 . [PMID: 27726820 DOI: 10.1128/microbiolspec.TBTB2-0007-2016]
- Tsuji K, Nakamura S, Aoki T, Nozaki K. The cerebral artery in cynomolgus monkeys (Macaca fascicularis). Exp Anim 2022. [PMID: 35444076 DOI: 10.1538/expanim.22-0002]
- Gao F, Zhang X. Pharmacokinetic profiles of a SARS-COV-2 neutralizing antibody BD-604 in cynomolgus monkeys. Drug Test Anal 2021;13:1727-34. [PMID: 34215019 DOI: 10.1002/dta.3122]
- Dan L, Xiaohong L, Yaoping T, et al. Preliminary study on establishment and evaluation of spleen-stomach damp-heat syndrome model of cynomolgus monkey with acute alcoholic fatty liver. China J Tradit Chin Med Pharm 2021;36:1374-78.
- Wei W, Li S, Cheng L, Hao E, Hou H, et al. Comprehensive characterization of the chemical constituents in Yiganmingmu oral liquid and the absorbed prototypes in cynomolgus monkey plasma after oral administration by UPLC-Q-TOF-MS based on the self built components database. Chin Med 2021;16:35. [PMID: 33910600 DOI: 10.1186/s13020-021-00443-0]
- Zhao J, Wang J, Dang J, Zhu W, Chen Y, et al. A preclinical study-systemic evaluation of safety on mesenchymal stem cells derived from human gingiva tissue. Stem Cell Res Ther 2019;10:165. [PMID: 31196163 DOI: 10.1186/s13287-019-1262-5]
- Xie L, Xu F, Liu S, Ji Y, Zhou Q, et al. Age- and sex-based hematological and biochemical parameters for Macaca fascicularis. PLoS One 2013;8:e64892. [PMID: 23762263 DOI: 10.1371/journal.pone.0064892]
- Amato R, Gardin JF, Tooze JA, Cline JM. Organ weights in relation to age and sex in cynomolgus monkeys (Macaca fascicularis). Toxicol Pathol 2022. [PMID: 35383510 DOI: 10.1177/01926233221088283]
- Koo B S, Lee D H, Kang P, Jeong KJ, Lee S, et al. Reference values of hematological and biochemical parameters in young-adult cynomolgus monkey (Macaca fascicularis) and rhesus monkey (Macaca mulatta) anesthetized with ketamine hydrochloride. Lab Anim Res 2019;35:7. [DOI: 10.1186/s42826-019-0006-0]
- Schuurman HJ, Smith HT. Reference values for clinical chemistry and clinical hematology parameters in cynomolgus monkeys. Xenotransplantation 2005;12:72-5. [PMID: 15598276 DOI: 10.1111/j.1399-3089.2004.00186.x]
- Spiller GA, Spaur CL, Amen RJ. Selected blood values for Macaca nemestrina fed semipurified fiber-free liquid diets. Lab Anim Sci 1975;25:341-3. [PMID: 1142729]
- Pang W, Lu LB, Wang Y, Li G, Huang DT, et al. [Measurement and analysis of hematology and blood chemistry parameters in northern pig-tailed macaques (Macaca leonina). Dongwuxue Yanjiu 2013;34:89-96. [PMID: 23572357 DOI: 10.3724/SP.J.1141.2013.02089]
- Pierre PJ, Sequeira MK, Corcoran CA, Blevins MW, Gee M, et al. Hematological and serum biochemical indices in healthy bonnet macaques (Macaca radiata). J Med Primatol 2011;40:287-93. [PMID: 21366603 DOI: 10.1111/j.1600-0684.2011.00466.x]
- Goodrich JA, Ward GS, Swindle MM. Normal serum biochemical and hematological values of the Sulawesi macaques. J Med Primatol 1995;24:17-28. [PMID: 7563007 DOI: 10.1111/j.1600-0684.1995.tb00140.x]
- Research N R C U. Guide for the Care and Use of Laboratory Animals. Washington (DC): National Academies Press (US); 1996.
- Xie L, Zhou Q, Liu S, Xu F, Shively CA, et al. Effect of living conditions on biochemical and hematological parameters of the cynomolgus monkey. Am J Primatol 2014;76:1011-24. [PMID: 24990222 DOI: 10.1002/ajp.22285]
- Gassmann M, Mairbaurl H, Livshits L, Seide S, Hackbusch M, et al. The increase in hemoglobin concentration with altitude varies among human populations. Ann N Y Acad Sci 2019;1450:204-20. [PMID: 31257609 DOI: 10.1111/nyas.14136]
- Zhou L, Wang J, Li J, Li T, Chen Y, et al. 1,25-Dihydroxyvitamin D3 ameliorates collagen-induced arthritis via suppression of Th17 cells through miR-124 mediated inhibition of IL-6 signaling. Front Immunol 2019;10:178. [PMID: 30792721 DOI: 10.3389/fimmu.2019.00178]
- Luo Y, Wu W, Gu J, Zhang X, Dang J, et al. Human gingival tissue-derived MSC suppress osteoclastogenesis and bone erosion via CD39-adenosine signal pathway in autoimmune arthritis. EBioMedicine 2019;43:620-31. [PMID: 31076346 DOI: 10.1016/j.ebiom.2019.04.058]
- Ogawa LM, Vallender EJ. Genetic substructure in cynomolgus macaques (Macaca fascicularis) on the island of Mauritius. BMC Genomics 2014;15:748. [DOI: 10.1186/1471-2164-15-748]
- Annibali O, Petrucci M T, Santini D, Bongarzoni V, Russano M, et al. Alkaline phosphatase (alp) levels in multiple myeloma and solid cancers with bone lesions: is there any difference? J Bone Oncol 2021;26:100338. [PMID: 3304804 DOI: 10.1016/j.jbo.2020.100338]
- Koga T, Kanefuji K, Nakama K. Individual reference intervals of hematological and serum biochemical parameters in cynomolgus monkeys. Int J Toxicol 2005;24:377-85. [PMID: 16257857 DOI: 10.1080/10915810500208058]